Australia's youth:
Physical activity
Web article
Last updated:
Topic: Children & youth
Part of Australia's youth
Citation
AIHW (Australian Institute of Health and Welfare) (2021) Physical activity, AIHW, Australian Government, accessed 27 July 2026.
How many young people are sufficiently active?
The following analysis of physical activity includes workplace activity (see Box 1 for more information).
In 2017–18, based on self-reported data from the NHS it is estimated that:
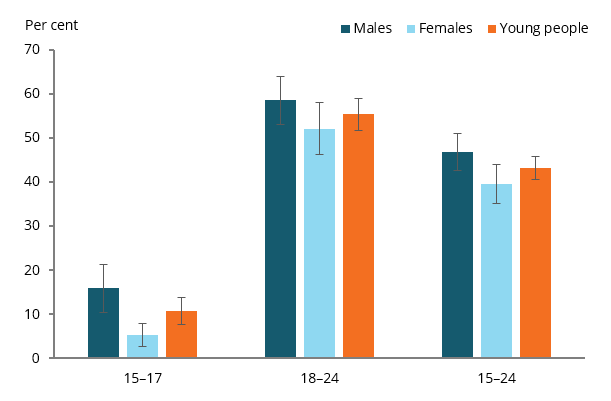
- just over 1 in 10 (11% or 89,100) of all 15–17 year olds were sufficiently active for their age, with the proportion higher among males (16% or 67,700) than among females (5.3% or 21,400)
- over half (55% or 1.2 million) of all 18–24 year olds were sufficiently active for their age, with similar proportions among males (59% or 663,800) and females (52% or 570,300) (Figure 1).
The higher proportion of 18–24 year olds who were sufficiently active is largely due to the different physical activity guidelines for this age group compared with those for 15–17 year olds (150 minutes of physical activity across the week compared with 420 minutes).
The most recent data available on young people who met the sedentary screen‑based behaviour are from the Australian Health Survey (AHS): Nutrition and physical activity, 2011–12. Findings show that almost 1 in 5 (19%) 15–17 year olds met the sedentary screen-based behaviour (AIHW 2018). As mentioned earlier, there are not specific sedentary behaviour guidelines for 18–24 year olds.
Figure 1: Proportion of young people who were sufficiently active, by age group and sex, 2017–18
Note: Data include workplace physical activity.
Chart: AIHW.
Source: ABS 2019.
How has physical activity changed over time?
The following analysis of physical activity over time excludes workplace activity (see Box 1 for more information).
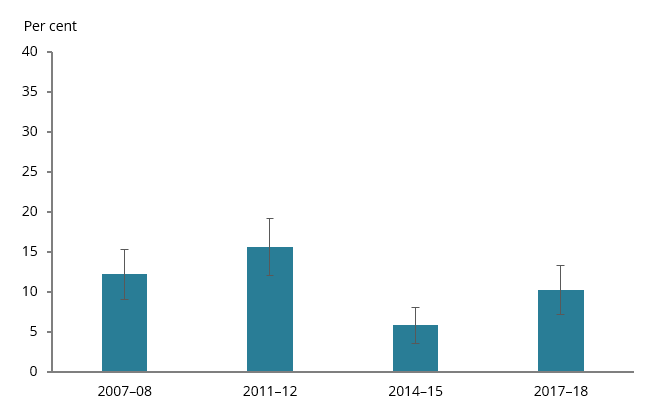
In 2017–18, the proportion of 15–17 year olds who were sufficiently active was similar to that for 2007–08 (10% and 12%, respectively) (Figure 2). However, the proportion has fluctuated over time, dropping between 2011–12 and 2014–15 (from 16% to 5.8%) before returning to 10% in 2017–18. The drop between 2011–12 and 2014–15 applied to both males and females aged 15–17.
Figure 2: Proportion of young people aged 15–17 who were sufficiently active, 2007–08 to 2017–18
Note: Data exclude workplace physical activity.
Chart: AIHW.
Source: ABS 2019.
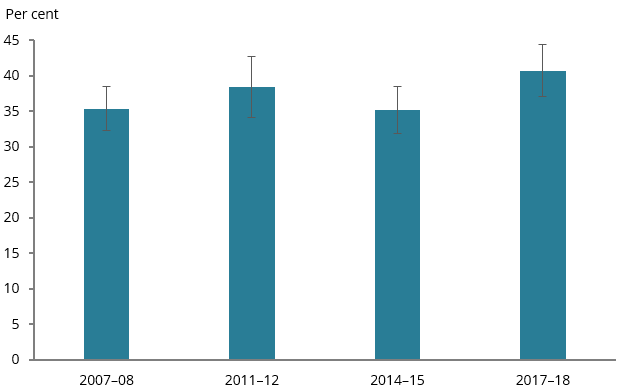
The proportion of young people aged 18–24 who were sufficiently active was higher in 2017–18 than in 2007–08 (41% and 35%) (Figure 3). The greatest increase over time was between 2014–15 and 2017–18 (from 35% to 41%). The proportion of females aged 18–24 who were sufficiently active was higher in 2017–18 than in 2007–08 (41% and 33%).
Figure 3: Proportion of young people aged 18–24 who were sufficiently active, 2007–08 to 2017–18
Note: Data exclude workplace physical activity.
Chart: AIHW.
Source: ABS 2009; 2013; 2016; 2019.
How many young people are doing enough muscle strengthening activity?
In 2017–18, based on self–reported data from the NHS:
- just under 1 in 6 (16% or 133,900) 15–17 year olds undertook the recommended amount of muscle strengthening activities, with the proportion higher among males (22% or 96,600) than among females (9.1% or 37,300)
- around 1 in 3 (36% or 795,700) 18–24 year olds undertook the recommended amount of muscle strengthening activities, with the proportion higher among males (40% or 454,700) than among females (31% or 341,000) (Figure 4).
The muscle strengthening guidelines differs by age group.
Figure 4: Proportion of young people who met the muscle strengthening guidelines, by age group and sex, 2017–18
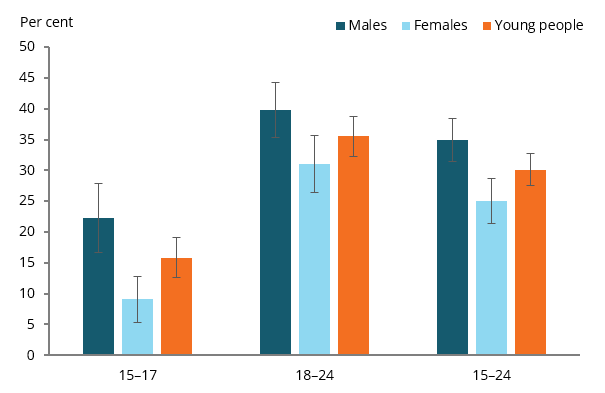
Chart: AIHW.
Source: ABS 2019.
What types of physical activity are young people doing?
The 2019 AusPlay survey asked people aged 15 and over whether they had participated in any physical activities for sport, for exercise, or for recreation in the last 12 months. The proportion of young people who participated at least once a week was:
- 89% (752,900) of those aged 15–17
- 83% (2.0 million) of those aged 18–24 (ASC 2020).
The most popular activities for young people aged 15–17 were:
- fitness/gym (26% or 220,200)
- athletics, track and field (including jogging and running) (25% or 209,500)
- football/soccer (22% or 182,600) (ASC 2020) (Figure 5a).
For those aged 18–24, the most popular activities were
- fitness/gym (46% or 1.1 million)
- athletics, track and field (including jogging and running) (23% or 543,200)
- walking (recreational) (22% or 528,500) (Figure 5b).
Figures 5: Top 10 most popular physical activities for young people aged 15–17 and 18–24, 2019
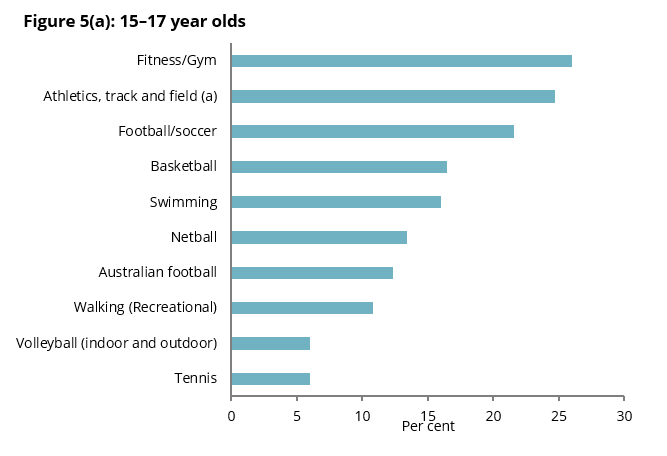
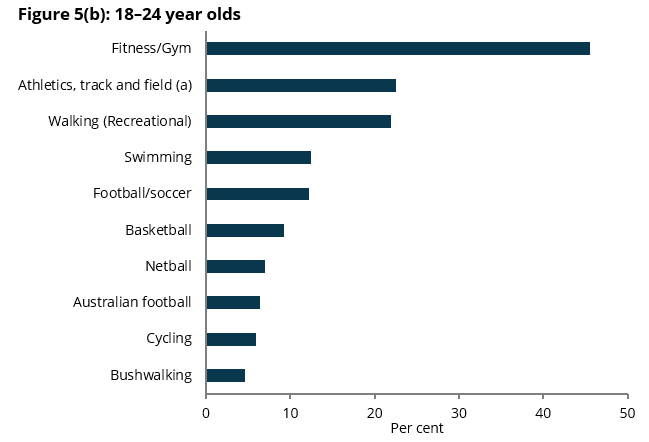
(a) Athletics, track and field includes jogging and running.
Note: Data based on participation in activities at least once a year.
Chart: AIHW.
Source: ASC 2020.
What motivates young people to participate in physical activity?
In 2019, the top motivators for participating in physical activity among young people aged 15–17 and 18–24 differed:
- Among 15–17 year olds, the top motivator was fun/enjoyment (71%), followed by physical health or fitness (64%). The third motivator was social reasons (38%) followed by performance or competition (14%).
- Among 18–24 year olds, the top motivator was Physical health or fitness (75%) followed by fun/enjoyment (53%). The third motivator was social reasons (35%) followed by psychological/mental health therapy (21%) (ASC 2020).
What are the barriers to participating in physical activity?
The most commonly reported barriers to participation in physical activity for those aged 18–24 were:
- not enough time/too many other commitments (37%)
- poor health or injury (12%) or too lazy (11%) (ASC 2020).
Do physical activity and muscle strengthening activities vary by population?
In 2017–18, the proportion of young people aged 15–24 who undertook sufficient physical activity was higher in:
- the highest socioeconomic areas than in the lowest socioeconomic areas (48% and 36%) (Figure 6).
Figure 6: Young people aged 15–24 who were sufficiently active, by selected population groups, 2017–18
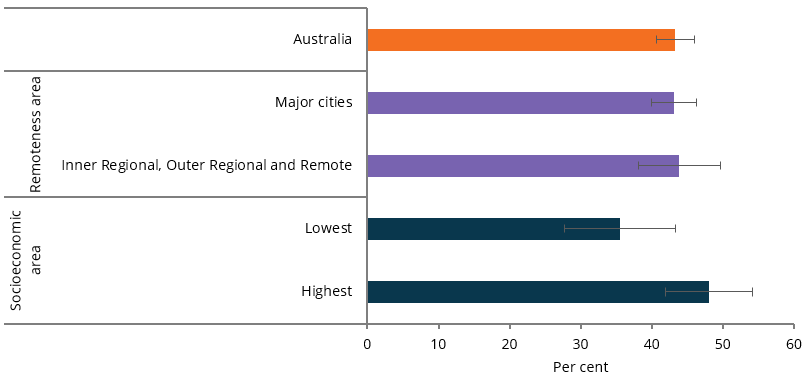
Note: Data include workplace physical activity.
Chart: AIHW.
Source: ABS 2019.
The proportion of young people who undertook sufficient muscle strengthening activities was higher in:
- Major cities (33%) than in Inner regional, Outer regional and Remote areas combined (20%)
- the highest socioeconomic areas than in the lowest socioeconomic areas (39% compared with 25%) (Figure 7).
Figure 7: Young people aged 15–24 who met the muscle strengthening guidelines, by selected population groups, 2017–18
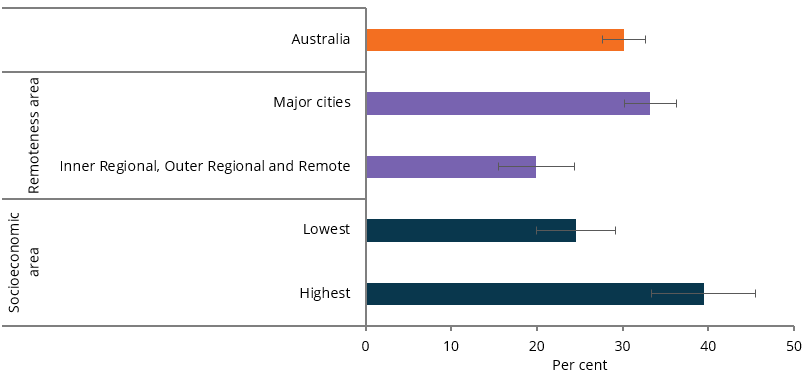
Note: Socio-economic areas are based on quintiles of the Socio-Economic Indexes for Areas (SEIFA) 2016 Index of Relative Socio-Economic Disadvantage.
Chart: AIHW.
Source: ABS 2019.
Box 2: How many young people get enough sleep?
Getting enough sleep is important for a young person’s health, regulation of emotions and school functioning (Evans-Whipp & Gasser 2019). The amount of sleep needed varies with age. The Department of Health recommends between 8 and 10 hours for young people aged 14–17 (DoH 2021c). The Sleep Health Foundation also recommends keeping a regular sleep–wake routine (Sleep Health Foundation 2011).
Based on research from the LSAC, in 2016, over half (52%) of those aged 16–17 did not get the required amount of sleep on school nights (Evans-Whipp & Gasser 2019). Non-school nights provide opportunities to catch up on sleep missed during the week (Evans-Whipp & Gasser 2019).
Young people aged 16–17 slept an average of 8.1 hours on school nights, and over an hour longer on non-school nights (Evans-Whipp & Gasser 2019). Among those aged 16–17, on non-school nights, females slept for longer than males (9.4 hours compared with 9.1 hours), but there was little difference on school nights (8.1 and 8.0 hours, respectively) (Evans-Whipp & Gasser 2019).
Among young people aged 16–17, 13% of males and 20% of females reported that they had poor quality sleep (Evans-Whipp & Gasser 2019).
Where do I find more information?
For information on topics related to physical activity in this report, see:
For information on Indigenous young people and physical activity, see:
- Section 4.5, Physical activity of Aboriginal and Torres Strait Islander adolescent and youth health and wellbeing 2018
- Measure 2.18, Physical activity of Aboriginal and Torres Strait Islander Health Performance Framework (HPF) report 2020
For information on children and physical activity, see:
- screen-based activity among children and young people aged 2–17: Physical activity across the life stages.
For more information on:
- physical activity levels among different age groups: Physical activity across the life stages and Australia’s Health 2018: Insufficient physical activity.
- muscle strengthening activities: Muscle-strengthening activities among Australian adults
- sleep: Are children and adolescents getting enough sleep?.