Australia's youth:
Non-school qualifications
Web article
Last updated:
Topic: Children & youth
Part of Australia's youth
Citation
AIHW (Australian Institute of Health and Welfare) (2021) Non-school qualifications, AIHW, Australian Government, accessed 17 July 2026.
Key findings
- In 2020, 89% of young people aged 20–24 had completed Year 12 or equivalent or gained a qualification at Certificate III or above.
- The proportion of young people aged 15–24 studying non-school qualifications increased between 2011 and 2016 (from 33% to 36%) and has remained steady since (36% in 2020).
- 19% of undergraduate students (aged under 25) and 15% of postgraduate coursework students (aged under 25) considered early departure from their study. The most common reason given for both groups was health or stress (46% and 37%, respectively).
In Australia, it is mandatory for young people to complete Year 10 or an approved equivalent and to continue full-time education, employment or training (or a combination) until at least 17 years of age (ACARA 2020; SCRGSP 2020). After Year 10, many young people continue their studies in senior secondary schooling (years 11 and 12) or in vocational education and training (VET).
Completing Year 12 or an equivalent non-school qualification (including VET qualifications) is an important milestone for future success and for taking on further education or training (ABS 2011). National targets have been set to increase the proportion of people who have completed Year 12 or equivalent or a non-school qualification at Certificate III or above (see Where do I find more information?).
Non-school qualifications can be completed through either higher education or VET. Apprenticeships and traineeships are a central component of the VET system and allow people to participate in paid employment and on-the-job training, leading to formal qualifications that meet national standards (Knight 2012). Universities are a major provider of higher education, along with for‑profit and not-for-profit institutions and Technical and Further Education (TAFE) institutes (TEQSA 2018).
Higher qualifications are associated with higher earnings throughout an individual’s life as well as improved health, wellbeing and life satisfaction (Norton & Cherastidtham 2019; OECD 2019). National targets have been set to increase the number of higher level qualifications (see Where do I find more information?).
Continued education and training of individuals in the workforce are also key factors in maximising the capabilities of workers and increasing workforce participation and productivity (Skills Australia 2010).
This section provides some data from the early COVID-19 period (for qualifications only). For more information on the overall impact of COVID-19 on young people including education, see COVID-19 and the impact on young people.
Box 1: Data sources and definitions
ABS Survey of Education and Work
Data from the ABS Survey of Education and Work (ABS SEW), a supplement to the Labour Force Survey, are reported here. The survey is conducted in early May annually. It collects information on participation in education, non-school qualifications, transition from education to work, and current labour force and demographic characteristics for populations aged 15–74. The ABS SEW also collects some data on apprentices and trainees. Non-school qualifications are defined as qualifications awarded for educational attainments other than those of pre-primary, primary or secondary education (ABS 2020a). Non-school qualifications may be attained concurrently with school qualifications.
National Centre for Vocational Education Research National Apprentices and Trainees Collection
The National Centre for Vocational Education Research (NCVER) is a national body that collects, manages, analyses and communicates statistics and research on the VET sector in Australia, including the National Apprentices and Trainees Collection. The collection holds data on all people employed under a training contract and includes both apprentices and trainees. Hence, the data on apprentices and trainees are more complete than the sample included in the ABS Survey of Education and Work. Data are collected from state training authorities and include demographic information, schooling and prior education, and cultural and language attributes of people participating in an apprenticeship/traineeship training contract.
Student experience survey
The Student Experience Survey (SES) is a national survey of current higher education students in Australia, funded by the Department of Education, Skills and Employment and administered by the Social Research Centre since 2015. The SES collects student feedback on various aspects of their higher education experience including overall quality of educational experience, teaching quality, learner engagement, learning resources, student support and skills development. Higher education students can be attending universities or other non-university higher education institutions, such as TAFE institutes.
Box 2: How many young people attained Year 12 (or equivalent) or Certificate III (or above)?
In 2020, 89% (or 1.5 million) of young people aged 20–24 had completed Year 12 or equivalent or gained a qualification at Certificate III or above. There was no significant change from the proportion in 2018 (89% or 1.5 million) (PC 2020).
In 2020, the proportion of young people aged 20–24 who had completed Year 12 or equivalent or gained a qualification at Certificate III or above was:
- higher for females than males (92% or 768,000 compared with 87% or 764,000)
- higher for those living in Major cities (92% or 1.3 million) than those living in Inner regional areas (79% or 182,000)
- higher for those living in the highest socioeconomic areas (95% or 392,000) than those living in the lowest socioeconomic areas (79% or 223,000) (ABS 2020b).
For reporting on the proportion of all estimated Year 12 students in a given year who meet the requirements of a Year 12 or equivalent qualification, see the Report on Government Services 2020.
How many young people are studying for non-school qualifications?
Based on data from the ABS SEW, in May 2020, 36% (or 1.1 million) of young people aged 15–24 were studying for a non-school qualification: 1 in 3 (33% or 546,000) males and 2 in 5 (38% or 593,000) females (ABS 2020b).
More 20–24 year olds were studying for a non-school qualification than 15–19 year olds (44% compared with 26%) (ABS 2020b). Overseas residents in Australia are not included in these proportions (see Technical notes).
Among young people aged 15–19 and 20–24, for both age groups:
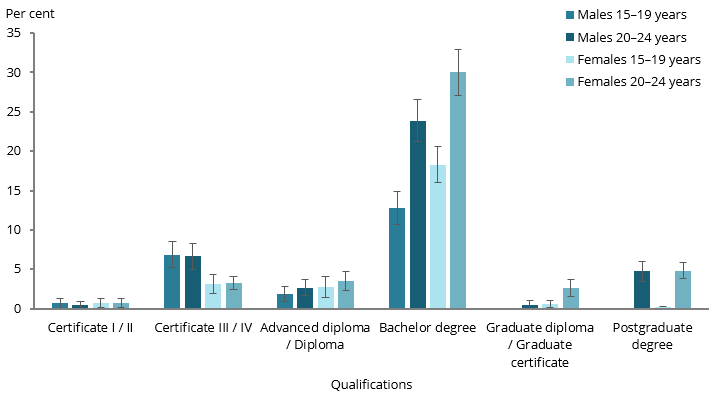
- bachelor degrees were the most commonly studied qualifications
- females were more likely to study a bachelor degree than males
- males were more likely to study a Certificate III or IV than females (Figure 1).
Figure 1: Level of qualification of current study for young people aged 15–24, by age group and sex, 2020
Notes
- Calculated percentages include categories ‘level not determined’ and ‘Certificate not fully defined’ but data are not shown.
- Proportions with relative standard errors greater than 50% are considered too unreliable for use and are not shown.
- The following variables have relative standard errors between 25% and 50% and should be used with caution: Males aged 15–19 Certificate I/II and Advanced diploma/Diploma; Males aged 20–24 Certificate I/II and Graduate diploma/Graduate certificate; Females aged 15–19 Certificate I/II and Graduate diploma/Graduate certificate; and Females aged 20–24 Certificate I/II.
Chart: AIHW.
Source: ABS SEW 2020.
What are the main fields of study for young people?
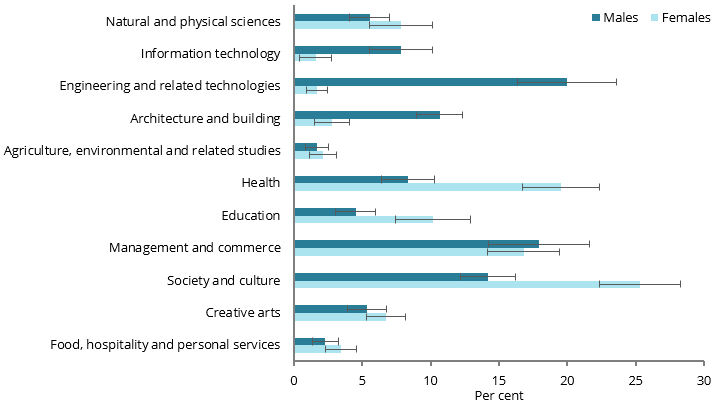
Based on data from the ABS SEW, in May 2020, of all young people aged 15–24 studying a non-school qualification (1.1 million young people), the top 3 main fields of study were society and culture (20% or 227,000), management and commerce (17% or 196,000), and health (14% or 161,000) (see Technical notes for field definitions). The top 3 main fields for:
- males were engineering and related technologies, management and commerce, and society and culture
- females were society and culture, health, and management and commerce (Figure 2).
Comparing the main fields studied by males and females, a higher proportion of:
- males than females studied engineering and related technologies, architecture and building, and information technology
- females than males studied society and culture, health, and education (Figure 2).
Figure 2: Main field of current study for young people aged 15–24 studying a non-school qualification, by sex, 2020
Notes
- Calculated proportions include categories ‘Mixed Field Programmes’ and Field Information Inadequate’ but data are not shown.
- The following variables have relative standard errors between 25% and 50% and should be used with caution: Males Agriculture, Environmental and Related Studies; Females Information technology.
- See Technical notes for field definitions.
- For information on the significance of comparisons and error bar overlap see general technical notes in Methods.
Chart: AIHW.
Source: ABS 2020b.
The fields of study in Figure 2 can be grouped to describe those studying STEM fields (that is, natural and physical sciences; information technology; engineering and related technologies; and agriculture, environmental and related studies) and STEM-related fields (architecture and building, and health) (ABS 2020a).
- Of young people aged 15–24 studying a non-school qualification, around 2 in 5 (44%) were studying STEM or STEM-related fields.
- The proportion of males studying STEM fields was nearly 3 times as high as the proportion of females (36% compared with 13%).
- The proportion of males and females studying STEM-related fields was similar (19% compared with 22%) (see Technical notes (ABS 2020b).
How has studying for qualifications changed over time?
Based on data from the ABS SEW, from 2011 to 2015, the proportion of young people aged 15–24 studying non-school qualifications increased (from 33% to 36%) and has since remained between 36–37%:
- for males, the proportion in 2020 was similar to that in 2011 (33%)
- for females, the proportion increased from 2011 to 2015 (34% to 38%) and has since remained between 38–39% (ABS 2020b).
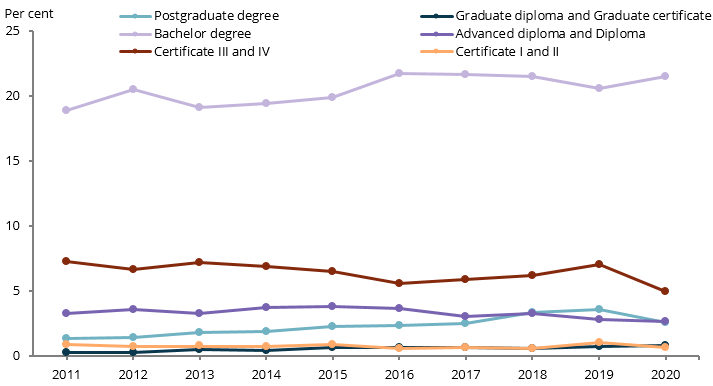
The proportion of young people aged 15–24 studying different levels of non‑school qualifications has varied over the last 10 years. The proportion studying:
- a bachelor degree increased from 2011 to 2016 (from 19% to 22%) and has since remained between 21–22%
- a Certificate III or IV has varied over time (between 5.0–7.3%), with a relatively large decrease from 2019 to 2020 (from 7.0% to 5.0%)
- a postgraduate degree has increased, more than doubling between 2011 and 2019 (1.4% to 3.6%). However, the proportion decreased in 2020 (to 2.6%)
- a Certificate I or II has varied in a narrow range between 0.6% and 1.0%, with 0.7% in 2020
- a Graduate diploma/Graduate certificate has increased by 3 times from 2011 to 2020 (from 0.3% to 0.9%) (Figure 3).
Figure 3: Level of qualification of current study for young people aged 15–24, 2011 to 2020
Notes
- Calculated proportions include categories ‘level not determined’ and ‘Certificate not fully defined’.
- The value for 2012 Graduate diploma and Graduate certificate has a relative standard error between 25% and 50% and should be used with caution.
Chart: AIHW.
Source: ABS 2020b.
How has the main field of study for young people changed over time?
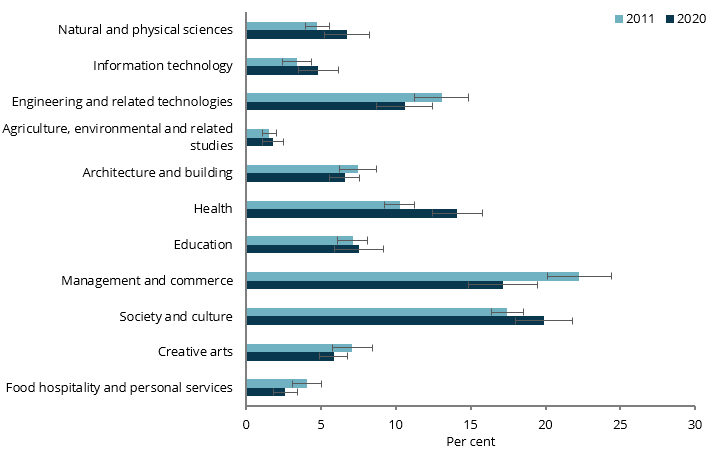
Based on data from the ABS SEW, between 2011 and 2020, among young people aged 15–24 there was:
- an increase in the proportion who study society and culture, health, and natural and physical sciences
- a decrease in the proportion who study management and commerce, and food hospitality and personal services (Figure 4).
Figure 4: Main field of study for young people aged 15–24 studying a non-school qualification, 2011 and 2020
Notes
- Calculated proportions include categories ‘Mixed Field Programmes’ and Field Information Inadequate’ but data are not shown.
- See Technical notes for field definitions.
- For information on the significance of comparisons and error bar overlap see general technical notes in Methods.
Chart: AIHW.
Source: ABS 2020b.
Between 2019 and 2020, the proportion of young people aged 15–24 studying society and culture as their main field increased from 16% to 20% (ABS 2020b). This increase was predominantly due to an increase in males studying society and culture as their main field (9.9% to 14%). The proportion studying other main fields remained relatively unchanged.
From 2011 to 2020, among males aged 15–24, there was:
- an increase in the proportion who study health (5.7% to 8.4%) and society and culture (11% to 14%)
- a decrease in the proportion who study architecture and building (14% to 11%) (ABS 2020b).
From 2011 to 2020, among females aged 15–24, there was:
- a small increase in the proportion who study natural and physical sciences (4.6% to 7.8%) and architecture and building (1.0% to 2.8%), while health increased from 15% to 20%
- a decrease in the proportion who study management and commerce (24% to 17%) (ABS 2020b).
Over the last 10 years (2011 to 2020), the proportion of young people aged 15–24 studying STEM or STEM-related fields has increased (from 41% to 44%).
- This increase is predominantly due to an increase in females (from 26% to 35%)
- The proportion of males remained steady (from 55% to 54%) (see Technical notes) (ABS 2020b).
How many young people are studying apprenticeships and traineeships?
Based on data from the NCVER National Apprentice and Trainee Collection, as at 30 June 2020, 5.7% (or 181,300) of young people aged 15–24 were undertaking apprenticeships and traineeships, with the proportion of:
- males being 3 times as high as that for females (8.5% or 140,100 and 2.6% or 41,200, respectively)
- young people aged 15–19 and 20–24 being similar (5.9% or 88,100 and 5.4% or 93,200, respectively) (VOCSTATS 2021).
Of apprentices and trainees aged 15–24:
- 3.1% (or 5,700) had disability, with a similar proportion of 15–19 year olds and 20–24 year olds (3.8% or 3,400 and 2.5% or 2,300, respectively)
- more studied a trade (74% or 134,000), with 26% (or 47,300) studying a non-trade (see Technical notes)
- more 15–19 year olds studied a non-trade than 20–24 year olds (33% or 28,700 compared with 20% or 18,600) (VOCSTATS 2021).
In 2019, a greater proportion of young people living in Remote areas (12% or 3,600) undertook apprenticeships and traineeships than those living in other remoteness areas (Outer regional areas (9.1% or 21,300), Inner regional areas (8.9% or 47,000), Very remote areas (6.8% or 1,600) and Major cities (4.7% or 114,000)).
At the time of this report’s release, the estimated resident population of young people for 2020 by Remoteness Areas is yet to be released.
How has studying apprenticeships and traineeships changed over time?
From June 1995 to June 2020, the proportion of young people aged 15–24 undertaking apprenticeships and traineeships increased from 4.8% to 5.7%.
- The highest proportion of young people undertaking apprenticeships and traineeships occurred in 2008 (8.8%). This coincided with major reforms initiated by the former Council of Australian Governments to increase participation in VET.
- The decrease in the proportion of young people undertaking apprenticeships and traineeships from 2012 to 2013 coincided with the removal of incentive payments, including those for qualifications not on the National Skills Needs List (Figure 5) (Atkinson & Stanwick 2016).
Figure 5: Trend in the proportion of young people aged 15–24 undertaking apprenticeships and traineeships, by sex, June 1995 to June 2020
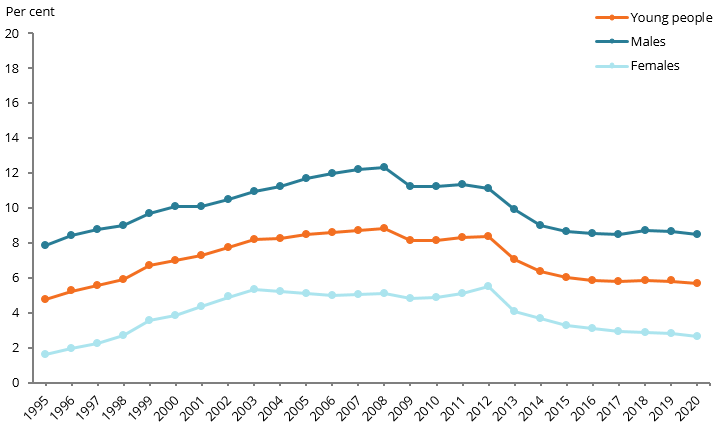
Chart: AIHW.
Sources: NCVER 2018; VOCSTATS 2021.
Between June 2019 and June 2020, the proportion of young people undertaking apprenticeships and traineeships remained relatively similar. However, there was a decrease for:
- females (from 2.8% to 2.6% of all females aged 15–24)
- young people studying a non-trade (from 28% to 26% of all apprentices and trainees) (VOCSTATS 2021).
During the COVID-19 pandemic, a number of new national initiatives were provided to support organisations both to employ new apprentices and trainees and to continue to employ existing apprentices and trainees (see Where do I find more information?) (Ferguson et al. 2021). At the time of this report, it is too early to see the effects of these initiatives on the number of young people undertaking and completing apprenticeship and traineeships.
Student experience
Based on findings from the 2019 Student Experience Survey, of higher education students aged under 25, the quality of the entire educational experience was rated positively by:
- 79% of undergraduate students (79% of those at university and non‑university higher education institutions [NUHEI])
- 75% of postgraduate coursework students (75% of those at university and 80% of those at NUHEI) (SRC 2020).
From 2013 to 2019, the proportion of undergraduate students aged under 25 who rated the quality of their entire educational experience positively remained similar (varying between 79% and 81%). The proportion for postgraduate coursework students aged under 25 has been measured only since 2017 and has been consistently 75% (SRC 2020).
The proportion of higher education students aged under 25 who considered early departure from their study was:
- 19% of all undergraduate students (19% of those at university and 22% of those at NUHEI)
- 15% of postgraduate coursework students (15% of those at university and 14% of those at NUHEI ) (SRC 2020).
Of undergraduate students aged under 25 who considered early departure, the most common reasons given were:
- health or stress (46%)
- study/life balance (30%)
- need a break (27%)
- need to do paid work (26%)
- unspecified personal reasons (26%).
The most common reasons for considering early departure among postgraduate coursework students aged under 25 were:
- health or stress (37%)
- expectations not met (26%)
- academic support (23%)
- study/life balance (23%)
- and career prospects (21%) (SRC 2020).
The COVID-19 pandemic has seen major changes to the delivery of university and non-university higher education courses, with dramatic shifts away from face-to-face to online formats (Go8 2020). The pandemic has also likely changed the profile of students, with fewer international students able to travel to Australia due to travel restrictions (Go8 2020; DESE 2021). It is too soon to detect the impact of these changes on student experience.
Where do I find more information?
For more information on Indigenous young people and educational participation, attainment and post‑school qualifications, see Section 2.05, Education outcomes for young people in Aboriginal and Torres Strait Islander Health Performance Framework (HPF) report 2020 and Section 3.1, Education in Aboriginal and Torres Strait Islander adolescent and youth health and wellbeing 2018.
For more information on:
- national agreement indicators and targets related to qualifications, see the Skills Performance reporting dashboard and the Education performance reporting dashboard
- national initiatives and funding to support Australian apprenticeships and traineeships, see the Department of Education, Skills and Employment website Supporting Apprentices and Trainees and Boosting Apprenticeship Commencements.