Australia's youth:
Nutrition
Web article
Last updated:
Topic: Children & youth
Part of Australia's youth
Citation
AIHW (Australian Institute of Health and Welfare) (2021) Nutrition, AIHW, Australian Government, accessed 17 July 2026.
Key findings
In 2017–18:
- 11 in 20 (56%) 15–18 year olds and 9 in 20 (45%) 19–24 year olds met the guidelines for fruit consumption
- the proportion of young people who met the national vegetable guidelines for their age and sex was:
- 1 in 50 (2.0%*) for males aged 15–18
- 1 in 33 (3.0%*) for males aged 19–24
- 1 in 14 (7.2%) for females aged 15–18
- 1 in 17 (5.8%) for females aged 19–24
- Almost 7 in 10 (69%) young people aged 15–24 usually consumed sugar‑sweetened drinks and/or diet drinks at least once a week.
Managing good nutrition at all stages of life is essential for healthy growth and development. Like childhood, adolescence is a stage where good habits can be formed, and then carried into adulthood (Due et al. 2011).
A balanced and varied diet helps to:
- promote health and wellbeing
- meet nutrient requirements
- protect against the development of chronic diseases (such as diabetes, stroke, cardiovascular disease and cancer) and premature death (WHO 2018).
The quantity and quality of food consumed are important, as insufficient or excessive amounts of particular foods and nutrients can contribute to poor health (AIFS 2011). The Australian Dietary Guidelines (ADG) recommend adolescents and young adults eat a wide variety of nutritious foods from the 5 food groups every day, namely:
- plenty of vegetables (including different types and colours) and legumes/beans
- fruit
- grain (cereal) foods, mostly wholegrain and/or high cereal fibre varieties, such as bread, cereals, rice pasta, noodles, polenta, couscous, oats, quinoa and barley
- lean meats and poultry, fish, eggs, tofu, nuts and seeds, legumes/beans
- milk, yoghurt, cheese and/or their alternatives, mostly reduced fat.
Iron rich foods are particularly important for young women as menstrual loss greatly increases their requirement for iron compared with young men (NHMRC 2013). As well, almost half (40%) of all girls aged 14–18 have an inadequate iron intake (AIHW 2018).
The ADG also recommend limiting the intake of foods and drinks containing added sugars, such as confectionary, sugar-sweetened soft drinks and cordials, fruit drinks, vitamin waters, energy and sports drinks (NHMRC 2013).
Drinks high in added sugars can provide excess kilojoules with little nutritional value and can increase the risk of excessive weight gain (NHMRC 2013). They are also associated with increased risk of dental decay. The ADG advises that drinking plenty of water instead promotes good health, including oral health (NHMRC 2013).
Box 1: How many serves of fruit and vegetables are recommended?
The amount of food young people need for a diverse, balanced and healthy diet differs by age, sex and level of activity. The Australian Dietary Guidelines (ADG) recommend how many serves of fruit and vegetables young people need, namely:
- a minimum of 2 serves of fruit per day for males and females aged 12–24.
The minimum recommended number of serves of vegetables and legumes per day is:
- 5½ for males aged 12–18 and 6 for males aged 19–24
- 5 for females aged 12–24 (NHMRC 2013).
Data on usual daily serves in this section were based on the number of whole serves reported through the ABS National Health Survey 2014–15 and 2017–18, with half serves rounded up.
The type of diet consumed and the likelihood of receiving nutrients required to benefit health can be influenced by a number of economic, cultural, social and environmental factors, as well as by individual preferences.
- Socioeconomic factors (such as education, occupation and income) are important determinants of food choices and eating behaviours, while culture and beliefs can also play a role (AIHW 2012). Possible barriers to meeting dietary recommendations may include availability and affordability of food, poor communication of advice, low levels of food literacy and high levels of food insecurity (including the inability to access adequate amounts of nutritious, culturally acceptable foods).
- Conflicting messages (such as advertising and promotion of energy-dense but nutrient-poor foods and drinks) and dietary preferences may also be contributing factors (NHMRC 2013).
- The greater reliance on convenience foods in recent decades may be due to reduced available time to prepare home-cooked meals (AIHW 2021).
Box 2: Data sources on nutrition
Data on young people’s consumption of fruit and vegetables come from the ABS National Health Surveys (NHSs) 2014–15 and 2017–18.
The NHS collects a range of information about the health of Australians in all states and territories across urban, rural and remote areas (excluding very remote areas). The 2017–18 NHS surveyed around 21,000 people in over 16,000 private dwellings.
Within each selected dwelling, 1 adult (18 years and over) and 1 child (aged 0–17) were randomly selected for inclusion in the survey. An adult, nominated by the household, was interviewed about 1 child in the household. Some children aged 15–17 may have been personally interviewed with parental consent.
In the NHS, people are reported to have met the NHMRC 2013 guidelines for fruit and vegetable intake if it was reported that they usually consumed each day the recommended minimum number of serves for their age and sex (see Box 1).
Data on young people’s consumption of sugar-sweetened and diet drinks come from the 2017–18 NHS (see Technical notes for definitions).
How much fruit and vegetables are young people eating?
In 2017–18, based on self-reported data among young people aged 15–24:
- 1 in 3 (33% or 1.0 million) consumed 1 serve of fruit a day, while 12% (or 366,400) ate less than 1 serve and 6.0% (or 185,800) did not eat any fruit (Figure 1)
- there was generally little difference between age groups (15–18 year olds and 19–24 year olds) or between sexes in relation to the number of serves of fruit eaten. However, the proportion of 19–24-year-old males who ate less than 1 serve of fruit was a little higher than that for 15–18-year-old males (13% or 123,500, and 9.7% or 59,400, respectively)
- fewer than 1 in 3 (30% or 925,900) consumed 1 serve of vegetables a day, while 7.6% (or 233,500) ate less than 1 serve and 1.2% (or 36,200) ate no vegetables at all (Figure 1)
- there was little difference between the 15–18 and 19–24 age groups in relation to those who ate:
- 1 serve of vegetables (28% or 332,500 for those aged 15–18 and 31% or 588,700 for those aged 19–24)
- less than 1 serve of vegetables (7.8% or 91,300 for those aged 15–18 and 7.6% or 144,800 for those aged 19–24)
- no vegetables at all (1.4%* or 16,100* for those aged 15–18 and 1.1%* or 20,200* for those aged 19–24) see Technical notes).
Figure 1: Proportion of young people aged 15–24 consuming fruit and vegetables, by daily number of serves, 2017–18
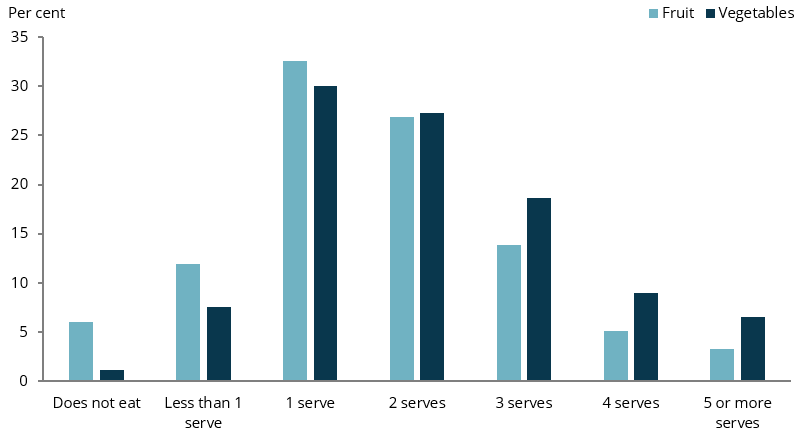
Chart: AIHW.
Source: ABS 2019.
How many young people meet the fruit and vegetable guidelines?
The number of serves recommended by the ADG for fruit are the same for both 15–18 year olds and 19–24 year olds, and for both sexes (see Box 1).
According to the self-reported data from the NHS, in 2017–18:
- 1 in 2 (50% or 1.5 million) young people aged 15–24 met the fruit guidelines (Figure 2)
- 11 in 20 (56% or 658,300) 15–18 year olds met the fruit guidelines compared with 9 in 20 (45% or 868,700) 19–24 year olds
- the proportion of males and females meeting the fruit guidelines was similar across age groups (Figure 2).
Figure 2: Proportion of young people aged 15–24 meeting the fruit guidelines, by age group and sex, 2017–18
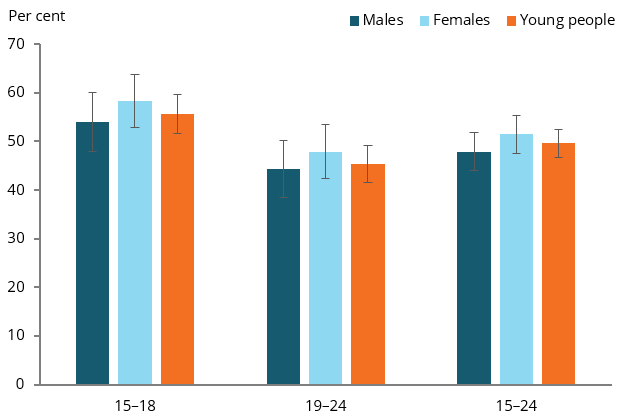
Chart: AIHW.
Source: ABS 2019.
The number of serves recommended by the ADG for vegetables and legumes (hereafter referred to as the vegetable guidelines) differs between sexes, and between males aged 15–18 and 19–24 (see Box 1).
According to the self-reported data from the NHS, in 2017–18:
- 1 in 50 (2.0%* or 12,500* (see Technical notes) males aged 15–18 met the vegetable guidelines
- around 1 in 33 (3.0%* or 28,500* (see Technical notes) males aged 19–24 met the vegetable guidelines
- 1 in 15 (6.7% or 100,300) females aged 15–24 met the vegetable guidelines, with similar proportions for both age groups (7.2% for those aged 15–18 and 5.8% for those aged 19–24) (Figure 3).
Figure 3: Proportion of young people aged 15–24 meeting the vegetable guidelines, by age group and sex, 2017–18
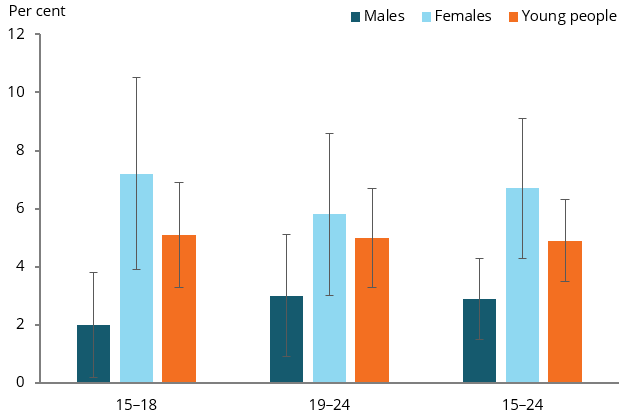
Chart: AIHW.
Source: ABS 2019.
Fewer than 1 in 20 (4.7%) females aged 15–24 met both fruit and vegetable guidelines each day. Small numbers for males means that data cannot be reported.
Have eating patterns changed over time?
A comparison of results for 2014–15 and 2017–18 showed that:
- overall, the proportion of young people aged 15–24 who met the fruit guidelines remained the same (46% and 50%, respectively). However, the proportion of all males who met the guidelines increased from 41% to 48%, largely due to an increase among males aged 15–18 (from 42% to 54%)
- the proportion of young people who met the vegetable guidelines was similar across both time periods for both age groups and genders (ABS 2015;2019).
Is it the same for everyone?
In 2017–18, the proportion of young people with disability who met the fruit guidelines was lower (41%) than that for those with no disability (52%) (Figure 4).
Figure 4: Proportion of young people aged 15–24 meeting the recommended guidelines for fruit, by population group, 2017–18
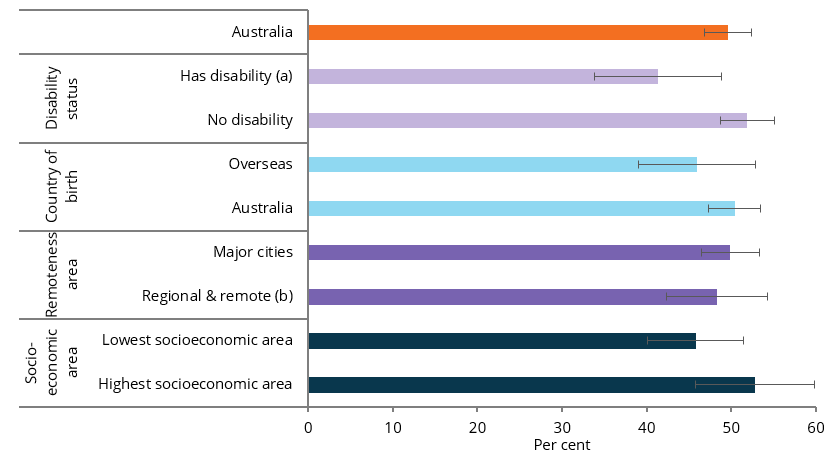
(a) A disability or restrictive long-term health condition exists if a limitation, restriction, impairment, disease or disorder has lasted, or is expected to last, for 6 months or more, which restricts everyday activities.
(b) Regional and remote includes Inner regional, Outer regional and Remote areas.
(c) Socioeconomic areas are based on quintiles of the Socio-Economic Indexes for Areas (SEIFA) 2016 Index of Relative Socio-Economic Disadvantage
Chart: AIHW.
Source: ABS 2019.
Consumption of sugar-sweetened and diet drinks
Based on self-reported data from the 2017–18 NHS, among young people aged 15–24, at least once a week:
- over 3 in 5 (61% or 1.9 million) consumed sugar-sweetened drinks
- fewer than 1 in 5 (17% or 527,900) consumed diet drinks
- almost 7 in 10 (69% or 2.1 million) consumed sugar-sweetened drinks and/or diet drinks
- 1 in 3 (31% or 3.1 million) did not consume either sugar-sweetened or diet drinks.
A higher proportion of males than females aged 15–24 consumed sugar‑sweetened drinks once a week (68% and 53%). This was true for both 15–18 year olds (71% for males and 54% for females) and 19–24 year olds (66% for males and 53% for females) (Figure 5).
Figure 5: Proportion of young people aged 15–24 consuming sugar-sweetened drinks at least once a week, by sex and age group, 2017–18
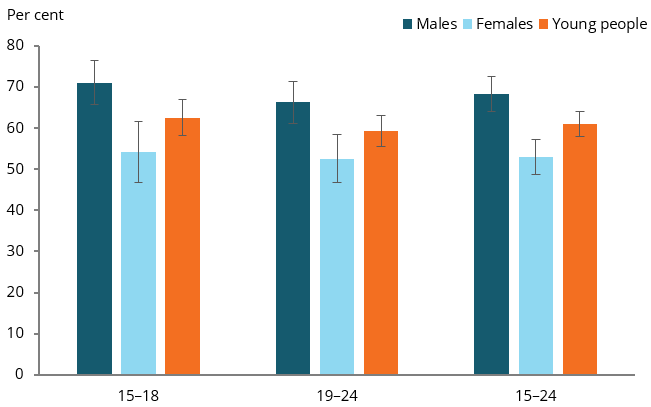
Chart: AIHW.
Source: ABS 2019.
The proportion of young people aged 15–24 who consumed sugar-sweetened or diet drinks on 1–3 days a week was:
- almost 2 in 5 (38%) for sugar-sweetened drinks
- over 1 in 10 (11%) for diet drinks.
The proportion of young people aged 15–24 who consumed sugar-sweetened or diet drinks every day was:
- 13% for sugar-sweetened drinks
- 3.3% for diet drinks.
A higher proportion of males than females aged 15–24 consumed sugar‑sweetened drinks on a daily basis (17% and 9.4%). This was true for both 15–18 year olds (16% and 8.7%, respectively) and 19–24 year olds (17% and 9.4%, respectively).
Is it the same for everyone?
In 2017–18, among young people aged 15–24, the proportion of those who consumed sugar-sweetened drinks at least once a week was higher among those:
- living in the lowest socioeconomic areas (69%) compared with those living in the highest socioeconomic areas (53%) (Figure 6).
Figure 6: Proportion of young people aged 15–24 consuming sugar-sweetened drinks at least once a week, by population group, 2017–18
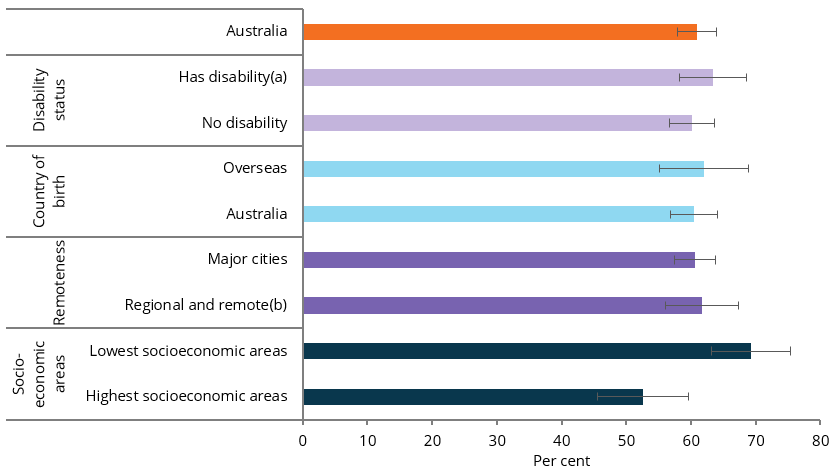
(a) A disability or restrictive long-term health condition exists if a limitation, restriction, impairment, disease or disorder has lasted, or is expected to last, for 6 months or more, which restricts everyday activities.
(b) Regional & remote includes Inner regional, Outer regional and Remote areas.
Chart: AIHW.
Source: ABS 2019.
Box 3: Discretionary foods
Discretionary foods are foods that are:
- high in energy and saturated fat, sodium, added sugars and/or alcohol
- often low in beneficial nutrients
- have been associated with increased risk of obesity and/or chronic diseases.
Examples include biscuits, confectionary, chocolate, cakes, cream, salty or fatty snack foods (such as potato chips), and sugar-sweetened soft drinks (AIHW 2018).
In 2011–12, a substantial amount of total energy intake was through discretionary foods.
- For young people aged 14–18, 41% of their energy intake was from discretionary foods (the same for males and females). The most consumed discretionary foods were soft drinks (8.8%), cakes and muffins (8.4%), fried potato products (8.4%), pastries (7.4%), snack foods (for example, potato and corn chips) (5.7%) and chocolate and chocolate-based confectionary (5.4%) (AIHW 2018).
- For adults aged 19–30, 36% of total energy intake was from discretionary foods (36% for males and 35% for females). For this age group, the main contributors were alcoholic drinks (13%), soft drinks (7.8%), cakes and muffins (7.2%), fried potato products (7.0%) and pastries (6.7%) (AIHW 2018).
The ABS National Nutrition and Physical Activity Survey to be conducted in 2023 will include updated data on dietary intake and physical activity.
Where do I find more information?
For information on topics related to the nutrition of Australia’s young people, see:
For information on Indigenous young people and nutrition, see:
- Section 4.4, Diet of Aboriginal and Torres Strait Islander adolescent and youth health and wellbeing
- Section 2.19, Dietary behaviour of Aboriginal and Torres Strait Islander Health Performance Framework (HPF) report 2020.
For information on nutrition in childhood, see:
For information on nutrition across the whole population, see: