Young people presenting alone
On this page
Key findings: Young people presenting alone, 2022–23
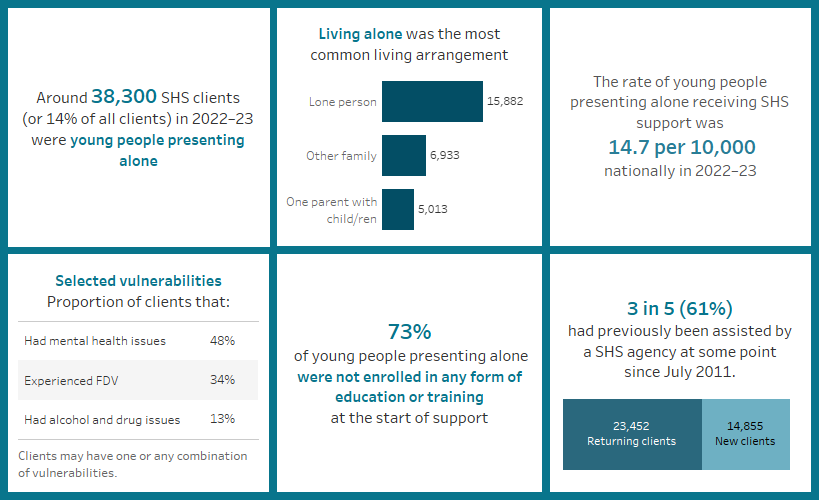
Youth homelessness often stems from difficult home lives and challenging family relationships (Gaetz et al. 2016, Kalemba et al. 2022). Family relationships and home lives burdened by regular instances of neglect, conflict, and abuse (including physical, sexual, substance and/or emotional) can make a young person’s living conditions emotionally unbearable and/or physically unbearable. While some young people may endure through these difficult home lives, many also leave, even without another home to move to (Kalemba et al. 2022). Other challenges, such as problematic drug and/or alcohol use, mental health issues and shortages to affordable housing or poverty can equally contribute – directly or indirectly – to young people’s experience of homelessness (Flatau et al. 2022, Hodgson et al. 2013).
Around 28,200 young people aged 12–24 years were estimated to have been experiencing homelessness on Census night in 2021, making up nearly a quarter (23%) of the total homeless population (ABS 2023). However, Census estimates may under-represent the extent of youth homelessness, as some couch surfers may report their usual address as the household in which the young person is staying in on Census night (ABS 2023).
Young people aged 18–24 years who sought assistance from SHS at some point between July 2018 to June 2020 were more likely to have experienced homelessness than SHS clients who were aged 25 years and older (63% compared with 51%), and more likely to have been a couch surfer (41% compared with 24%) (AIHW 2023a). They were also more likely to need SHS assistance because of family-related issues and lack of family and/or community support (AIHW 2023a). Furthermore, young SHS clients aged 15–24 made up over a quarter (27.5% or 7,400 clients) of clients experiencing persistent homelessness in 2019–20 (AIHW 2023b).
The Australian Government invests in youth homelessness services through the long standing Reconnect Program. Reconnect is a community-based early intervention and prevention program for young people aged 12–18 years (or 12–21 years in the case of newly arrived youth) who are homeless or at risk of homelessness, and their families. Reconnect is delivered by 70 organisations under 101 activities, nationally, and helps around 7,000 young people each year (DSS 2023).
In recognition of the severe impact that homelessness has on the lives of young Australians, children and young people are a national priority homelessness cohort in the National Housing and Homelessness Agreement (CFFR 2018) (see Policy section for more information).
Client characteristics
Figure YOUNG.1: Key demographics, young people presenting alone, 2022–23
This interactive image describes the characteristics of around 38,000 young people presenting alone who received SHS support in 2022–23. Most clients were female, aged 18–24 years. Around a third were Indigenous. New South Wales had the greatest number of clients and the Northern Territory had the highest rate of clients per 10,000 population. The majority of clients had previously been assisted by a SHS agency since July 2011. Most were experiencing homelessness at the start of support and most were in major cities.
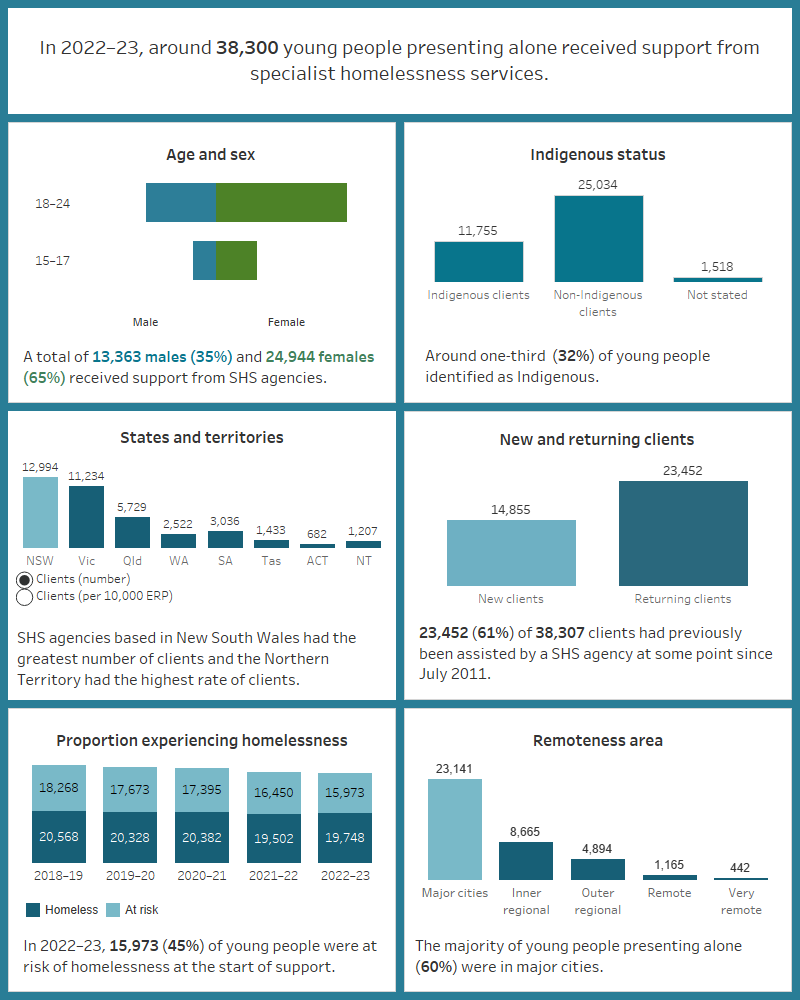
Young people presenting alone (38,300 clients) were the fourth largest SHS client group in 2022–23, making up around 14% of all SHS clients (Supplementary table CLIENTS.41).
Selected vulnerabilities
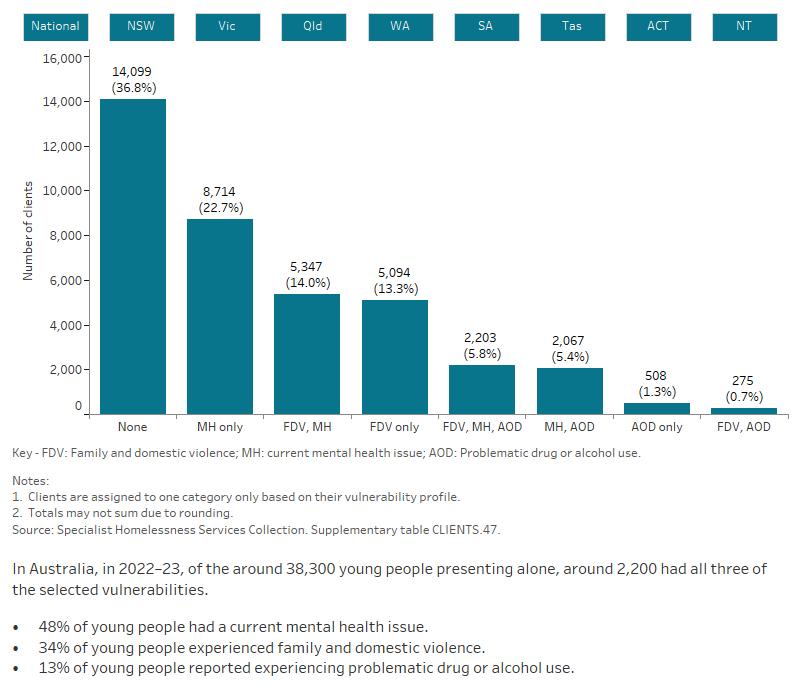
Young people presenting alone may face additional vulnerabilities that make them more susceptible to homelessness, such as family and domestic violence, mental health issues and problematic drug and/or alcohol use. Around a third of clients (37%) did not have any of these vulnerabilities, however, around half (48%) had a current mental health issue (Figure YOUNG.2).
Figure YOUNG.2: Young people presenting alone, by selected vulnerability characteristics, 2022–23
This interactive bar graph shows the number of clients also experiencing additional vulnerabilities, including having a current mental health issue, problematic drug and/or alcohol use, or experiencing family and domestic violence. The graph shows both the number of clients experiencing a single vulnerability only, as well as combinations of vulnerabilities, and presents data for each state and territory.
Service use patterns
The service use patterns of young people presenting alone to an SHS agency has generally been stable over time. Between 2017–18 and 2022–23 (Supplementary table CLIENTS.48):
- The average number of support periods per client has remained at 1.9 support periods.
- The median number of nights accommodated has increased from 45 nights in 2017–18 to 50 nights in 2022–23.
- The length of support (median number of days) has increased to 64 days in 2022–23, from 49 days in 2017–18.
Main reasons for seeking assistance
In 2022–23, the main reasons for seeking assistance among young people presenting alone were (Supplementary table YOUNG.5):
- housing crisis (19% or around 7,200 clients)
- family and domestic violence (15% or 5,500 clients)
- relationship/family breakdown (12% or 4,600 clients).
Young people experiencing homelessness at first presentation (compared with those at risk of homelessness) most commonly identified housing crisis (23%, compared with 16% of clients at risk) and inadequate or inappropriate dwelling conditions (15%, compared with 8.2% at risk) as the top 2 main reasons for seeking assistance (Supplementary table YOUNG.6). Family and domestic violence (16%, compared with 11% of homeless clients) was the most commonly reported main reason for seeking assistance among young people presenting alone who were at risk of homelessness (Supplementary table YOUNG.6).
Services needed and provided
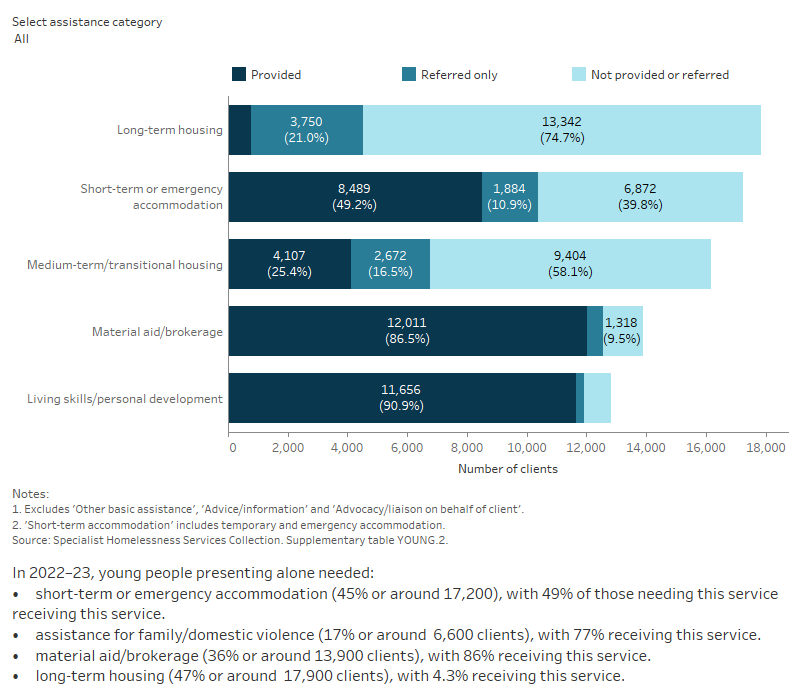
Similar to all SHS clients in 2022–23, the majority of young people presenting alone needed general services that were provided by SHS agencies including advice/information, advocacy/liaison on behalf of the client and other basic assistance.
Young people presenting alone were more likely than all SHS clients to request services including (Supplementary tables YOUNG.2, CLIENTS.24):
- living skills/personal development (33%, compared with 17%), with 91% receiving this service
- educational assistance (19%, compared with 8.2%), with 74% receiving this service
- employment assistance (19%, compared with 6.5%), with 70% receiving this service
- assistance to obtain/maintain government allowance (17%, compared with 8.3%), with 79% receiving this service
- mental health services (15%, compared with 8.3%), with 47% receiving this service
- training assistance (13%, compared with 4.1%), with 68% receiving this service.
Figure YOUNG.3: Young people presenting alone, by services needed and provided, 2022–23
This interactive stacked horizontal bar graph shows the services needed by young people presenting alone and their provision status. Long-term housing was the most needed and the least provided service. Material aid/brokerage was the most provided service.
Housing situation and outcomes
Outcomes presented here highlight the changes in clients’ housing situation at the start and end of support. That is, the place they were residing before and after they were supported by a SHS agency. The information presented is limited only to clients who have stopped receiving support during the financial year, and who were no longer receiving ongoing support from a SHS agency. In particular, information on client housing situations at the start of their first period of support during 2022–23 is compared with the end of their last period of support in 2022–23. As such, this information does not cover any changes to their housing situation during their support period.
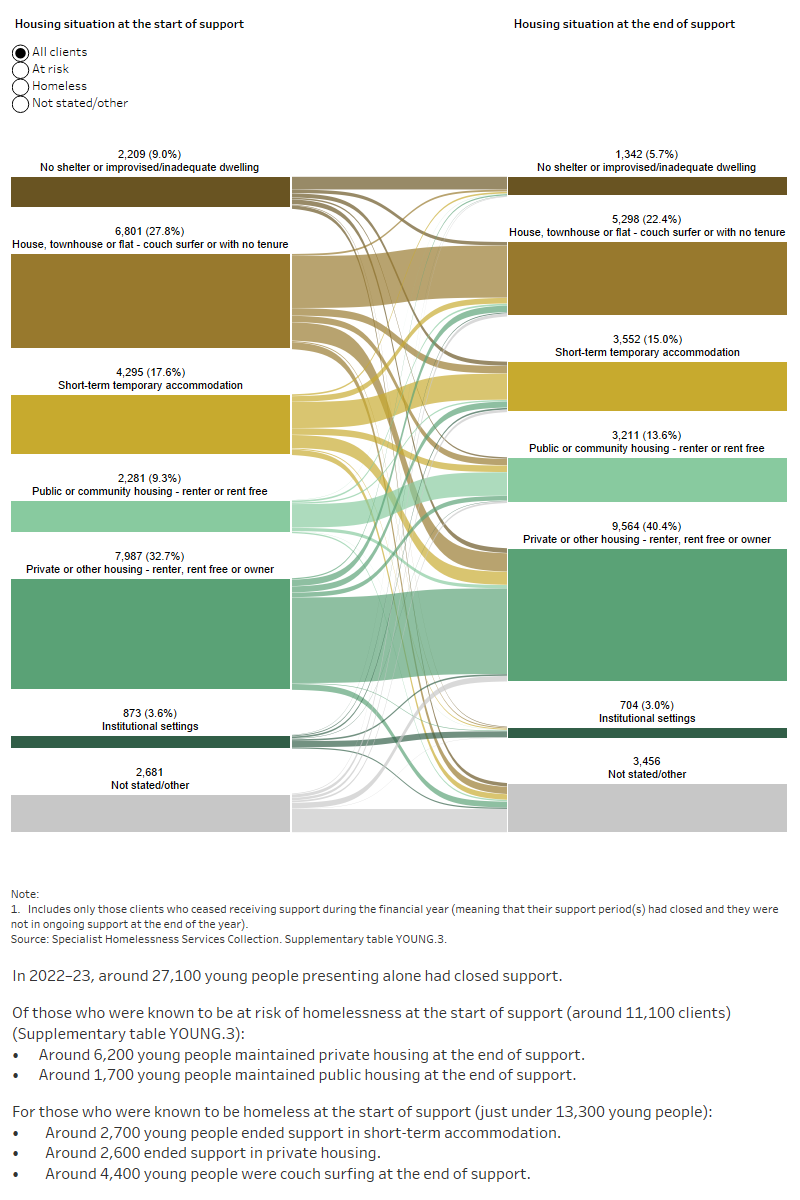
For young people presenting alone in 2022–23, around 13,300 clients (54%) were experiencing homelessness at the start of support; 6,800 (28%) were couch surfing. By the end of support, 57% of young people presenting alone were housed (Supplementary table YOUNG.3).
By the end of support, many young people presenting alone to a SHS agency had achieved or progressed towards a more positive housing solution. That is, the number and/or proportion of clients ending support in public or community housing (renter or rent-free) or private or other housing (renter or rent-free) had increased compared with the start of support (Supplementary table YOUNG.4):
- One-third (32% or 3,800 clients) of young people presenting alone who were experiencing homelessness at the start of support were housed.
- Over one-fifth were living in private rental accommodation (2,600 clients or 22%).
- For those at risk of homelessness, almost 9 in 10 (9,100 clients or 86%) were housed; mostly in private rental accommodation (6,500 clients or 62%).
Figure YOUNG.4: Housing situation for young people presenting alone with closed support, 2022–23
This interactive Sankey diagram shows the housing situation (including rough sleeping, couch surfing, short-term accommodation, public/community housing, private housing and institutional settings) of young people presenting alone with closed support periods at first presentation and at the end of support. The diagram shows clients’ housing situation journey from start to end of support. Most clients started and ended support in private housing or other housing.
ABS (Australian Bureau of Statistics) (2023a) Estimating Homelessness: Census, ABS website.
ABS (2023b) Estimating Homelessness: Census methodology, ABS website.
AIHW (Australian Institute of Health and Welfare) (2023a) Specialist homelessness services client pathways: Young clients aged 18 to 24 in 2018–20, AIHW website.
AIHW (2023b) Specialist homelessness services client pathways: Clients experiencing persistent homelessness in 2019–20, AIHW website.
Council on Federal Financial Relations (2018) National Housing and Homelessness Agreement, CFFR website, accessed 3 October 2019.
Department of Social Services (2023) Reconnect, DSS website, accessed 9 November 2023.
Flatau P, Lester L, Seivwright A, Teal R, Dobrovic J, Vallesi S, Hartley C and Callis Z (2022) Ending homelessness in Australia: An evidence and policy deep dive, Centre for Social Impact, doi:10.25916/ntba-f006.
Gaetz S, O’Grady B and Schwan S (2016) Without a Home: The National Youth Homelessness Survey, Homeless Hub, Toronto.
Hodgson KJ, Shelton KH, van den Bree MB and Los FJ (2013) ‘Psychopathology in young people experiencing homelessness: A systematic review’, American journal of public health, 103(6):e24-e37, doi: 10.2105/AJPH.2013.301318.
Kalemba J, Kos A, Greenland N, Plummer J, Brennan N, Freeburn T, Nguyen T. and Christie R (2022) Without a home: First-time youth homelessness in the COVID-19 period, Mission Australia.
MacKenzie D, Hand T, Zufferey C, McNells S, Spinney A and Tedmanson D (2020) ‘Redesign of a homelessness service system for young people’, AHURI Final Report 327, Australian Housing and Urban Research Institute Limited, doi: 10.18408/ahuri-5119101.


