Medicare mental health services
Over 2.7 million patients

accessed almost 13.2 million Medicare-subsidised mental health-specific services.
49% of services were provided by psychologists

27% by GPs, 20% by psychiatrists and 5% by other allied health providers.
13% of females accessed services

compared to 8% of males.
Medicare-subsidised mental health‑specific services are delivered by psychiatrists, general practitioners (GPs), psychologists and other allied health professionals. These services are delivered in a range of settings–for example, hospitals, consulting rooms, home visits, and telehealth–as defined in the Medicare Benefits Schedule (MBS). Information is provided on both patient and service provider characteristics and is limited to Medicare-subsidised services only. These data relate only to services claimed under specified mental health care MBS item numbers. Therefore, the reported number of patients is unlikely to represent all patients who receive mental health care as it is unclear how many people receive GP mental health-related care that is billed as a consultation against, for example, a general MBS item number for a short consultation. For further information on the MBS data, refer to the data source section.
Spotlight data
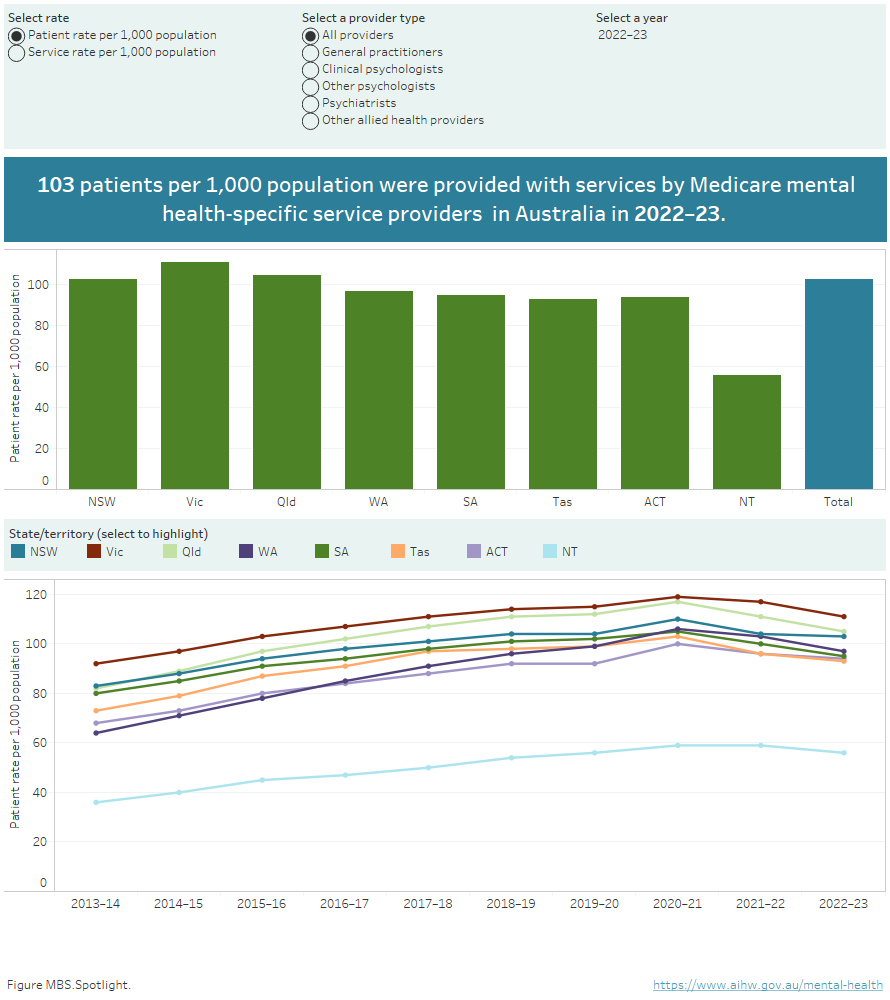
Spotlight figure containing: a) Bar graph showing the rate (per 1,000 population) of patients or services by state and provider types; b) Line graph showing the rate (per 1,000 population) of patients or services by state and provider type from 2013–14 to 2022–23.

Source: Medicare mental health services 2022–23 data tables.
During 2022–23, the Medicare-subsidised mental health-specific service rate was 501 services per 1,000 population in Australia with the highest rate provided by psychologists (Clinical psychologists and Other psychologists; 244) followed by General practitioners (133).
Who received Medicare mental health services?
In 2022–23, about 2.7 million Australians (10% of the population) received Medicare-subsidised mental health-specific services with Victoria and Queensland having the highest rates of patients (per 1,000 population) receiving services (111 and 105 respectively) and the Northern Territory the lowest (56). Not all services provided through Indigenous health services are included in the MBS.
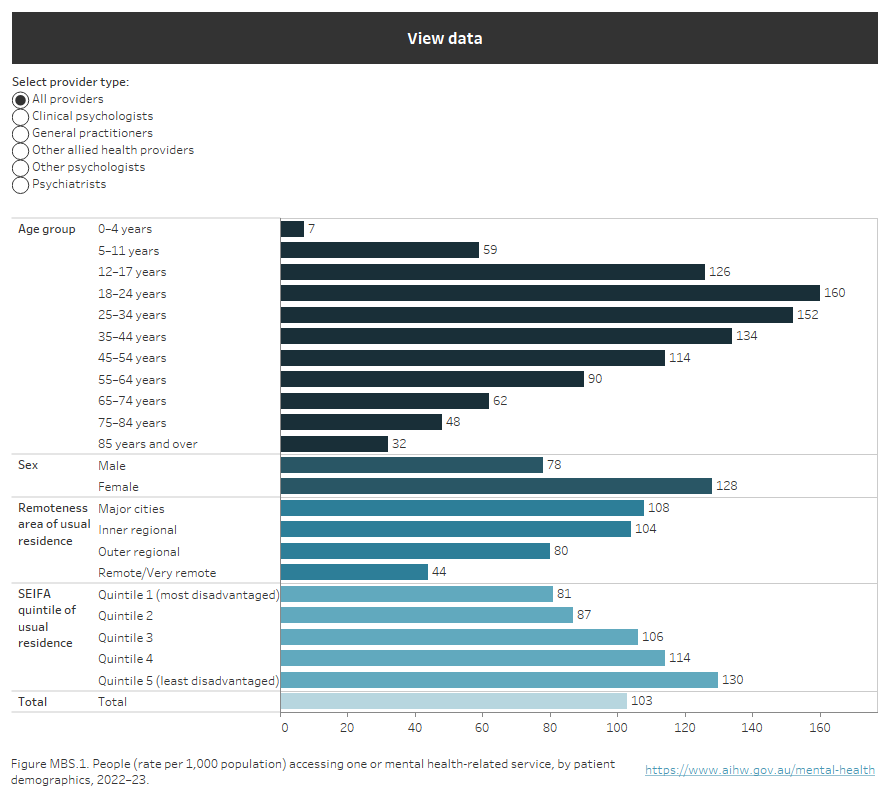
People aged 18–24 years were most likely to receive services (160 patients per 1,000 population) and young females aged 18–24 had more than double the rate (217) compared with young males of the same age group (107). The rate of patients receiving services decreased with increasing remoteness. In Major cities the rate was 108 patients per 1,000 population, decreasing to 44 in Very remote areas. The rate also decreased with increasing social disadvantage. People in the SEIFA Quintile 5 (least disadvantaged) were the most likely to receive services with a rate of 130 patients per 1,000 population, decreasing to 81 for people in living in SEIFA Quintile 1 (most disadvantaged) (Figure MBS.1).
Figure MBS.1: Rate (per 1,000 population) of people receiving Medicare mental health services, by demographic characteristics, 2022–23
Horizontal bar chart showing the rate of patients (per 1,000 population) who received Medicare-subsidised mental health-specific services during 2022–23, by key demographics.

Source: Medicare mental health services 2022–23 data tables.
In 2022–23, 8% of people received services from a General practitioner; 5% received services from Clinical psychologists and Other psychologists; 2% services from a Psychiatrist; and <1% received services from Other allied health professionals. Note that an individual may receive services from more than one provider type during the reporting period.
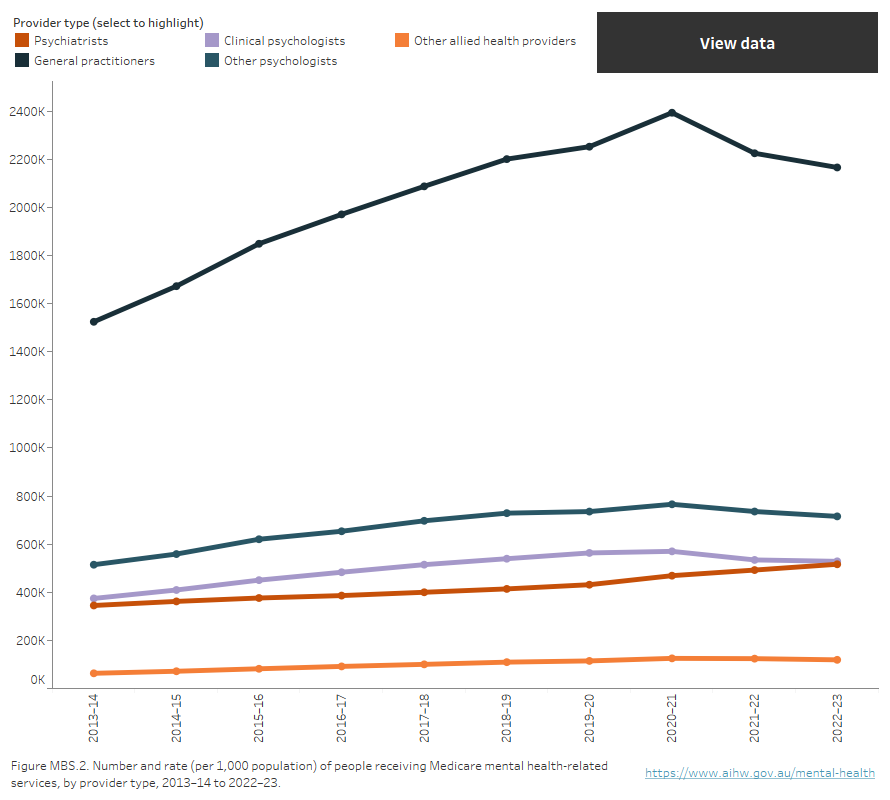
Overall, the trend in the number of people receiving services increased over the 9 year period to 2022–23, from about 1.9 million in 2013–14 (or 8% of the population) to just over 2.7 million in 2022–23 (10% of the population). There was a larger increase in the number of people accessing services through General practitioners compared with other providers during 2020–21, during the emergency phase of the COVID-19 pandemic (Figure MBS.2).
Refer to mental health services activity monitoring for more information.
Figure MBS.2: People receiving Medicare mental health services, by provider type, 2013–14 to 2022–23
Line chart showing the number of people who received Medicare mental health services by the type of provider from which they received services, from 2013–14 to 2022–23. General practitioners provided services to the most people, increasing from 1.5 million patients in 2013–14, peaking at 2.4 million in 2020–21 before declining to 2.2 million in 2022–23.

Source: Medicare mental health services 2022–23 data tables.
Mental health services
How many Medicare mental health services were provided?
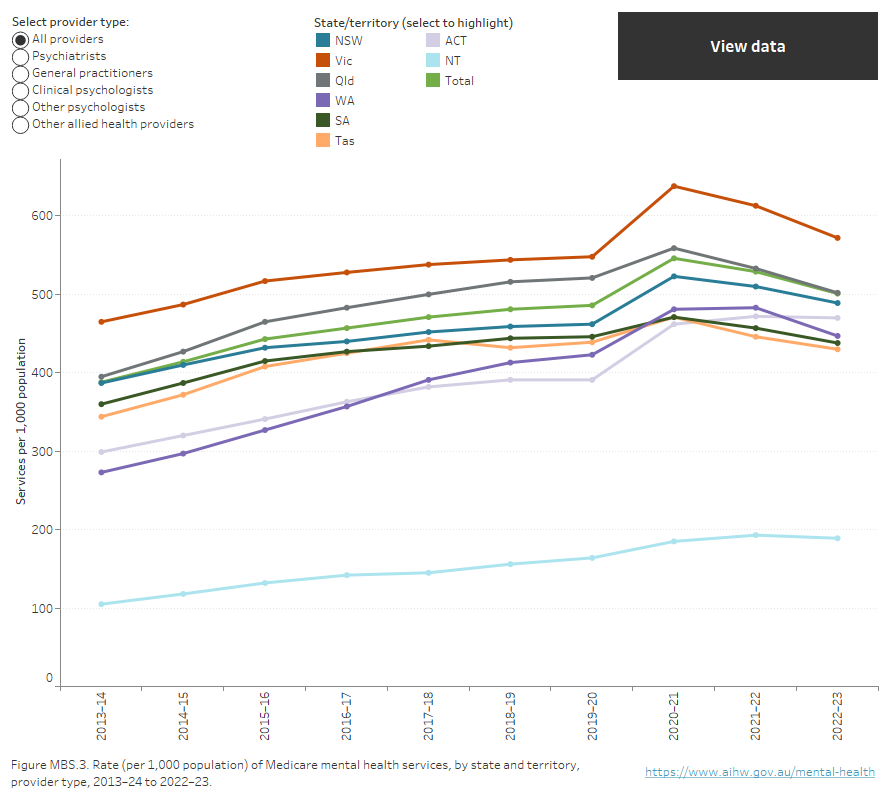
There were about 13.2 million Medicare-subsidised mental health-specific services provided to 2.7 million Australians in 2022–23. The national rate was 501 services per 1,000 population and Victoria (572) had the highest rate across the jurisdictions (Figure MBS.3).
Figure MBS.3: Rate (per 1,000 population) of Medicare mental health services, by state and territory, provider type, 2013–14 to 2022–23
Line chart showing the rate per 1,000 population of services provided in each state and territory by provider type, from 2013–14 to 2022–23

Source: Medicare-subsidised mental health-related services 2022–23 data tables.
In 2022–23, the 18–24 age group had the highest rate of service use (801 services per 1,000 population), and females aged 18–24 (1,165 services per 1,000 population) had a higher rate of service use than young males aged 18–24(461). People living in Major cities had the highest rate of service use (547 services per 1,000 population) with rates decreasing with increasing remoteness. Similarly, people in the least disadvantaged SEIFA quantile had the highest rate of service use (754 services per 1,000 population) with rates decreasing with increasing disadvantage (Figure MBS.1).
The total number of Medicare-subsidised mental health-specific services increased from about 9.0 million in 2013–14 to almost 13.2 million in 2022–23; an increase from 388 services per 1,000 population to 501 (Figure MBS.3). This was mainly due to increases in services provided by psychologists. From 2013–14 to 2022–23 there was a relatively small increase in the rate of these services delivered by psychiatrists.
Medicare Benefits Schedule data
The MBS data presented relate to services delivered on a fee-for-service basis for which MBS benefits were paid. The year and month are determined from the date the service was processed rather than the date the service was provided. Patient counts for demographic characteristics (for example sex and age) are derived from the last service processed in the reference period.
Services Australia collects data on the activity of all persons making claims through the MBS and provides this information to the Australian Government Department of Health and Aged Care (Services Australia 2024). Information collected includes the type of service provided (MBS item number) and the benefit paid for the service. The item numbers and benefits paid are based on the MBS (Department of Health and Aged Care 2023). Services that are not included in the MBS are not included in the data. The table below lists all MBS items that have been defined as mental health-specific.
Provider type | Item group | MBS Group | MBS item numbers |
|---|---|---|---|
Psychiatrists | Initial consultation new patient | Group A08 | 134(a), 296, 297, 299 |
Group A40 (T) | 92437, 92466(a), 92477(a), 92506(a) | ||
Patient attendances | Group A08 | 136(a), 138(a), 140(a), 142(a), 144(a), 146(a), 148(a), 150(a), 152(a), 288(T)(a), 291, 293, 294(T), 300, 302, 304, 306, 308, 310, 312, 314, 316, 318, 319, 320, 322, 324, 326, 328, 330, 332, 334, 336, 338, 353(T)(a), 355(T)(a), 356(T)(a), 357(T)(a), 358(T)(a), 359(T)(a), 361(T)(a), 364(a), 366(a), 367(a), 369(a), 370(a) | |
Group A40 (T) | 91827, 91828, 91829, 91830, 91831, 91837, 91838, 91839, 91840(a), 91841(a), 92435, 92436, 92461(a), 92462(a), 92463(a), 92464(a), 92465(a), 92475(a), 92476(a), 92501(a), 92502(a), 92503(a), 92504(a), 92505(a) | ||
Interview with non-patient | Group A08 | 157(a), 158(a), 159(a), 348, 350, 352 | |
Group A40 (T) | 92458, 92459, 92460, 92498(a), 92499(a), 92500(a) | ||
Case conferencing | Group A15 | 855, 857, 858, 861, 864, 866 | |
| Eating Disorders Treatment Plan preparation and review | Group A36 | 90260, 90262(T)(a), 90266, 90268(T)(a) | |
| Group A40 (T) | 92162, 92166(a), 92172, 92178(a) | ||
Electroconvulsive therapy | Group T01 | 153(a), 340(a), 886(a), 14224 | |
| Repetitive Transcranial Magnetic Stimulation (rTMS) | Group T01 | 14216, 14217, 14219, 14220 | |
Psychiatrist services - Other: Assessment and treatment of pervasive developmental disorder (PDD) | Group A08 | 289 | |
Group A40 (T) | 92434, 92474(a) | ||
Psychiatrist services - Other: Group psychotherapy | Group A08 | 154(a), 155(a), 156(a), 342, 344, 346 | |
Group A40 (T) | 92455, 92456, 92457, 92495(a), 92496(a), 92497(a) | ||
General practitioners | Mental Health Treatment Plan preparation and review | Group A07 | 272, 276, 277, 281, 282 |
Group A20 | 2700, 2701, 2702(a), 2710(a), 2712, 2715, 2717, 2719(a) | ||
Group A40 (T) | 92112, 92113, 92114, 92116, 92117, 92118, 92119, 92120, 92122, 92123, 92124(a), 92125(a), 92126, 92128(a), 92129(a), 92130(a), 92131(a), 92132, 92134(a), 92135(a) | ||
Group A42 | 93400(a), 93401(a), 93402(a), 93403(a), 93404(T)(a), 93405(T)(a), 93406(T)(a), 93407(T)(a), 93408(T)(a), 93409(T)(a), 93410(T)(a), 93411(T)(a), 93421(a), 93422(T)(a), 93423(T)(a), 93431(a), 93432(a), 93433(a), 93434(a), 93435(T)(a), 93436(T)(a), 93437(T)(a), 93438(T)(a), 93439(T)(a), 93440(T)(a), 93441(T)(a), 93442(T)(a), 93451(a), 93452(T)(a), 93453(T)(a) | ||
Mental Health Treatment service | Group A07 | 279, 894(T)(a), 896(T)(a), 898(T)(a) | |
Group A20 | 2713 | ||
Group A30 | 2121(a), 2150(a), 2196(a) | ||
Group A40 (T) | 92115, 92127, 92121, 92133 | ||
| 3 Step Mental Health Process | Group A18 | 2574(a), 2575(a), 2577(a), 2578(a) | |
| Group A19 | 2704(a), 2705(a), 2707(a), 2708(a) | ||
Eating Disorder Treatment Plan preparation, review and service | Group A36 | 90250, 90251, 90252, 90253, 90254, 90255, 90256, 90257, 90264, 90265, 90271, 90272, 90273, 90274, 90275, 90276, 90277, 90278, 90279(T)(a), 90280(T)(a), 90281(T)(a), 90282(T)(a) | |
Group A40 (T) | 92146, 92147, 92148, 92149, 92150, 92151, 92152, 92153, 92154(a), 92155(a), 92156(a), 92157(a), 92158(a), 92159(a), 92160(a), 92161(a), 92170, 92171, 92176, 92177, 92182, 92184, 92186, 92188, 92194, 92196, 92198, 92200 | ||
Focussed Psychological Strategies | Group A07 | 283, 285, 286, 287, 309, 311, 313, 315, 371(a), 372(a), 941(a), 942(a) | |
Group A20 | 2721, 2723, 2725, 2727, 2729(T)(a), 2731(T)(a), 2733(a), 2735(a), 2739, 2741, 2743, 2745 | ||
Group A39 | 91283(a), 91285(a), 91286(a), 91287(a), 91371(T)(a), 91372(T)(a), 91721(a), 91723(a), 91725(a), 91727(a), 91729(T)(a), 91731(T)(a) | ||
Group A40 (T) | 91818, 91819, 91820, 91821, 91842, 91843, 91844, 91845, 91859, 91861, 91862, 91863, 91864, 91865, 91866, 91867 | ||
Group A41 | 93287(a), 93288(a), 93291(a), 93292(a), 93300(a), 93301(T)(a), 93302(T)(a), 93303(a), 93304(T)(a), 93305(T)(a), 93306(a), 93307(T)(a), 93308(T)(a), 93309(a), 93310(T)(a), 93311(T)(a) | ||
Family Group Therapy | Group A06 | 170, 171, 172, 996(a), 997(a), 998(a) | |
Group A07 | 221, 222, 223 | ||
Electroconvulsive therapy | Group T10 | 20104 | |
Clinical psychologists | Psychological Therapy Services | Group M06 | 80000, 80001(T)(a), 80002, 80005, 80006, 80010, 80011(T)(a), 80012, 80015, 80016, 80020, 80021(T), 80022, 80023, 80024, 80025 |
Group M17 | 91000(a), 91001(a), 91005(a), 91010(a), 91011(a), 91015(a) | ||
Group M18 (T) | 91166, 91167, 91168, 91171, 91181, 91182, 91198, 91199 | ||
Group M25 | 93312(a), 93313(a), 93330(a), 93331(T)(a), 93332(T)(a), 93333(a), 93334(T)(a), 93335(T)(a) | ||
Group M27 | 93375(a), 93376(a) | ||
Eating Disorder Psychological Treatment Service | Group M16 | 82352, 82353(T)(a), 82354, 82355, 82356(T)(a), 82357, 82358, 82359 | |
Group M18 (T) | 93076, 93079, 93110, 93113 | ||
| Other psychologists | Focussed Psychological Strategies | Group M07 | 80100, 80101(T)(a), 80102, 80105, 80106, 80110, 80111(T)(a), 80112, 80115, 80116, 80120, 80121(T), 80122, 80123(T), 80127, 80128(T) |
Group M17 | 91100(a), 91101(T)(a), 91105(a), 91110(a), 91111(T)(a), 91115(a) | ||
Group M18 (T) | 91169, 91170, 91174, 91177, 91183, 91184, 91200, 91201 | ||
Group M26 | 93316(a), 93319(a), 93350(a), 93351(T)(a), 93352(T)(a), 93353(a), 93354(T)(a), 93355(T)(a) | ||
Group M28 | 93381(a), 93382(a) | ||
| Enhanced Primary Care | Group M03 | 10968 | |
| Eating Disorder Psychological Treatment Service | Group M16 | 82360, 82361(T)(a), 82362, 82363, 82364(T)(a), 82365, 82366, 82367(T) | |
| Group M18 (T) | 93084, 93087, 93118, 93121 | ||
Psychology health service - Other | Group M11 | 81355 | |
Group M29 | 93512(a), 93535(a) | ||
Group M30 | 93557(a), 93590(a) | ||
Psychology health service - Other: Assessment and treatment of PDD | Group M10 | 82000, 82015 | |
Group M18 (T) | 93032, 93035, 93040, 93043 | ||
| Allied health providers | Focussed Psychological Strategies - Occupational Therapist | Group M07 | 80125, 80126(T)(a), 80129, 80130, 80131, 80135, 80136(T)(a), 80137, 80140, 80141, 80145, 80146(T), 80147, 80148(T), 80152, 80153(T) |
Group M17 | 91125(a), 91126(T)(a), 91130(a), 91135(a), 91136(T)(a), 91140(a) | ||
Group M18 (T) | 91172, 91173, 91185, 91186, 91194, 91195, 91202, 91203 | ||
Group M26 | 93322(a), 93323(a), 93356(a), 93357(T)(a), 93358(T)(a), 93359(a), 93360(T)(a), 93361(T)(a) | ||
Group M28 | 93383(a), 93384(a) | ||
| Focussed Psychological Strategies - Social Worker | Group M07 | 80150, 80151(T)(a), 80154, 80155, 80156, 80160, 80161(T)(a), 80162, 80165, 80166, 80170, 80171(T), 80172, 80173(T), 80174, 80175(T) | |
| Group M17 | 91150(a), 91151(T)(a), 91155(a), 91160(a), 91161(T)(a), 91165(a) | ||
| Group M18 (T) | 91175, 91176, 91187, 91188, 91196, 91197, 91204, 91205 | ||
| Group M26 | 93326(a), 93327(a), 93362(a), 93363(T)(a), 93364(T)(a), 93365(a), 93366(T)(a), 93367(T)(a) | ||
| Group M28 | 93385(a), 93386(a) | ||
| Enhanced Primary Care | Group M03 | 10956 | |
Mental Health service | Group M11 | 81325 | |
Group M29 | 93506(a), 93529(a) | ||
Group M30 | 93551(a), 93584(a) | ||
Eating Disorder Treatment Service | Group M16 | 82350, 82351(T)(a), 82368, 82369(T)(a), 82370, 82371, 82372(T)(a), 82373, 82374, 82375(T), 82376, 82377(T)(a), 82378, 82379, 82380(T)(a), 82381, 82382, 82383(T) | |
Group M18 (T) | 93074, 93092, 93095, 93100, 93103, 93108, 93126, 93129, 93134, 93137 | ||
Paediatrician | Eating Disorder Treatment Plan preparation and review | Group A36 | 90261, 90263(T)(a), 90267, 90269(T)(a) |
Group A40 (T) | 92163, 92167(a), 92173, 92179(a) |
(a) Item discontinued
(T) Telehealth item
Provider type important notes
- General practitioner includes services provided by Medical practitioners, including general practitioners, but excluding specialists or consultant physicians.
- Clinical psychologist includes item numbers that can only be claimed by eligible Clinical psychologists.
- Other psychologist includes item numbers that can be claimed by any eligible psychologist, clinical and other. The proportion of activity claimed against these items by Clinical psychologists has not been estimated in the presented data. That is, the services rendered by Clinical psychologists will be present in both the Clinical psychologist and Other psychologist categories.
Psychiatrist items – pre 1996
Restructuring of Group A8 items occurred as of 1 November 1996. Item numbers 134, 136, 138, 140, 142, 144, 146, 148, 150, 152, 153, 154, 155, 156, 157, 158 and 159 were discontinued as of 31 Oct 1996. Historical psychiatrist data includes services claimed against these item numbers.
Bushfire items
Item numbers for claims by people whose mental health was affected by a bushfire during 2019–20 and 2020–21 include services provided by:
- GPs: 894, 896, 898, 2121, 2150, 2196, 91283, 91285, 91286, 91287, 91371, 91372, 91721, 91723, 91725, 91727, 91729, 91731;
- Clinical psychologists: 91000, 91001, 91005, 91010, 91011, 91015
- Other psychologists: 91100, 91101, 91105, 91110, 91111, 91115
- Other allied health: 91125, 91126, 91130, 91135, 91136, 91140, 91150, 91151, 91155, 91160, 91161, 91165.
Note, these items were discontinued on 30 June 2022.
Department of Health and Aged Care (2023) Medicare Benefits Schedule Book, effective 1 July 2023, Department of Health and Aged Care website, accessed 15 February 2024.
Services Australia (2024) Information for allied health professionals. Better Access Initiative – supporting mental health care, Services Australia website, accessed 9 February 2024.
Data presented covers the time period 2013–14 to 2022–23. This section was last updated in April 2024.


