Residential mental health care services
Summary
Residential mental health care (RMHC) services provide specialised mental health care on an overnight basis in a domestic-like environment. These facilities may provide a range of services including rehabilitation, treatment and extended care. Data from the National Residential Mental Health Care Database (NRMHCD) are used to describe the care provided by these services with data contributed by states and territories. More information about the NRMHCD is available in the data source section. Additional information on residential health care services can be found in the Specialised mental health care facilities section. For information on involuntary mental health legal status in residential mental health care services, refer to Involuntary treatment in mental health care.
Spotlight data
Number of residents, episodes, principal diagnoses and access by age group, 2005–06 to 2021–22
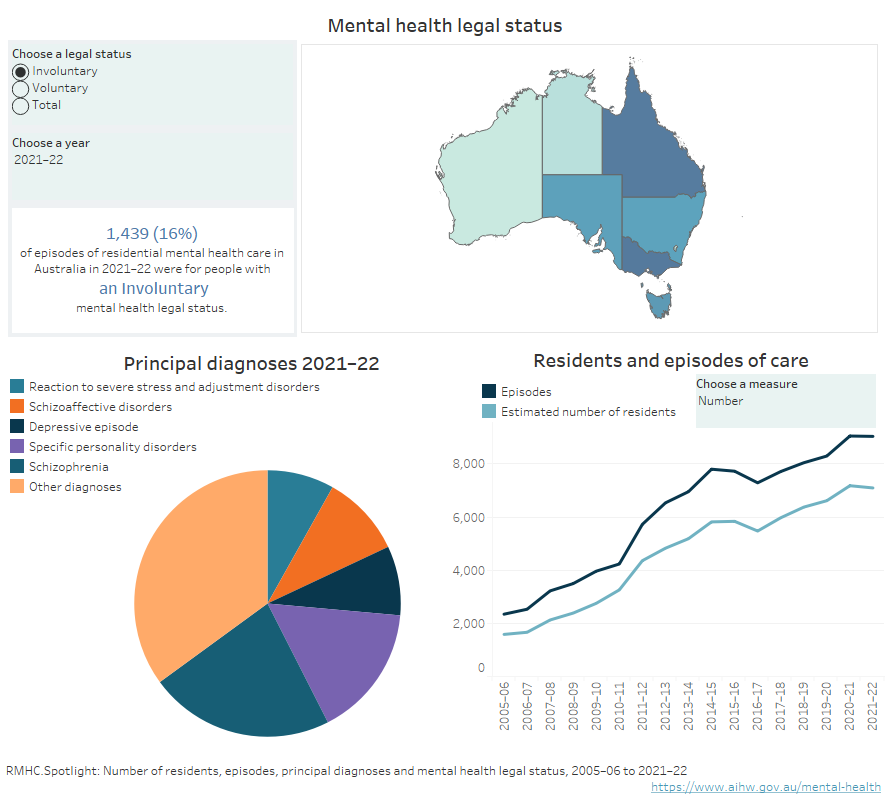
Infographic containing a pie chart showing proportions of 6 principal diagnosis categories 2021–22; a bar graph showing access by age group 2021–22; and a line chart showing the number and rate per 10,0000 population of residents and episodes of care from 2005–06 to 2021–22, (refer to Table RMHC.2 and Table RMHC.15).
How many people access residential mental health care services?
There were about 9,000 continuing and completed episodes of residential care in 2021–22, 376,500 residential care days and an estimated 7,100 residents. This equates to about 40 residential care days per episode.
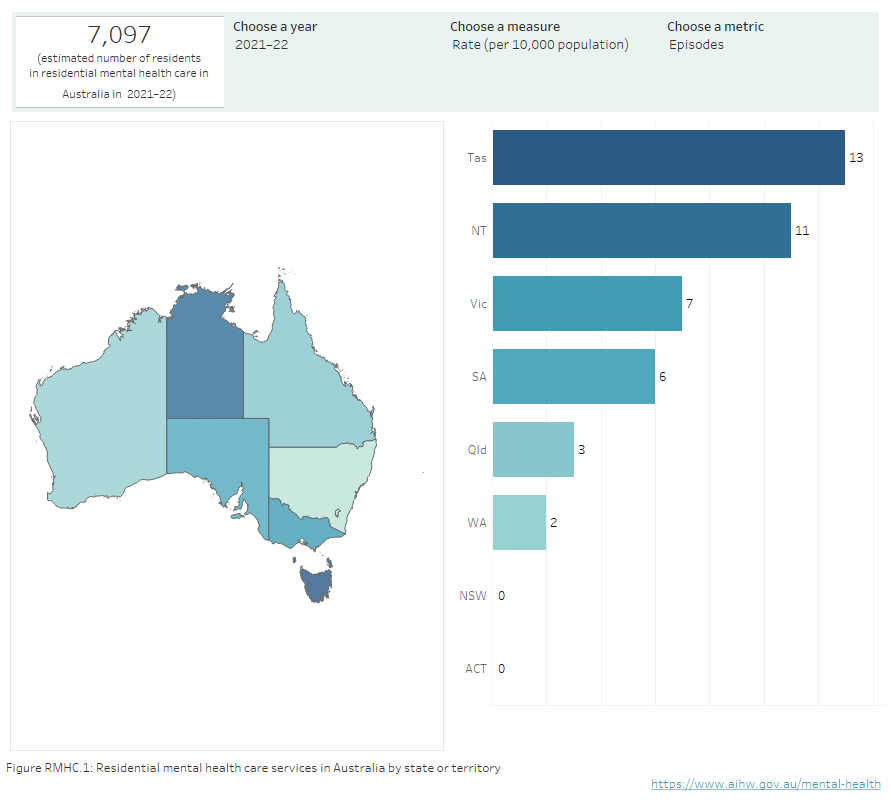
The provision of RMHC services differed between states and territories. Tasmania reported the highest rates (per 10,000 population) of episodes of care (13), estimated number of residents (10) and residential care days (about 690) (Figure RMHC.1).
Between 2012–13 and 2021–22, the estimated number of people across Australia accessing residential care increased from about 4,800 to 7,100 (Figure RMHC. Spotlight), and the rate of people (per 10,000 population) accessing care increased from 2 to 3.
Figure RMHC.1: Residential mental health care services in Australia by state or territory
Infographic containing a map of Australia showing residential mental health care episodes, estimated number of residents and residential care days (rate per 10,000 population and number), by state or territory.
Notes:
- Comparisons between jurisdictions and years should be made with caution.
- Australian Capital Territory did not report any residential mental health services from 2019–20 to 2021–22. National data excludes Australian Capital Territory.
Source: National Residential Mental Health Care Database; Table RMHC.2.
Resident demographics
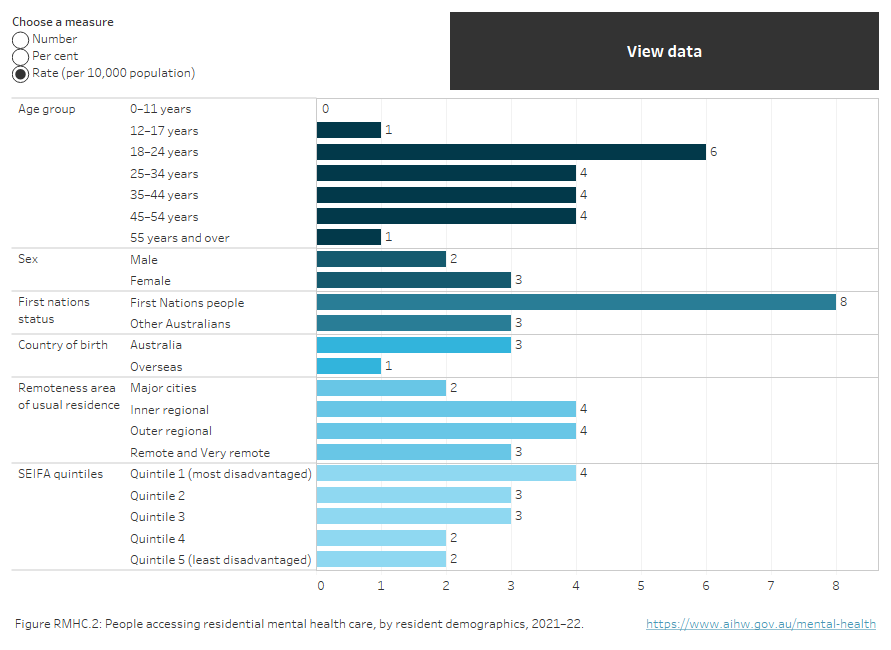
People aged 18–24 years accessed care at a higher rate than other age groups (6 people per 10,000 population) in 2021–22. There were no residents aged under 12 years.
Aboriginal and Torres Strait Islander (First Nations) people comprised about 9% of residents in 2021–22 with a rate per 10,000 population that was almost 3 times the rate of other Australians (8 compared with 3).
People born in Australia accessed care in 2021–22 at about 3 times the rate for people born overseas (3 per 10,000 population compared with 1), with about 86% of residents born in Australia.
People in SEIFA quintile 1 (most disadvantaged) accessed care at a rate higher than all other quintiles (4 people per 10,000 population) and comprised 28% of the RMHC population (Figure RMHC.2).
Figure RMHC.2: People accessing residential mental health care, by resident demographics, 2021–22
Horizontal bar chart showing the rate (per 10,000 population), per cent or number of people accessing residential mental health care by demographic variables of age group, sex, First Nations status, country of birth, remoteness area and SEIFA quintile in 2021–22. Those aged 18-24 years had the highest rate at 6. There were no residents aged under 12 years. 2 males and 3 females per 10,000 population received residential mental health care services. 8 First Nations people per 10,000 population and 3 non-Indigenous Australians received residential mental health care services. 3 people per 10,000 population who were born in Australia and 1 people who were born overseas, received residential mental health care services. The highest rates for area of usual residence were Inner regional and Outer regional at 4 people per 10,000 population, while those in Major cities had the lowest rate of 2 people per 10,000 population. SEIFA Quintile 1 (most disadvantaged) had the highest rate of people receiving residential mental health care services at 4 per 10,000 population, while Quintiles 4 and 5 had the lowest at 2 (refer to Table RMHC.3).
Source: National Residential Mental Health Care Database; Table RMHC.3.
Principal diagnoses
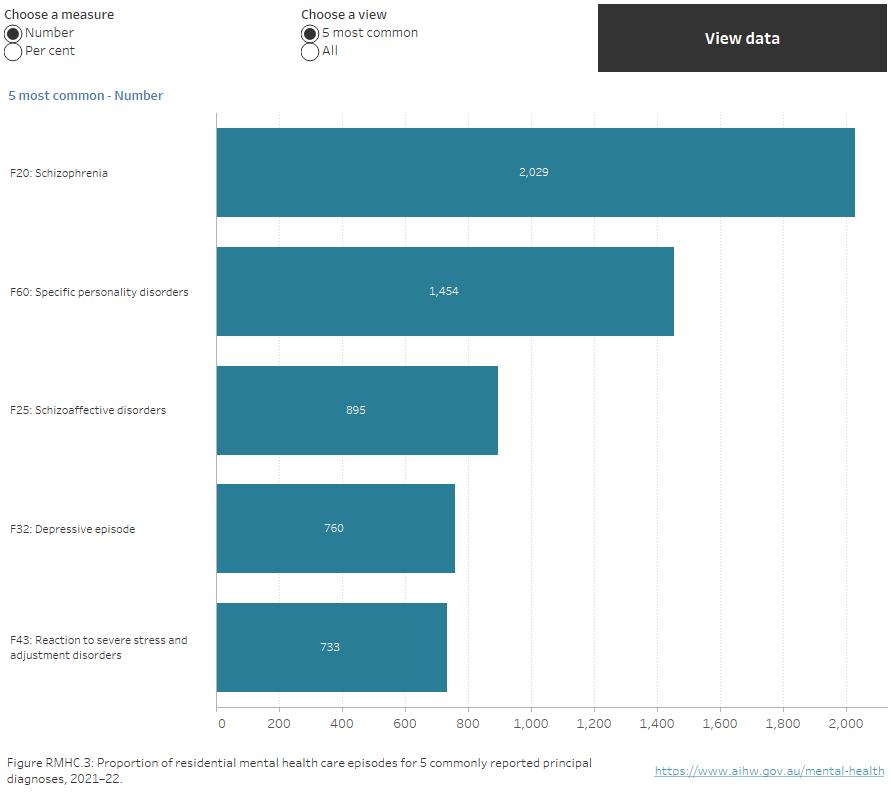
The 5 most commonly reported mental health-related principal diagnoses for residential mental health care episodes were:
- Schizophrenia (about 2,030 episodes, 22% of all episodes),
- Specific personality disorders (about 1,450, 16%),
- Schizoaffective disorders (about 900, 10%),
- Depressive episode (760, 8%), and
- Reaction to severe stress and adjustment disorders (about 730, 8%) (Figure RMHC.3).
Figure RMHC.3: Proportion of residential mental health care episodes for 5 commonly reported principal diagnoses, 2021–22
A horizontal bar chart showing the number of residential mental health care episodes with all principal diagnoses in 2021–22. Schizophrenia was recorded for 2,029 of residential mental health care episodes; Specific personality disorders, 1,454; Schizoaffective disorders, 895; Depressive episode, 760; and Reaction to severe stress and adjustment disorders, 733 (refer to Table RMHC.15).
Source: National Residential Mental Health Care Database; Table RMHC.15
Characteristics of residential care episodes
In 2021–22, 7,950 residential episodes of care formally ended before the end of the reference period (on or before 30 June 2022). This is known as a completed residential stay. The most frequent episode length was 2 weeks or less (58%) (Figure RMHC.4) and a small number of episodes of care (3%) lasted longer than 1 but less than 5 years.
Figure RMHC.4: Residential mental health care episodes, by length of completed residential stay, 2006–07 to 2021–22
An interactive line chart showing the number of residential mental health care episodes by length of completed residential stay from 2006–07 to 2020–21. In 2020–21, episodes lasting between 0 to 2 weeks comprised 58% of episodes; between 2 weeks to 1 month, 27%; between 1 and 3 months, 7%; between 3 and 6 months, 3%; between 6 and 12 months, 2%; between 1 and 5 years, 3%; more than 5 years, 0% (refer to Table RMHC.9).
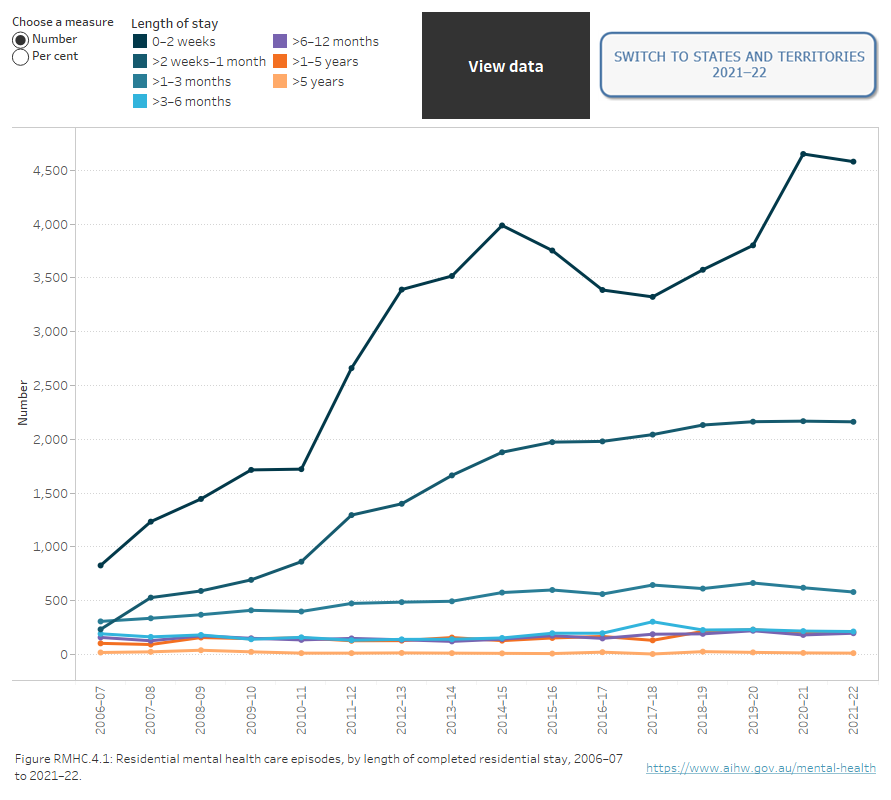
Source: National Residential Mental Health Care Database; Figure RMHC.4.1 – Table RMHC.9, Figure RMHC.4.2 – Table RMHC.8.
Where can I find more information?
National Residential Mental Health Care Database
The scope for this collection is all episodes of care in all government-funded residential mental health care (RMHC) services in Australia, except those RMHC services that are in receipt of funding under the Aged Care Act 1997 and subject to other Commonwealth reporting requirements. The inclusion of non‑government-operated services in receipt of government funding is optional.
Data Quality Statements for National Minimum Data Sets (NMDSs) are published annually via the AIHW’s Metadata Online Registry (METEOR). Statements provide information on the institutional environment, timeliness, accessibility, interpretability, relevance, accuracy and coherence. Previous years’ data quality statements are also accessible in METEOR.
In 2017–18, Queensland reclassified existing Community Care Units from admitted patient care to residential mental health service units.
For information related to staffing, beds and the number of RMHC facilities that provide specialised mental health care, visit the Specialised mental health care facilities section. More information about the coverage and data quality of this collection can be found in METEOR.
Data in this section were last updated in December 2023


