Specialised mental health care facilities
158 public hospitals and 71 private hospitals

provided specialised mental health services during 2021–22
6,850 specialised mental health public hospital beds

were available in 2021–22
14,700 staff

were employed by community mental health care services in 2021–22
Specialised mental health care facilities are a key component in delivering mental health care in Australia. Specialised mental health care is delivered in and by a range of facilities including public and private psychiatric hospitals, psychiatric units or wards in public acute hospitals, Community mental health care services and government-operated and non-government-operated Residential mental health services. The information presented in this section is drawn primarily from the National Mental Health Establishments Database. More detail about these and the other data used in this section can be found in the data source section.
Spotlight data
Overview of specialised mental health care facilities across Australian states and territories, 2011–12 to 2021–22
An overview of specialised mental health care facilities nationally and for states and territories from 2011–12 to 2021-22, with the option to display data from 1992–93 to 2021–22.
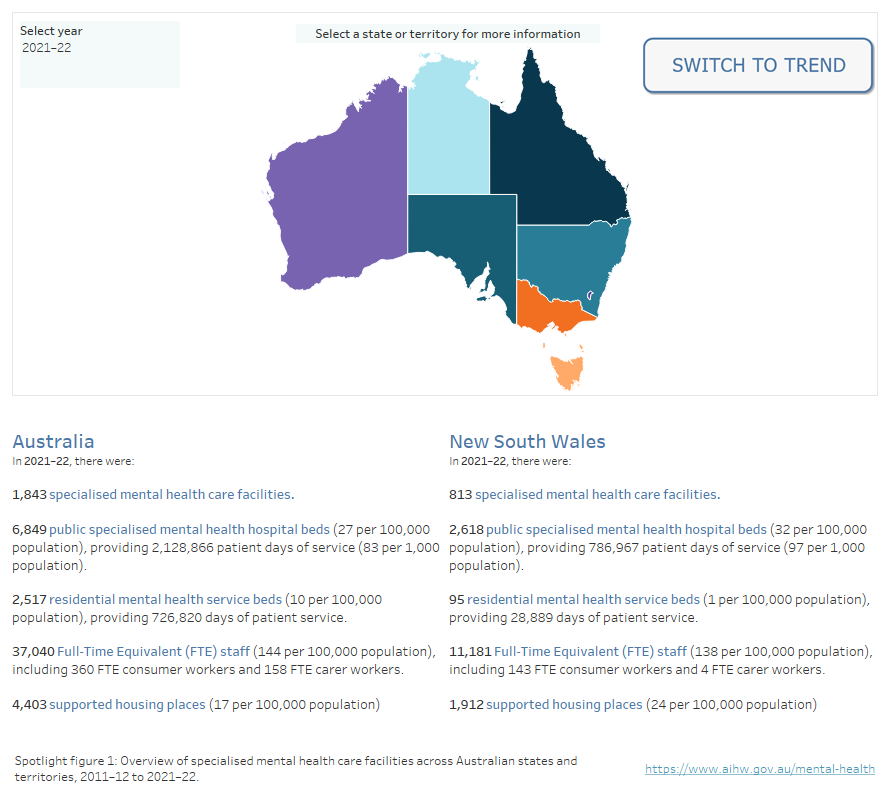
Note: Australian Capital Territory data for 2021–22 was not available at the time of publication. Updated data for ACT will be published when available. National total calculations for 2021–22 do not include ACT data. Caution should be exercised when conducting time series analyses.
Source: Specialised mental health care facilities tables
Please note that Australian Capital Territory data for 2021–22 was not available at the time of publication. Updated data for ACT will be published when available. National total calculations for State and Territory jurisdictional (non-Commonwealth data) for 2021–22 do not include ACT data. Caution should be exercised when conducting time series analyses.
What mental health facilities are available for First Nations people?
Aboriginal and Torres Strait Islander (First Nations) people may access a range of culturally appropriate mental health services provided by Australian, state and territory governments.
For example, the Australian Government funds health organisations to provide social and emotional wellbeing (SEWB) services for First Nations people (AIHW 2023). SEWB services provide a range of support services including counselling, casework, family tracing and reunion support and other wellbeing activities for individuals, families, and communities.
In 2021–22, about 560 SEWB staff were located across Australia, providing approximately 272,000 client contacts (AIHW 2023). For more information on the organisation profile, staffing and types of services provided by SEWB services, refer to the report Aboriginal and Torres Strait Islander-specific primary health care: results from the Online Services Report (OSR) and the national Key Performance Indicators (nKPI) collections.
How many specialised mental health service organisations are there across Australia?
During 2021–22, there were 171 Specialised mental health service organisations across Australia managing the 1,772 public specialised mental health facilities. For most states and territories, a specialised mental health service organisation is equivalent to the area/district mental health service. These organisations may consist of one or more specialised mental health service units which may be based in different locations.
Around 4 in 5 (81% or 138) of these organisations provided community services. Two-thirds (66% or 113) provided public hospital services, and almost half (46% or 79) provided residential services.
Almost two-thirds (65% or 111) of these organisations provided 2 or more types of services. Among these, almost all (97% or 108) paired public hospital services and community services. This group accounted for almost all beds (98%) and patient days (98%) provided by public hospital services and almost all (93%) community service contacts.
Specialised mental health organisations employ mental health consumer workers and mental health carer workers for their lived experience of mental illness and caring for people with mental illness.
In 2021–22, over half (54% or 93) of these organisations employed Consumer workers, and almost 1 in 3 (32% or 55) employed Carer workers. New South Wales and South Australia had the highest proportion of organisations employing Consumer workers (82% and 76% respectively). South Australia and Queensland had the highest proportion of organisations employing Carer workers (both 67%).
Between 2017–18 and 2021–22, the rate of full-time equivalent (FTE) Consumer workers per 10,000 mental health care provider FTE staff increased by an annual average of 15%. For Carer workers over this period the annual average increase was 20%. Time series comparisons with this workforce should be approached with caution (more information can be found in the data source section).
Specialised mental health organisations report on the type of consumer committee representation arrangements that are in place to promote the inclusion of mental health consumers in the planning, delivery and evaluation of services. These arrangements are reported across 4 levels: Level 1 represents the most formal consumer committee representation arrangements and Level 4 no formal consumer advisory arrangements. The data source section provides full descriptions of each level.
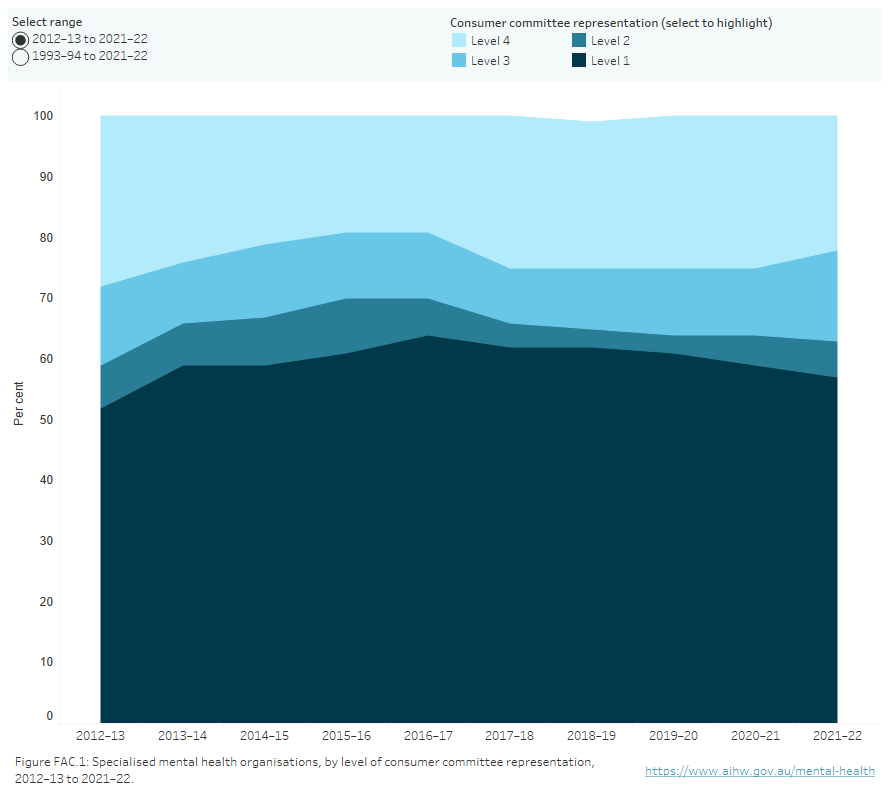
In 2021–22, almost 3 in 5 (57% or 97) organisations reported a formal position on their management committee or specific consumer advisory committee.
Between 2017–18 and 2021–22, the proportion of organisations with Level 1 arrangements decreased from 62% to 57%, and the proportion of Level 4 representation decreased from 25% to 22% (Figure FAC.1).
Figure FAC.1: Specialised mental health organisations, by level of consumer committee representation, 2012–13 to 2021–22
A stacked area chart showing the level of consumer committee representation arrangements in mental health organisations from 2012–13 to 2021–22, with the option to display data from 1993–94 to 2021–22. Over the past 10 years, Level 1 consumer representation has consistently been the most common arrangement, while Level 2 consumer representation has consistently been the least common. Refer to Table FAC.8.
Key:
Level 1 Formal consumer position(s) exist on the organisation’s management committee; or specific consumer advisory committee(s) exist to advise on all mental health services managed.
Level 2 Specific consumer advisory committee(s) exist to advise on some mental health services managed.
Level 3 Consumers participate on an advisory committee representing a wide range of interests.
Level 4 No consumer representation on any advisory committee; meetings with senior representatives encouraged.
Note: Australian Capital Territory data for 2021–22 was not available at the time of publication. Updated data for ACT will be published when available. National total calculations for 2021–22 do not include ACT data. Caution should be exercised when conducting time series analyses.
Source: Specialised mental health care facilities tables FAC.8
Services provided by specialised mental health organisations are measured against the National Standards for Mental Health Services (the National Standards). There are 8 levels available to describe the degree to which a specialised mental health service organisation meets the National Standards, from Level 1 (a service unit has met all national standards) through to Level 8 (national standards do not apply). Reporting levels for National Standards can be found in the data source section, which provides full descriptions of all 8 levels and how they are grouped into 4 levels for reporting purposes.
Specialised mental health beds
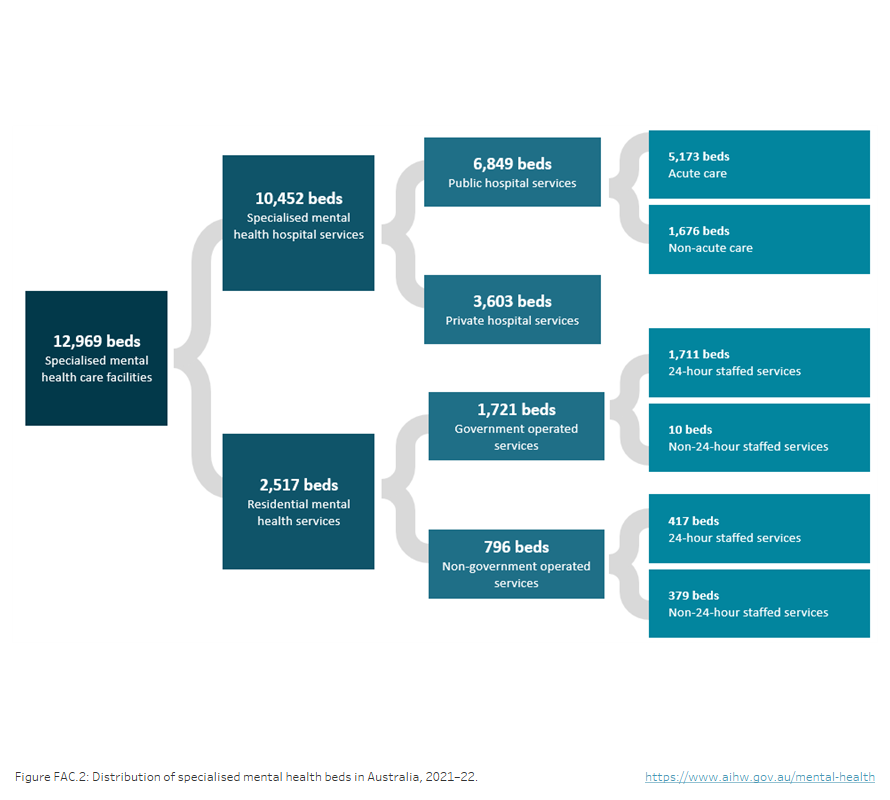
During 2021–22, there were approximately 13,000 specialised mental health beds available nationally. Of these about 6,850 beds were in public hospital services, 3,600 in private hospitals, and 2,520 in residential mental health care services (Figure FAC.2).
Figure FAC.2: Distribution of specialised mental health beds in 2021–22
The distribution of specialised mental health beds in 2021–22. The diagram shows that most beds were provided in hospitals, while residential beds accounted for approximately 1 in 5 beds. Public hospitals provided around twice the number of beds than private hospitals and most public hospital beds were for acute care. Most residential mental health care services beds were provided by government-operated services. Most of the residential beds in government-operated services were provided in 24-hour staffed residential services, whereas in non-government operated services, more beds were provided in non-24 hour staffed services.
Note: ACT data for 2021–22 was not available at the time of publication. Updated data for ACT will be published when available. National total calculations for 2021–22 do not include ACT data. Caution should be exercised when conducting time series analyses.
Source: Specialised mental health care facilities tables
Public sector specialised mental health hospital beds
In 2021–22, of the approximately 6,850 public sector specialised hospital beds available in Australia, more than three quarters (77% or about 5,300) were in specialised psychiatric units or wards within public acute hospitals, with the remainder in public psychiatric hospitals (about 1,540).
Public sector beds can also be described by the target population or program type category of the unit, or a combination of both.
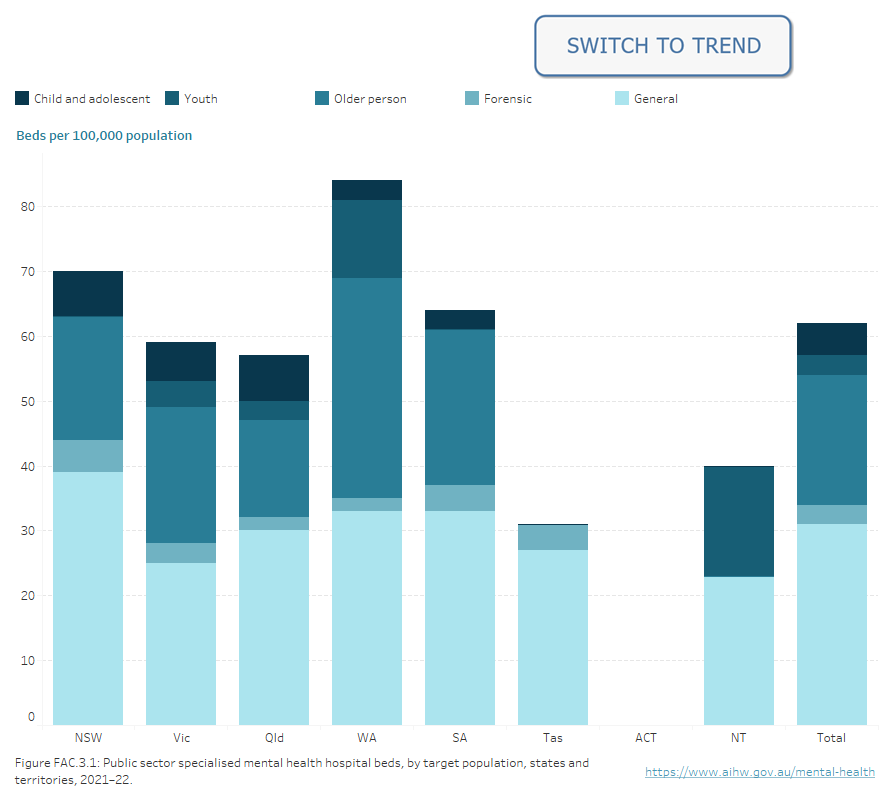
During 2021–22, most public sector specialised mental health hospital beds (4,930 or 72%) were in General services, 860 (13%) were in Older person services, 660 (10%) were in Forensic services and 310 (5%) were in Child and adolescent services. A small number of beds were in Youth services (1% or 83), a service category introduced in 2011–12.
The proportion of specialised hospital beds for each service category varied across states and territories, reflecting differing service profiles across jurisdictions. Most beds were in services classified as General, accounting for at least two-thirds of beds in each jurisdiction.
Figure FAC.3: Public sector specialised mental health hospital beds, by target population, states and territories, 2021–22
Stacked bar chart showing the proportion of public sector specialised mental health hospital beds by target population in 2021–22. Target Populations are: General, Child and adolescent, Youth, Older person and Forensic. Refer to Table FAC.14.
Note: Australian Capital Territory data for 2021–22 was not available at the time of publication. Updated data for ACT will be published when available. National total calculations for 2021–22 do not include ACT data.
Source: Specialised mental health care facilities tables FAC.14 & FAC.23
In 2021–22, three quarters (76% or 5,170) of public sector specialised hospital beds across Australia were in acute services (Figure FAC.4). The proportion of acute beds differed across target population groups. Most General beds (77%), Child and adolescent beds (86%), Youth beds (100%), and Older person beds (82%) were in Acute services compared with less than half of Forensic beds (46%).
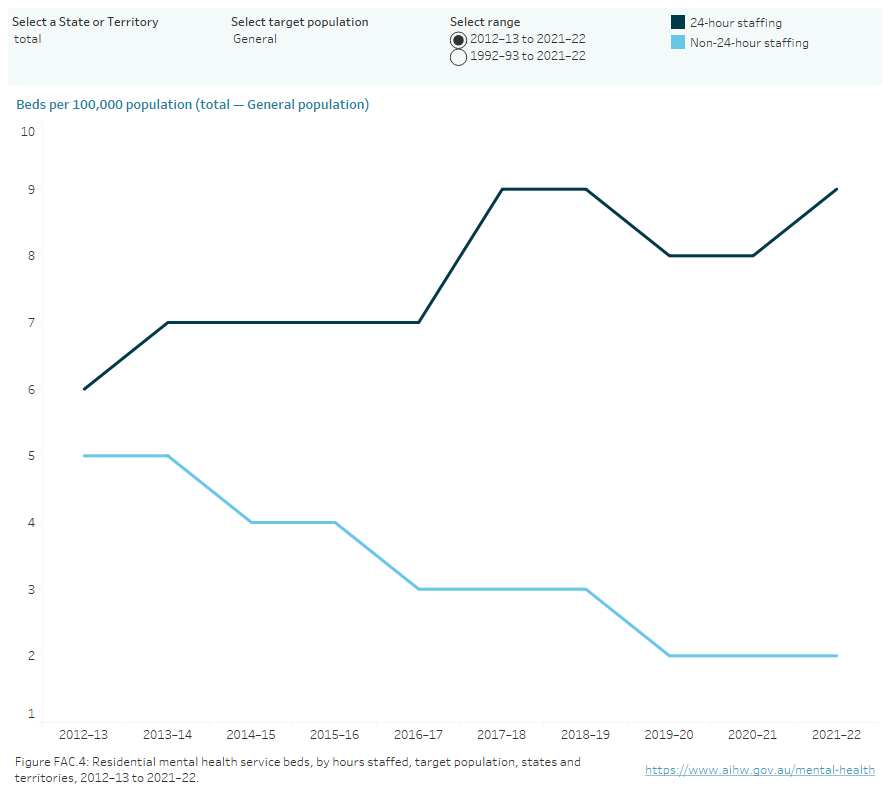
In 2021–22, there were about 2,520 residential mental health service beds available nationally. These can be characterised by staffing level, target population and the service operator, reflecting the service profile mix implemented in each state or territory.
Around two-thirds of residential beds (1,720 or 68%) were in government-operated services.
More than 4 in 5 (85% or 2,130) residential beds were operated with mental health trained staff working in active shifts for 24 hours a day, with most of these beds in government-operated services (80% or 1,710). By contrast, non-24-hour staffed residential beds were predominantly provided by the non-government sector.
Around two-thirds (70% or 1,750) of all residential beds were in General services with the majority of these (83% or 1,460) in 24-hour staffed facilities.
In 2021–22, there were 10 residential beds per 100,000 nationally.
Figure FAC.4: Residential mental health service beds, by hours staffed, target population, states and territories, 2012–13 to 2021–22
A line graph of residential mental health service beds per 100,000 population by hours staffed and target population in states and territories from 2012–13 to 2021–22, with the option to display data from 1992–93 to 2021–22. Between 2012–13 and 2021–22, the rate of 24-hour staffed beds for the general population has trended up, from 6 per 100,000 population to 9. Over the same period, the rate of non-24-hour staffed beds has trended down, from 5 to 2. Refer to Table FAC.19.
Note: Australian Capital Territory data for 2021–22 was not available at the time of publication. Updated data for ACT will be published when available. National total calculations for 2021–22 do not include ACT data. Caution should be exercised when conducting time series analyses.
Source: Specialised mental health care facilities tables FAC.19
24-hour staffed public sector care
Mental health services with staff employed in active shifts for 24 hours a day are provided through either public sector specialised hospital services (inpatient care) or 24-hour staffed residential care services.
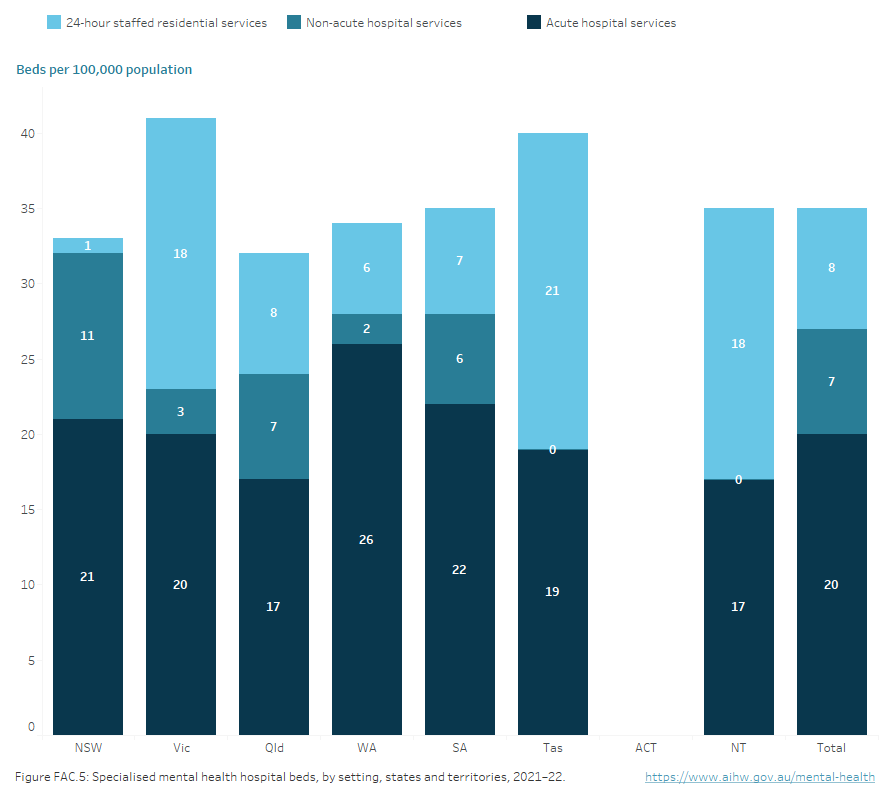
In 2021–22, the national average for 24-hour staffed public sector beds was 35 beds per 100,000 population (Figure FAC.5).
Acute hospital services accounted for the highest rate of beds across most states and territories.
Figure FAC.5: Specialised mental health hospital beds, by setting, states and territories, 2021–22
Stacked vertical bar chart showing public sector specialised mental health hospital beds per 100,000 population, by program type, and 24-hour-staffed residential mental health service beds per 100,000 population, states and territories, 2021–22: New South Wales (33), Victoria (41), Queensland (32), Western Australia (35), South Australia (35), Tasmania (40), Australian Capital Territory (n.a.), Northern Territory (35), national rate (35). Across all states and territories, the highest number of beds per 100,000 were provided by Acute hospital services: New South Wales (21), Victoria (20), Queensland (17), Western Australia (26), South Australia (22), Australian Capital Territory (n.a.) and Northern Territory (17). In Tasmania (19) the rate of beds per 100,000 in Acute services was almost the same as the rate for beds in 24-hour staffed residential services (21). Refer to Table FAC.23.
Note: Australian Capital Territory data for 2021–22 was not available at the time of publication. Updated data for ACT will be published when available. National total calculations for 2021–22 do not include ACT data. Caution should be exercised when conducting time series analyses.
Source: Specialised mental health care facilities tables FAC.23
Private hospital specialised mental health beds
There were about 3,600 available beds (14 per 100,000 population) in private hospitals in 2021–22, including specialised units or wards. More information on private hospital specialised mental health beds, can be found in the report Private Hospital-based Psychiatric Services 1 July 2021 to 30 June 2022.
The number of public sector specialised hospital and residential service beds has changed little in the past 5 years, decreasing from about 9,440 beds in 2017–18 to about 9,370 beds in 2021–22. Over the same period, the combined rate of hospital and residential beds per 100,000 population has declined from 36 to 35. The combined rate of public hospital and residential beds when reporting began in 1992–93 was 50.
There was a decrease in the number of public psychiatric hospital beds in the past 5 years, from about 1,610 beds in 2017–18 to about 1,540 beds in 2021–22. Over this period there was no change in the number of beds in specialised psychiatric units or wards in public acute hospitals. Time series comparisons should be approached with caution.
There was a decrease in the number of specialised residential service beds from about 2,550 in 2017–18 to about 2,520 in 2021–22. Over this period, the rate of residential mental health service beds per 100,000 population remained steady at 10.
In addition to the services described above, states and territories provide supported housing places for people diagnosed with a mental illness. Nationally, 4,400 supported housing places were available in 2021–22. However, caution should be exercised when comparing rates across jurisdictions as not all jurisdictional mental health housing support schemes are in scope for the Mental Health Establishment NMDS. The data source section provides further information.
Around 2.1 million patient days were provided by public hospital services during 2021–22. Over three-quarters (77%) of these were in specialised psychiatric units or wards in public acute hospitals, reflecting the number of available beds for this service type. Across public sector hospital services in 2021–22, the national rate was 83 per 1,000 population.
During 2021–22, residential services provided more than 726,800 patient days. Over 4 in 5 (84%) were for residents of 24-hour staffed services. The national rate in General services was 33 per 1,000 population.
During 2021–22, private hospital services provided about 1.2 million patient days, equating to 45 days per 1,000 population.
Staffing of specialised mental health care facilities
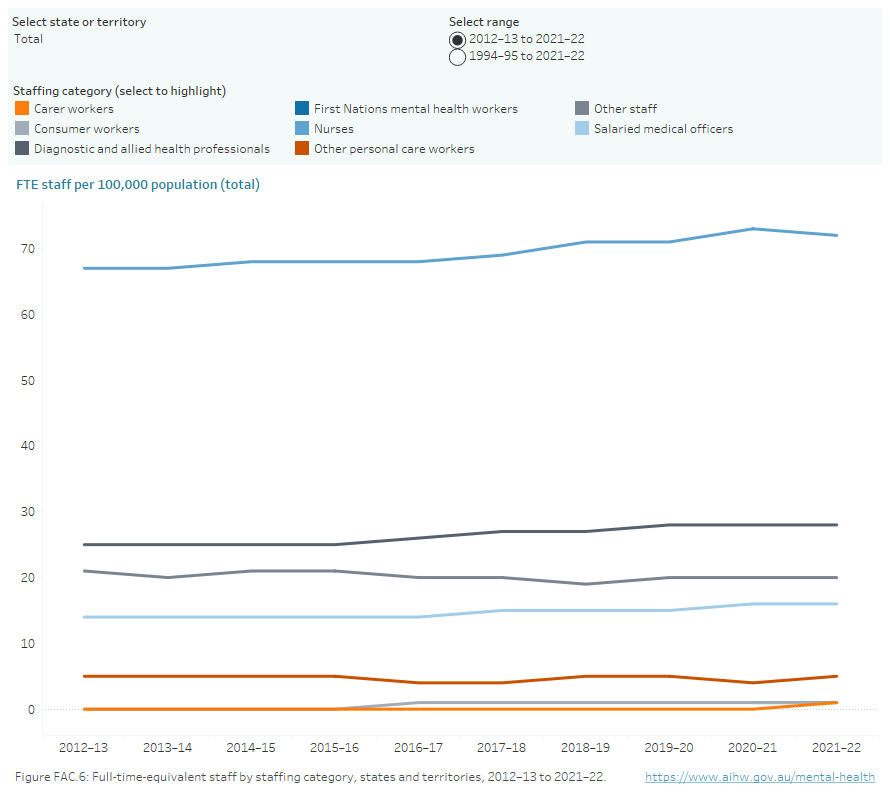
State and territory specialised services include public psychiatric hospitals, psychiatric units or wards in public acute hospitals, community services and government and non‑government‑operated residential services. In 2021–22, there were 144 FTE staff per 100,000 population nationally employed in specialised services (Figure FAC.6).
Nurses were the largest FTE staff category across all jurisdictions.
In 2021–22, of the approximately 37,000 FTE patient-days staff of specialised services, half were Nurses (50% or about 18,600 FTE) of which most were Registered nurses (16,100 FTE). Diagnostic and allied health professionals were the second largest group (19%), comprising mostly Social workers (2,780 FTE) and Psychologists (1,850 FTE). Salaried medical officers made up 11% of FTE staff, with similar numbers of consultant psychiatrists and psychiatrists (1,780 FTE) and Psychiatry registrars and trainees (1,920 FTE).
The population rate of FTE staff employed in specialised services increased between 2017–18 and 2021–22 by an average annual change of 3%.
Figure FAC.6: Full-time-equivalent staff by staffing category, states and territories, 2012–13 to 2021–22
Line chart showing full-time-equivalent staff per 100,000 population by staffing category and jurisdictions from 2012–13 to 2021–22, with the option to display data from 1994–95 to 2021–22. Staffing categories are: Salaried medical officers, Nurses, First Nations mental health workers, Diagnostic and allied health professionals, Other personal care, Consumer workers, Carer workers and Other staff. Nurses made up the majority of full-time-equivalent staff across all jurisdictions. Refer to Table FAC.37.
Note: Australian Capital Territory data for 2021–22 was not available at the time of publication. Updated data for ACT will be published when available. National total calculations for 2021–22 do not include ACT data. Caution should be exercised when conducting time series analyses.
Source: Specialised mental health care facilities tables FAC.37
Specialised mental health care service units
Staff employed by state and territory specialised mental health care services can also be described by the service setting where they are employed.
More than two-fifths (43% or about 15,800 FTE) of state and territory staff were employed in public hospital specialised services during 2021–22. Community services employed the next largest number of FTE staff (40% or about 14,700 FTE). While the rate of FTE staff per 100,000 population within organisational overhead settings increased from 14 to 15 between 2017–18 and 2021–22, over the same period, the rate increased for public hospital services (from 60 to 61), residential services (from 10 to 11) and community services (from 52 to 57).
Since the start of reporting in 1993–1994, the population rate of FTE staff employed by hospital admitted patient services has ranged between 58 and 77 FTE per 100,000 population. Between 2017–18 and 2021–22, this rate has increased from 60 to 61.
The rate of FTE staff employed by community services increased every year from 1993–94 to 2011–12 (from 24 to 58 FTE) after which it levelled off in the low 50s. Between 2017–18 and 2021–22, the rate has again increased from 52 to 57.
The rate of FTE staff employed by residential services has been broadly stable over the past 21 reporting periods (typically between just below 9 and 11 FTE per 100,000 population). Organisational overhead service settings have been reported as a service setting since 2012–13, with the rate ranging between 10 and 15 FTE.
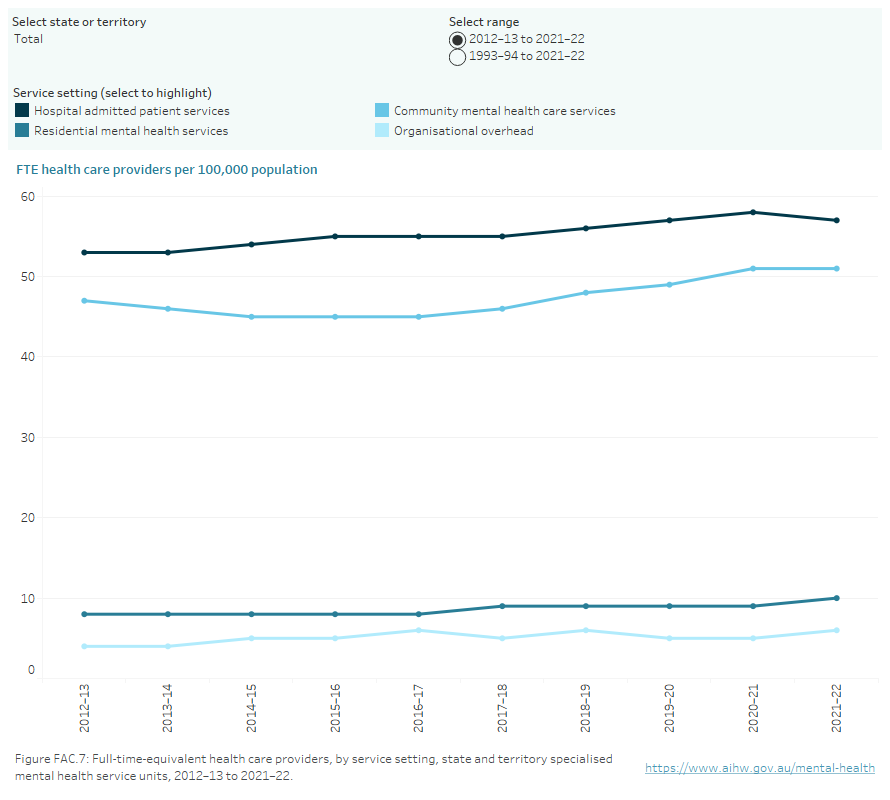
Health care providers include the staffing categories of Salaried medical officers, Nurses, Diagnostic and allied health professionals, Consumer and carer workers and Other personal care staff. These categories can be described at the overall organisational level, by service setting and by target population. In 2021–22, public hospital services employed 57 FTE health care providers per 100,000 population, community services employed 51 and residential services employed 10 (Figure FAC.7).
Between 1992–93 and 2021–22, the FTE rate was consistently highest for hospital admitted patient service settings, ranging between 45 and 58 (in 1997–98 and 2021–22 respectively). The rate was consistently second highest for community mental health care service settings, which increased from 19 in 1992–93 to 51 in 2021–22. The rate for residential service settings increased from 4 to 10 between the same period with a low of 3 in 1993–94. The organisational overhead setting has been reported since 2012–13, with a rate ranging between 4 and 6 during the past 10 reporting periods.
Figure FAC.7: Full-time-equivalent health care providers, by service setting, state and territory specialised mental health service units, 1992–93 to 2021–22
Line graph showing full-time-equivalent health care providers per 100,000 population, state and territory specialised mental health service units, by service setting from 1993–94 to 2021–22, with the option to display data from 2012–13 to 2021–22. Over the past 30 years, the rate was consistently highest for hospital admitted patient service settings, ranging between 45 (in 2000–01) and 58 (in 2021–22). The rate was consistently second highest for community mental health care service settings, which increased from 19 in 1992–1993 to 51 in 2021–22. The rate for residential mental health care service settings increased from 4 in 1992–93 to 10 in 2021–22. The organisational overhead setting has been reported since 2012–13, with a rate ranging from 4 in 2012–13 to 6 in 2021–22. Refer to Table FAC.43.
Note: Australian Capital Territory data for 2021–22 was not available at the time of publication. Updated data for ACT will be published when available. National total calculations for 2021–22 do not include ACT data. Caution should be exercised when conducting time series analyses.
Source: Specialised mental health care facilities tables FAC.43
National Mental Health Establishments Database
Collection of data for the Mental Health Establishments (MHE) NMDS began on 1 July 2005, replacing the Community Mental Health Establishments NMDS and the National Survey of Mental Health Services. The development of the MHE NMDS was to expand on the Community Mental Health Establishments NMDS and replicate the data previously collected by the National Survey of Mental Health Services. The National Mental Health Establishments Database is compiled as specified by the MHE NMDS.
The scope of the MHE NMDS is all specialised mental health services managed or funded, partially or fully, by state or territory health authorities. Specialised mental health services are those with the primary function of providing treatment, rehabilitation or community health support targeted towards people with a mental disorder or psychiatric disability. These activities are delivered from a service or facility that is readily identifiable as both specialised and serving a mental health care function.
The MHE NMDS data are provided at several levels: state, regional, organisational and individual mental health service unit. The data elements at each level in the NMDS collect information appropriate to that level. The state, regional and organisational levels include data elements for revenue, grants to non-government organisations and indirect expenditure. The organisational level also includes data elements for salary and non-salary expenditure, numbers of full-time-equivalent staff and consumer and carer worker participation arrangements. The individual mental health service unit level comprises data elements that describe the function of the unit. Where applicable, these include target population, program type, number of beds, number of accrued patient days, number of separations, and number of service contacts and episodes of residential care. In addition, the service unit level also includes salary and non-salary expenditure and depreciation.
Data Quality Statements for National Minimum Data Sets (NMDSs) are published annually on the Metadata Online Registry (METEOR). Statements provide information on the institutional environment, timelines, accessibility, interpretability, relevance, accuracy, and coherence.
Data validation
Data presented in this publication are the most current data for all years presented. The validation process assesses the data for consistency in the current collection and across historical data. The validation process applies a range of rules to the data to test for potential issues. Jurisdictional representatives respond to each issue before the data are accepted as the most reliable current data collection. This process may highlight issues with historical data. In such cases, historical data may be adjusted to ensure data are more consistent. Therefore, comparisons made to previous versions of the Mental health online report(previously referred to as Mental health services in Australia)publications should be approached with caution.
Mental health consumer and carer workforce data
Consumer worker and carer worker FTE is relatively small, and therefore small changes in these FTE may have a relatively large percentage impact on the rates of change. Additionally, the definition used to describe this component of the workforce changed for the 2010–11 collection to better capture a variety of contemporary roles. Caution is therefore required when interpreting time series data for this workforce. More information can be found in the key concepts.
Consumer committee representation arrangements
Specialised mental health organisations report the extent to which consumer participation arrangements are in place to promote the inclusion of mental health consumers in the planning, delivery, and evaluation of the service. Organisations report their consumer participation arrangements at various levels, as detailed below.
Level | Description |
|---|---|
Level 1 | Formal position(s) for consumers exist on the organisation’s management committee for the appointment of person(s) to represent the interests of consumers. Alternatively, specific consumer advisory committee(s) exists to advise on all relevant mental health services managed by the organisation. |
Level 2 | Specific consumer advisory committee(s) exists to advise on some but not all relevant mental health services managed by the organisation. |
Level 3 | Consumers participate on a broadly based advisory committee that includes a mixture of organisations and groups representing a wide range of interests. |
Level 4 | Consumers are not represented on any advisory committee but are encouraged to meet with senior representatives of the organisation as required. Alternatively, no specific arrangements exist for consumer participation in planning and evaluation of services. |
National standards for mental health services review status
There are 8 levels used to describe the extent to which a service unit has implemented the National Standards, as shown in the table below.
Level | Description |
|---|---|
1 | The service unit had been reviewed by an external accreditation agency and was judged to have met the National standards as determined by the accrediting agency. |
2 | The service unit had been reviewed by an external accrediting agency and was judged to have met some but not all of the National standards. |
3 | The service unit was in the process of being reviewed by an external accrediting agency but the outcomes were not known. |
4 | The service unit was booked for review by an external accrediting agency and was engaged in self‑assessment preparation prior to the formal external review. |
5 | The service unit was engaged in self‑assessment in relation to the National standards but did not have a contractual arrangement with an external accrediting agency for review. |
6 | The service unit had not commenced the preparations for review by an external accrediting agency but this was intended to be undertaken in the future. |
7 | It had not been resolved whether the service unit would undertake review by an external accrediting agency under the National standards. |
8 | The National standards are not applicable to this service unit. |
Source: National Standards for Mental Health Services status (see METEOR ID: 573549).
Reporting levels for national standards
To match definitions in the National Key Performance Indicator set for Mental Health Services, the data presented are restricted to 4 levels. Level 1 represents code 1, Level 2 represents code 2, Level 3 represents codes 3 and 4 and Level 4 represents codes 5–7. Code 8 is excluded as the standards do not apply to these units.
To accurately reflect the proportion of mental health services meeting the various National Standards levels, the expenditure reported for each service unit is used to calculate the proportion of services which meets the National Standards. This ensures the relative size of a service unit is accounted for when calculating the proportion of services meeting National Standards. It is important to note that the accreditation process is cyclical in nature and so state and territory results may vary from year to year.
The National Standards for Mental Health Services were revised in 2010 (Department of Health and Ageing 2010). In addition to these mental health-specific national standards, other national standards have been published and implemented against which mental health services may also be measured. Work is ongoing to improve the method for reporting the standards against which a service is measured.
In 2021–22, more than 9 in 10 (94%) service units reviewed by an external accreditation agency, such as the Australian Council on Healthcare Standards (ACHS) or the Quality Improvement Council (QIC), met the National Standards (Level 1). South Australia and Queensland reported 100% of units meet Level 1 and Western Australia reported 99% of units meet Level 1. The Northern Territory reported that all units were assessed under service accreditation standards that do not include certification for the National Standards, therefore it has reported 100% of units meet Level 4. From 2017–18, services in the Australian Capital Territory have been accredited against the National Safety and Quality Health Service (NSQHS) Standards, which meet some but not all of the National Standards.
New South Wales CADE and T-BASIS services
All New South Wales Confused and Disturbed Elderly (CADE) 24-hour staffed residential mental health care services were reclassified as specialised mental health non-acute admitted patient hospital services, termed Transitional Behavioural Assessment and Intervention Service (T-BASIS), from 1 July 2007. All data relating to these services have been re-classified from 2007–08 onwards, including number of services, number of beds, staffing and expenditure. Comparison of data over time should therefore be approached with caution.
New South Wales Mental Health Community Living Programs
New South Wales has been developing the NSW Housing Accommodation Support Initiative (HASI) since it was established in 2002. This model of care is a partnership program between NSW Ministry of Health, Housing NSW and the non-government organisation (NGO) sector that provides housing linked to clinical and psychosocial rehabilitation services for people with a range of levels of psychiatric disability.
In 2016, Community Living Supports (CLS) commenced to support more people with severe mental illness to access the same type of support provided in HASI.
From 2017–18 New South Wales supported housing places reflect changes resulting from the conclusion of the Commonwealth National Partnership Agreement (NPA) on Mental Health Services. The NSW Government continued funding until Dec 2017 to allow for transition to alternative support arrangements (including the NDIS) for up to 200 people in NPA funded supported housing places.
Both HASI and CLS are reported as Specialised mental health service–supported mental health housing places (METEOR identifier 390929). These programs are out of scope as Residential mental health care services (METEOR identifier 373049). More information about the NSW HASI program can be accessed from the above hyperlink.
Public sector specialised mental health beds
In 2017–18, Queensland reported specialised residential mental health service beds to the Mental Health Establishments collection for the first time due to the reclassification of some public sector mental health hospital beds.
Organisational overhead setting
In 2012–13, the organisational overhead setting was introduced for greater national consistency in reporting and greater clarity about staff delivering care to patients. The organisational overhead setting consists of the components of specialised mental health service organisations not directly involved in the delivery of patient care services in the admitted patient, residential or community mental health care service settings, or in the operations of those settings. The definition does not imply that these roles do not have an impact on service delivery. For example, a chief operating officer not directly providing patient care, nor involved in the operation of services in a specific service setting, would be reported in the organisational overhead setting. The reporting methodology for the new organisational overhead setting is taking time for states and territories to implement (see Table FAC.39 for detailed time series data).
Rate calculations
Calculations of rates for target populations are based on age-specific populations as defined by the MHE NMDS metadata and outlined below.
- General services: persons aged 18–64
- Child and adolescent services: persons aged 0–17
- Youth services: persons aged 16–24
- Older persons: persons aged 65 and over
- Forensic services: persons aged 18 and over
Crude rates were calculated using the Australian Bureau of Statistics estimated resident population (ERP) at the midpoint of the data range (for example, rates for 2021–22 data were calculated using ERP at 31 December 2021). Historical rates have been recalculated using revised ERPs based on the 2011 Census of Population and Housing, as detailed in the online technical information.
Private health reporting
Private hospital specialised mental health services staffing
Data for staffing provided in private hospital specialised mental health services are no longer available. These data were previously provided by the Australian Bureau of Statistics through its Private Hospitals Establishment Collection (PHEC), but this survey was discontinued in 2016–17.
Private Health Establishments Collection
From 1992–93 to 2016–17 (excluding 2007–08) the ABS conducted a census of all private hospitals licensed by state and territory health authorities and all freestanding day hospitals facilities approved by the Australian Government Department of Health and Aged Care. As part of that census, data on the staffing, finances and activity of these establishments were collected and compiled in the PHEC. Additional information on the PHEC can be obtained from the ABS publication Private hospitals, Australia (ABS 2018). The data definitions used in the PHEC are largely based on definitions in the National health data dictionary (NHDD) published on the AIHW’s Metadata Online Registry (METEOR) website (AIHW 2015). The ABS defines private psychiatric hospitals as those licensed or approved by a state or territory health authority and which cater primarily for admitted patients with psychiatric, mental or behavioural disorders (ABS 2018). This is further defined as those hospitals providing 50% or more of the total patient days for psychiatric patients. This definition can be extended to include specialised units or wards in private hospitals, consistent with the approach in the public sector. For further technical information, see the Private psychiatric hospital data section of the National mental health report 2013 (Department of Health and Ageing 2013).
The last data were collected for the 2016–17 period. Increases in psychiatric beds were the result of improvements in methodology to apportion the data between psychiatric and alcohol/drug treatment wards, new establishments reporting for the first time, and a general increase in psychiatric beds in establishments that have reported psychiatric units in the past. Caution is required when comparing data for 2010–11 to other years as the survey was altered such that psychiatric units could no longer be separately identified from alcohol/drug treatment units. Therefore, the data for beds, patient days, separations and staffing were estimates based on reported 2010–11 data and trends observed in previous years. Data from the Private Mental Health collection suggest that these data may be underestimates (PMHA 2013).
Private Psychiatric Hospitals Data Reporting and Analysis Service
The Australian Private Hospitals Association Private Psychiatric Hospitals Data Reporting and Analysis Service (PPHDRAS), previously known as the Private Mental Health Alliance Centralised Data Management Service (PMHA CDMS), was launched in Australia in 2001 to support private hospitals with psychiatric beds to routinely collect and report on a nationally agreed suite of clinical measures and related data for the purposes of monitoring, evaluating and improving the quality of and effectiveness of care. The PPHDRAS works closely with private hospitals, health insurers and other funders (e.g., Department of Veterans’ Affairs) to provide a detailed quarterly statistical reporting service on participating hospitals’ service provision and patient outcomes.
The PPHDRAS fulfils 2 main objectives. Firstly, it assists participating private hospitals with implementation of their National Model for the Collection and Analysis of a Minimum Data Set with Outcome Measures. Secondly, the PPHDRAS provides hospitals and private health funds with a data management service that routinely prepares and distributes standard reports to assist them in the monitoring and evaluation of health care quality. The PPHDRAS also maintains training resources for hospitals and a database application, which enables hospitals to submit de-identified data to the PPHDRAS. The PPHDRAS produces an annual statistical report. In 2020-21, the PPHDRAS accounted for 98% of all private psychiatric beds in Australia (APHA 2022)
From 2017–18, all private hospital data are sourced from the PPHDRAS. Data on expenditure and Staffing (FTE) are not collected in the PPHDRAS.
Residential mental health service beds
In the Australian Capital Territory, from 2015–16 to 2016–17 there was a decline in the reported number of non-24 hour staffed residential beds, from 45 to 5 beds. These beds are still operational but as they are funded under the National Disability Insurance Scheme (NDIS), they are now out of scope for reporting to the Mental Health Establishments (MHE) NMDS. Since the implementation of the NDIS there has been a decrease in the number of non-24-hour staffed residential specialised beds reported to the MHE NMDS.
ABS (Australian Bureau of Statistics) (2018) Private hospitals, Australia, 2016–17, ABS Cat. no. 4390.0, ABS, Australian Government.
AIHW (Australian Institute of Health and Welfare) (2015) National Health Data Dictionary 2012 version 16.2. Cat. no. HWI 131, AIHW website, accessed 30 January 2024.
AIHW (2023) Aboriginal and Torres Strait Islander-specific primary health care: results from the OSR and nKPI collections, Cat. no. IHW 227, AIHW website, accessed 30 January 2024.
APHA (Australian Private Hospitals Association) (2022) Private Hospital-based Psychiatric Services 1 July 2021 to 30 June 2022, APHA website, accessed 30 January 2024.
Department of Health and Aged Care (2010) National Standards for Mental Health Services, Department of Health and Aged Care website, accessed 30 January 2024.
Department of Health and Aged Care (2013) National mental health report: tracking progress of mental health reform in Australia, 1993–2011, Department of Health and Aged Care, Australian Government.
PMHA (Private Mental Health Alliance) (2013) Private Hospital-based Psychiatric Services 1 July 2011 to 30 June 2012: PMHA-CDMS annual statistical report for the 2011–2012, Private Mental Health Alliance.
Data coverage includes the time period 1992–93 to 2021–22. This section was last updated in February 2024.


