Community mental health care services
Infographic containing 3 key points from this page. An estimated 9.6 million service contacts were provided to nearly 468,800 patients in 2021-22. Mental disorder not otherwise specified (26%) was the most frequently recorded principal diagnosis, followed by Schizophrenia (21%) and the rate of service contacts was higher for females aged 12-17 than males.

Summary
Mental illness is often treated in specialised community and hospital-based outpatient psychiatric services provided by state and territory governments. Collectively, these services are referred to as specialised community mental health care (CMHC) services.
State and territory health authorities collect a core set of information for the Community Mental Health Care National Minimum Data Set (CMHC NMDS), which is compiled annually into the National Community Mental Health Care Database (NCMHCD). Data from the NCMHCD are used to describe the care provided by these services. More information about the NCMHCD is available in the data source section.
For information on involuntary mental health legal status in community mental health care services refer to Involuntary treatment in mental health care of this web report.
Spotlight data: Community mental health care services in Australia by location, 2005–06 to 2021–22
Infographic containing a map of Australia showing community mental health services by location, estimated number of patients, and principal diagnosis in community mental health care in Australia for the years 2005–06 to 2020–21.
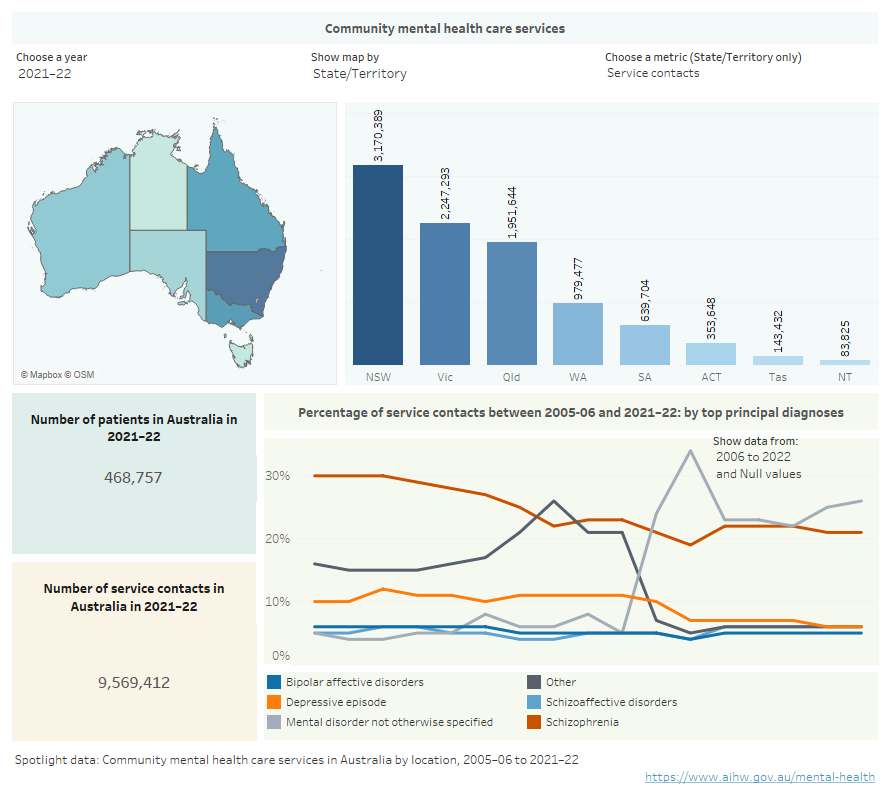
Where were services provided?
Around 9.6 million service contacts were provided by CMHC services to nearly 468,800 patients in 2021–22. This equates to an average of about 20 per patient.
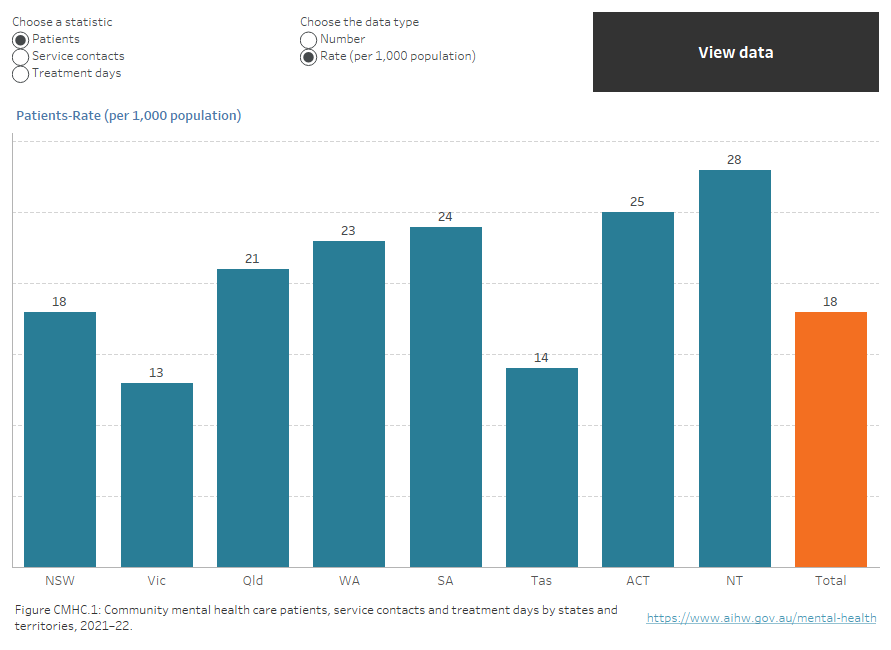
The national average rate of patients receiving services was 18 patients per 1,000 population. The rate was highest in the Northern Territory (28) (Figure CMHC.1). Differences in jurisdictional data reporting systems and health system organisation and delivery models may contribute to the observed variation in rates.
Figure CMHC.1: Community mental health care patients, service contacts and treatment days by states and territories, 2021–22
Interactive vertical bar chart showing the number of community mental health care patients, service contacts and treatment days as well as the rate of contacts and patients (rate per 1,000 population) for states and territories in 2021–22. New South Wales had the highest number of patients (142,642), followed by Queensland (108,872), Victoria (84,831), Western Australia (63,451), South Australia (42,945), the Australian Capital Territory (11,220), Tasmania (7,866) and the Northern Territory (6,930). The Northern Territory reported the highest rate (28 patients per 1,000 population) followed by the Australian Capital Territory (25), South Australia (24), Western Australia (23), Queensland (21), New South Wales (18), Tasmania (14), and Victoria (13). The national rate of community mental health care patients was 18 per 1,000 population (refer to Table CMHC.1).
Note: Community mental health care treatment days is only reported as a number.
Source: Table CMHC.1.
Who received services?
In 2021–22, just over half of CMHC patients were females (54%). Females accessed services at a higher rate than males (375 and 358 service contacts per 1,000 population respectively). People aged 12–17 years accounted for the highest rate of both patients (37) and service contacts (703), with females aged 12–17 years accounting for a higher rate of service contacts than males (1,036 and 379 respectively).
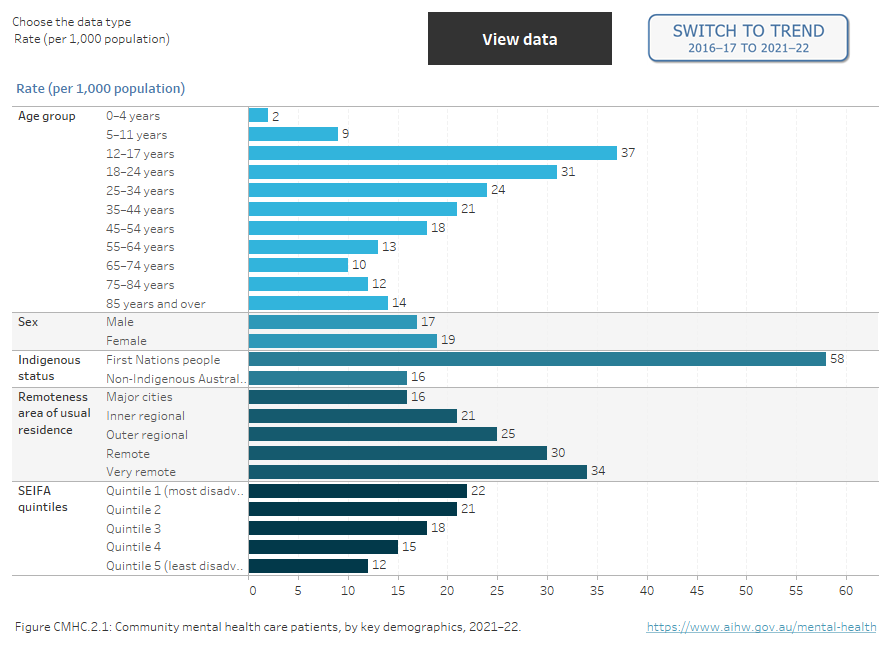
People living in Major cities made up the majority of CMHC patients (64%) and people living in Very remote areas made up the smallest proportion (1%). However, the population adjusted rate of patients was highest for people living in Very remote areas (34 patients per 1,000 population), while people living in Major cities has the lowest rate (16).
Aboriginal and Torres Strait Islander (First Nations) people comprised 11% of CMHC patients in 2021–22, and the rate per 1,000 population was more than 3 times that of non‑Indigenous patients (58 and 16 respectively) (Figure CMHC.2).
Figure CMHC.2: Community mental health care patients, by key demographics, 2005–06 to 2021–22
Two interactive charts. A horizontal bar chart showing the rate (per 1,000 population), per cent or number of community mental health care patients by demographic variables of age, sex, First Nations status, SEIFA quintile and remoteness area in 2021–22. The lowest rate for patients by age was seen for those aged 0–4 years (2 people per 1,000 age specific population) and the highest rate was for patients aged 12–17 years (37). Male and female patients had similar rates per 1,000 population (17 and 19 respectively). The highest rate of patients per 1,000 population by remoteness area was seen for patients living in Very remote areas (34), followed by Remote (30), Outer regional (25), Inner regional (21), and lowest for Major cities (16). The rate of patients per 1,000 population living in SEIFA Quintile 1 (most disadvantaged) was the highest of all quintiles (22), which decreased to 12 for Quintile 5 (least disadvantaged) (refer to Table CMHC.8). Figure 2 is a time series of community service contacts by patient demographics from 2005–06 to 2021–22 (refer to Table CMHC.7).
Note: Age-standardised rate is shown for First Nations people.
Source: Tables CMHC.8 and CMHC.7.
What was the most common principal diagnosis?
In 2021–22, a principal diagnosis was reported for more than 4 out of 5 (more than 7.8 million) CMHC service contacts. Mental disorder not otherwise specified was the most frequently recorded mental health-related principal diagnosis for service contacts (26%). This diagnosis may be used when a patient presents to a service for care but further investigation is required by clinical staff to make a formal diagnosis. This was followed by:
- Schizophrenia (21%)
- Depressive episode (6%)
- Schizoaffective disorders (6%)
- Reaction to severe stress and adjustment disorders (5%)
- Specific personality disorders (5%) and
- Bipolar affective disorders (5%).
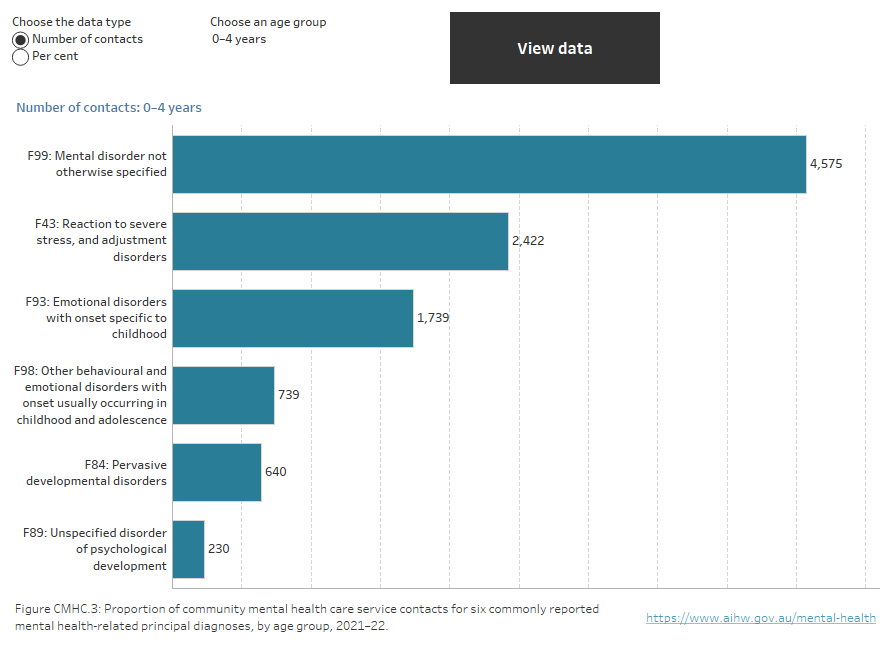
There was variation across age groups when looking at the most frequently recorded principal diagnosis for service contacts (Figure CMHC.3). Younger age groups (aged up to 34) and older age groups (aged 65 years and over) most frequently recorded Mental disorder not otherwise specified, while those aged 35–64 years most frequently recorded Schizophrenia.
Figure CMHC.3: Proportion of community mental health care service contacts for six commonly reported mental health-related principal diagnoses, by age group, 2021–22
Interactive horizontal bar chart showing 6 commonly reported specific principal diagnosis for community mental health care service contacts in 2021–22 by age group. The most frequently reported principal diagnosis for those aged 0–4 years, 5–11, 12–17, 18–24, 25–34, 65–74, 75–84 and 85 and over was Mental disorder not otherwise specified (26%, 29%, 27%, 28%, 28%, 23%, 23% and 26% respectively). For older ages, Schizophrenia was the most frequently reported principal diagnosis, ranging from 29% for those aged 55–64 to 32% for those aged 45–54 years.
Source: Table CMHC.17.
Changes over time
In 2005–06, almost 5.7 million CMHC service contacts took place across Australia (279 per 1,000 population) increasing to around 9.6 million (371) in 2021–22.
Across Australia in 2021–22 the rate of service contacts was 371 per 1,000 population and the rate of patients was 18. The national rate of service contacts decreased between 2017–18 and 2021–22 (384 to 371) and remained stable at 18 for patients; likely reflecting changes in health service delivery during the COVID-19 pandemic. In this 5–year period, the average annual change for the rate of service contacts showed a decrease of about 1%. The rate of community patients showed an average annual increase of the same proportion. The annual change over this time period varied across jurisdictions.
The Australian Capital Territory showed the largest increase in the rate of service contacts between 2017–18 and 2021–22 (from 754 to 780) and had the highest rate of service contacts in 2021–22.
Treatment periods
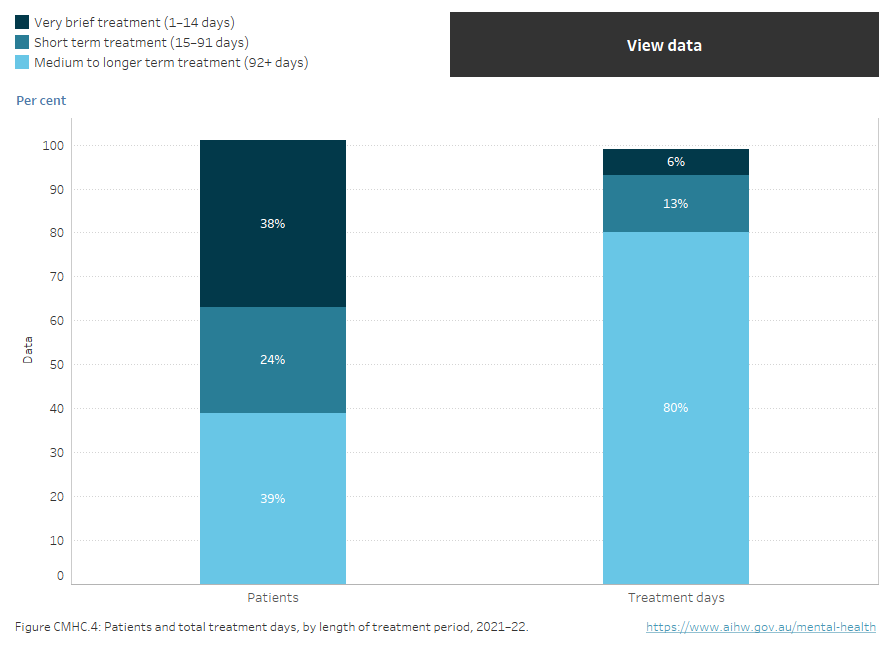
Nearly 2 in 5 registered patients (39%) had a length of treatment of 92 days or more (the time between their first and last service contact during the reporting period) in 2021–22.
These patients received the highest proportion of treatment days (80%) from CMHC services (Figure CMHC.4).
Figure CMHC.4: Patients and total treatment days, by length of treatment period, 2021–22
Stacked vertical bar chart showing length of treatment period and the proportion of patients that received different lengths of treatment. 38% of patients received very brief treatment (1–14 days), 24% received short term treatment (15–91 days) and 39% received medium to longer term treatment (92+ days). 6% reported treatment days were very brief, 13% were short term treatment and 80% were medium to longer term treatment (refer to table CMHC.24).
Source: Table CMHC.24.
Characteristics of service contacts
CMHC service contacts can be conducted as either individual or group sessions and can also be face-to-face, via telephone, or using other forms of direct communication such as video link. They can be conducted in the presence of the patient, with a third party (such as a carer or family member) and/or other professionals or mental health workers.
The vast majority of service contacts reported in 2021–22 were individual contact sessions (96%) with 1 in 25 being group sessions. Just over half of all contacts were individual sessions (53%), where the patient participated in the service contact (termed patient present).
Services targeted toward the General population made up 69% of all services. Services targeted towards Forensic, Older person, and Youth populations accounted for smaller proportions of treatment days than the General population and Child and adolescent services. These results largely mirror the relative size (as measured by the number of full-time-equivalent staff) for each of the CMHC service target population categories, with the exception of Older person and Child and adolescent which both make up 11% (Specialised mental health care facilities section, Table FAC.41).
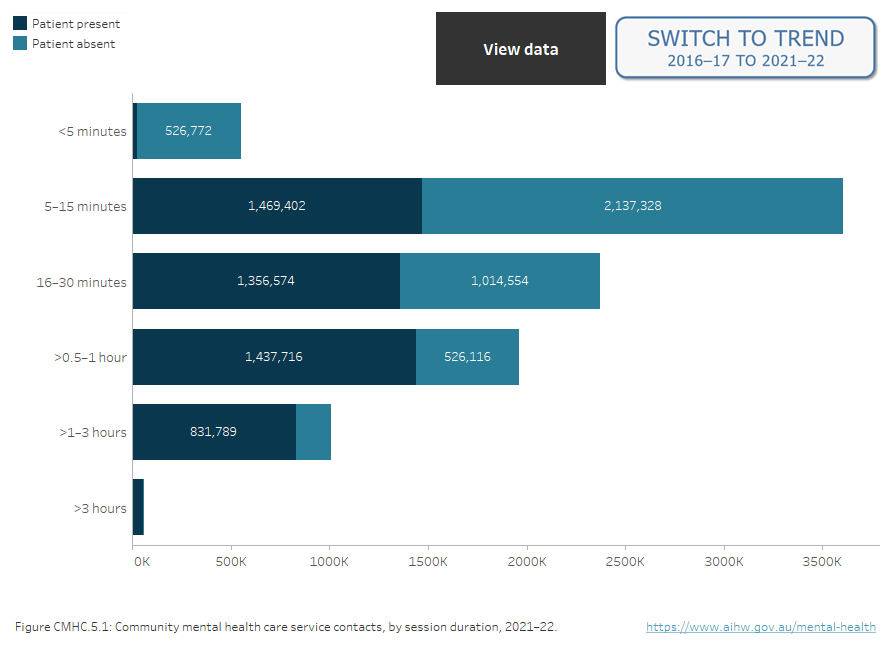
The duration of CMHC service contacts ranges from less than 5 minutes to over 3 hours. In 2021–22, the average service contact duration of sessions was 34 minutes. Nearly 2 in 5 contacts were 5–15 minutes (38%) and almost 1 in 4 contacts were 16–30 minutes (25%) (Figure CMHC.5). Service contacts with the patient present were on average twice as long as those where the patient was absent (average 44 and 22 minutes respectively).
Of the 5 commonly reported principal diagnoses, Reaction to severe stress and adjustment disorders had the highest proportion of contacts lasting over 1 hour (13%, Table CMHC.22).
Figure CMHC.5: Community mental health care service contacts, by session duration, 2005–06 to 2021–22
Two interactive charts. A stacked horizontal bar chart showing the duration of community mental health care service contacts by session duration and patient participation status in 2021–22. The most frequent contact duration was 5–15 minutes (38%), followed by 16–30 minutes (25%), >0.5–1 hour (21%), >1–3 hours (11%), <5 minutes (6%), and >3 hours (1%). 54% of contacts occurred with the patient present (5.2 million) and 46% occurred with the patient absent (4.4 million). Contacts lasting more than 3 hours were more likely to occur with the patient present than without the patient (1% and 0.2% respectively), while contacts lasting less than 5 minutes were more likely to occur without the patient than with the patient (12% and 1% respectively) (refer to Table CMHC.21). Figure 2 is a time series of service contacts by session duration from 2005–06 to 2021–22 (refer to Table CMHC.23).
Figure CMHC 5.2, time series of service contacts by session duration can be found on the Mental health site.
Source: Tables CMHC.21 and CMHC.23.
National Community Mental Health Care Database
State and territory health authorities collect a core set of information for the Community Mental Health Care National Minimum Data Set (CMHC NMDS), which is compiled annually into the National Community Mental Health Care Database (NCMHCD). The statistical counting unit used in the NCMHCD is a service contact between either a patient or a third party and a specialised community mental health care (CMHC) service provider.
Data quality over time
Differences in jurisdictional data reporting systems, reduced data coverage or under-reporting of service contacts may contribute to variation in service contact rates. Staff industrial action has resulted in a substantial reduction in data coverage for 2 jurisdictions in previous years: Victoria (2011–12, 2012–13, 2015–16 and 2016–17) and Tasmania (2011–12, 2012–13 and 2018–19). New South Wales and the Northern Territory also reported reduced data coverage for 2016–17, 2017–18 and 2018–19. The observed reductions in both service contact and patient numbers are considered to be primarily due to these missing data. Consequently, long term trends in the total number of service contacts are not available. Further information on data coverage can be found in the CMHC NMDS Data Quality Statement.
Data Quality Statements for National Minimum Data Sets (NMDSs) are published annually in AIHW’s Metadata Online Registry (METEOR). These statements provide information on the environment, timelines, accessibility, interpretability, relevance, accuracy and coherence of the data collection. Visit the Community mental health care NMDS 2021–22: National Community Care Database, 2023 Quality Statement. Data quality statements for previous years are also accessible in METEOR.
The footnotes in each of the accompanying MS Excel tables contain details about the calculation of national rates over time.
Patient count
The number of unique patients provided with service contacts can be derived from the NCMHCD. However, the patient count is limited to people registered with state and territory community mental health care systems that have a unique person identifier; a person has one identifier across all individual service providers within a state or territory. The ability of jurisdictions to generate unique person identifiers varies as described in the Data Quality Statement for the CMHC NMDS.
Data coverage includes the time period 2005–06 to 2021–22. Data in this section were last updated in December 2023.


