Admitted patients mental health-related care
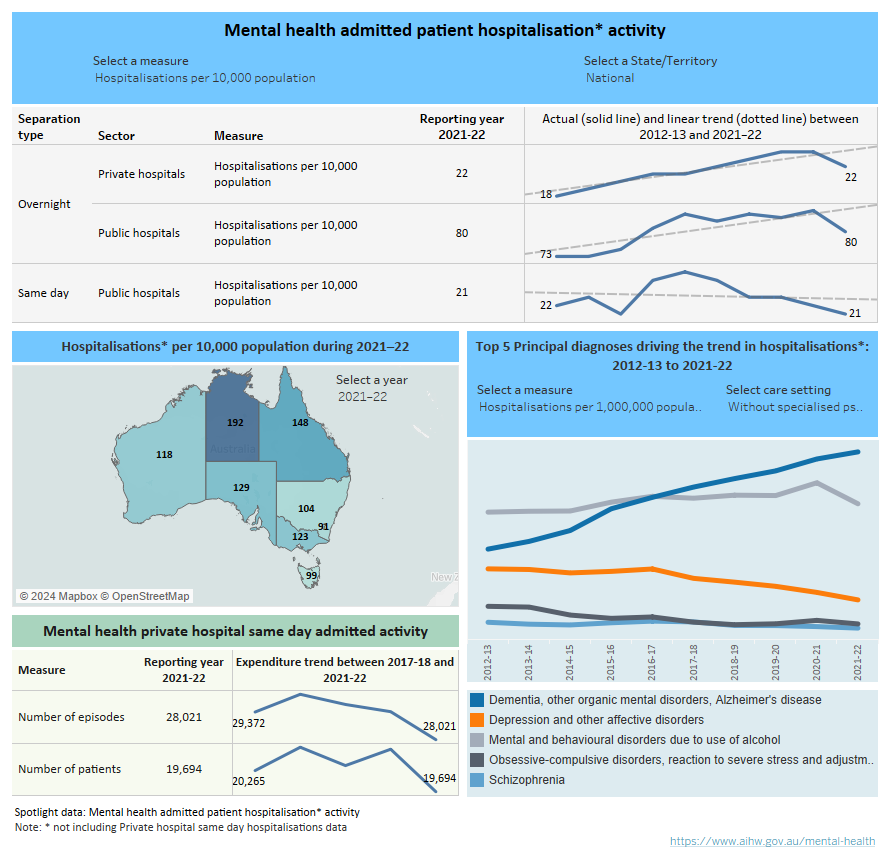
Spotlight data summarising admitted patient mental health-related hospitalisation activity. A series of line graphs all summarise various data in numbers and rates (per 10,000 population) by separation type (same day and overnight) and sector (public or private hospital) including observed and expected trend from 2012–13 to 2021–22 which can be filtered per state and territory or at the national level. Another figure summarises state and territory jurisdiction hospitalisation rates (per 10,000 population) which can be filtered by year between 2012–13 to 2021–22. Another line graph summarises the observed time series trends for number of episodes and number of patients for same day admitted activity in private hospitals from 2017–18 to 2021–22. The last line graph shows the top 5 principal diagnoses by hospitalisations and rates (per 1,000,000 population) by care setting from 2012–13 to 2021–22.
Introduction
Some people’s mental health needs require accessing care in a hospital setting such as a hospital ward, an emergency department and/or an outpatient clinic. This report presents information on admitted patient (those who undergo a hospital’s formal admission process) mental health-related hospitalisations from Australian public and private hospitals. When receiving mental health hospital care, a patient may be admitted to hospital for part of a day (same day admitted mental health care), or for one or more overnight stays (overnight admitted patient care).
Patients can receive specialised psychiatric care in a psychiatric hospital or in a hospital’s psychiatric unit. Patients with mental illness may also be admitted to other areas of the hospital for medical and/or surgical care, or a general ward in a hospital without a specialised psychiatric unit, where health care workers may or may not be specifically trained to care for the mentally ill. These admissions to hospitals are classified as being without specialised psychiatric care. Throughout this report, with or without specialised psychiatric care are referred to as care settings. Definitions of any key concepts can be found in the key concepts section. Further detail can be found in the data source section.
Hospitalisations
Stays in public hospitals with specialised psychiatric care take place in either acute or psychiatric hospitals. Throughout this report, these two sector types have been combined because the number of standalone psychiatric hospitals has reduced in recent years. Table AC.2 in the data downloads has a breakdown of public acute and psychiatric hospitals.
Private hospital-based same day admitted mental health care is provided in either private hospitals with psychiatric beds or private psychiatric day hospitals (APHA 2023). Further detail can be found in the data source section.
To provide the most comprehensive view of admitted mental health-related care, two different data sources are used for private hospitals. When considering the data presented in this report it should be noted that some activity reported as same day admitted care in the private hospital data may be reported in the public sector data as community mental health care, due to differences in the organisational structure and classification criteria between the public and private sectors. As such, any comparisons of the volume of care provided by public and private hospitals described in this report should be made with caution. Further information can be found in the data source section.
Data for overnight private hospital, and same day and overnight public hospitals admissions are reported as either hospitalisations (separations) or procedures. Whereas data for same day private hospital admissions are reported as either patients or episodes (More information can be found in the data source section).
Rates for age groups, sex, jurisdictions, remoteness area of usual residence, and SEIFA quintiles are crude rates, while age standardised rates were used for First Nations people in this report.
There were about 52,130 same day mental health-related hospitalisations, of which about 28% included specialised psychiatric care, and about 40,160 procedures were provided.
There were about 205,220 overnight mental health-related hospitalisations, of which about 56% included specialised psychiatric care. The average length of stay was 14 days and about 458,150 procedures were provided. There were more than 2.9 million patient days and more than 2.2 million psychiatric care days.
For private psychiatric hospitals, there were about 19,690 patients who received a same day hospital stay (Spotlight data).
There were about 57,020 overnight mental health-related hospitalisations, of which about 83% included specialised psychiatric care. The average length of stay was 18 days and about 232,540 procedures were provided. There were more than 1 million patient days and almost 900,000 psychiatric care days.
Rates were steady for same day public mental health-related hospitalisations, with an average rate of 23 (per 10,000 population). In 2021–22, the national rate for same day private hospitals was 8 patients (per 10,000 population).
There was a slight upward trend for public overnight hospitalisation rates from 2012–13 to 2016–17. After a decrease in 2017–18 (more information can be found in the data source section), hospitalisations then increased again until 2020–21 (rate of 86 in 2020–21 and 80 in 2021–22) (Spotlight data). Across 2012–13 and 2021–22, there was an average rate of 81. Rates were steady for overnight private hospital stays, with an average of 21.
Patient demographics
Rates of mental health-related hospitalisations over the last 10 years varied by age, sex, First Nations status, state and territory, remoteness area of usual residence, and socio-economic status area of usual residence.
These differences may be due to a range of factors including differential access to hospital-based mental health services and the prevalence and impact of mental illness across demographic groups.
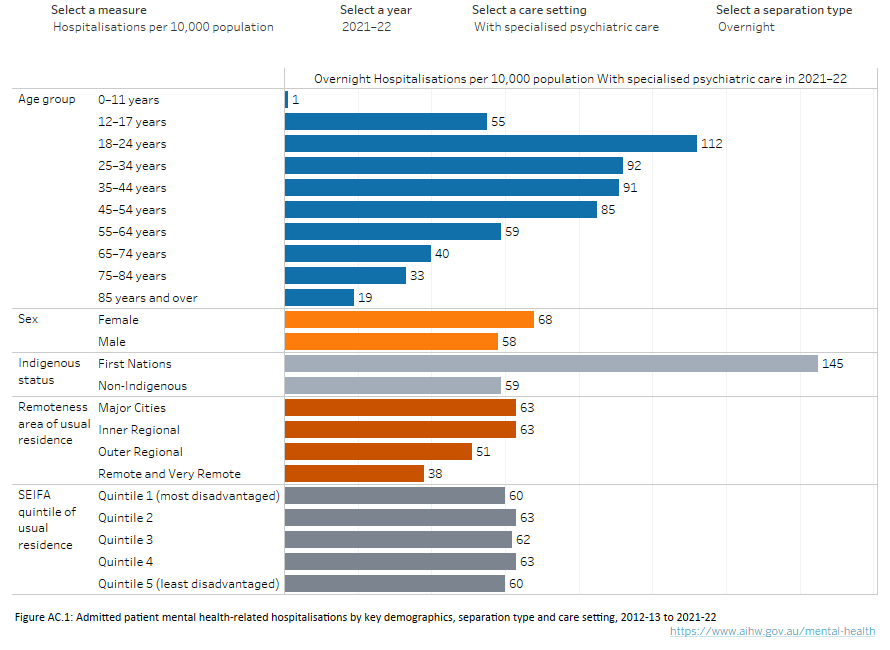
Figure AC.1: Admitted patient mental health-related hospitalisations by key demographics, separation type and care setting 2012–13 to 2021–22
Five bar charts showing age group, sex, Indigenous status, remoteness area of usual residence, and SEIFA quintile of usual residence from 2012–13 to 2021–22. Data can be displayed by hospitalisation numbers, age standardised hospitalisation rates (per 10,000 population), or hospitalisation rates (per 10,000 population), care setting (with or without specialised psychiatric care), and by separation type (same day and overnight). Data summaries listed below.
Source: Admitted patients mental health-related care tables: Tables AC.3 and AC.5
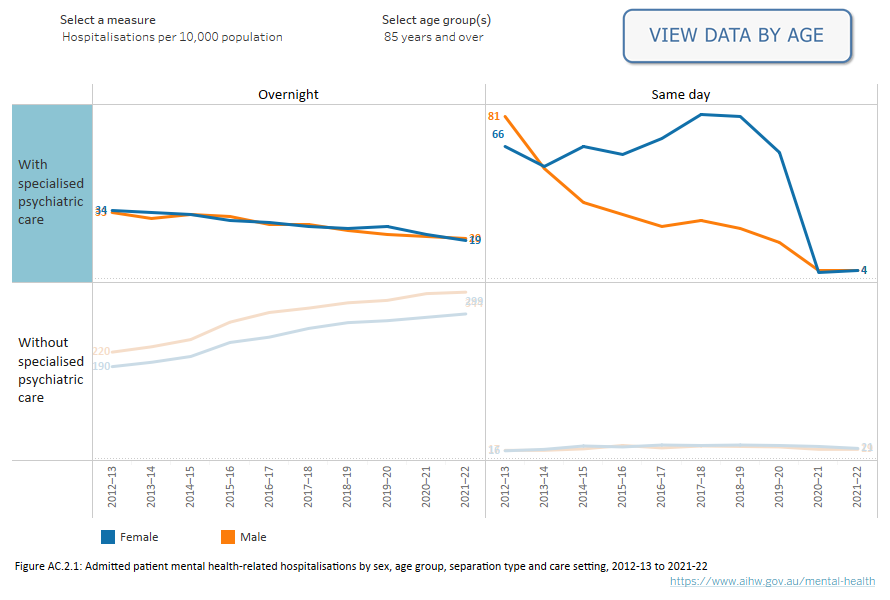
Between 2012–13 and 2021–22, hospitalisation rates (per 10,000 population) were generally highest for females aged 12 –24 and 65 years and over (except for overnight public and private combined), and for people aged 85 years and older (Figure AC.2.1). Between 2017–18 and 2021–22, patient rates for same day hospitalisations in private hospitals were higher for females across all age groups, except for 0–11 years.
In 2021–22, females aged 18–24 had the highest hospitalisation rates for same day public stays with specialised psychiatric care (18, compared with 8 for males), and females aged 18–24 and 75–84 had the highest rates for without specialised psychiatric care (24 for both age groups, compared with 17 and 16 for males respectively). Females aged 18–24 also had the highest hospitalisations for overnight public and private combined withspecialised psychiatric care (140, compared with 84 for males) (Figure AC.2.2).
For same day public hospital admissions, both males and females across all age groups (except for females aged 12–17) had lower rates of withspecialised psychiatric care than without.
For overnight hospitalisation rates across both hospital sectors (public and private), patients aged 85 years and over had the highest hospitalisation rates without specialised psychiatric care (344 for males and 299 for females). Comparing with and without specialised psychiatric care hospitalisations for overnight (public and private combined) hospitalisations, younger age groups (18–54) had higher rates of with psychiatric care (across the 10 years), while older age groups (75 years and over) had higher rates of without psychiatric care (Figure AC.2.2).
Figure AC.2: Admitted patient mental health-related hospitalisations by sex/age group, separation type and care setting, 2012–13 to 2021–22
Figure AC.2.1: Four line graphs comparing admitted patient mental health-related hospitalisations by age group for sex (males, females, or persons), separation type (same day and overnight), and care setting (with and without specialised psychiatric care) from 2012–13 to 2021–22. Sex and either specific age groups (or all ages) can be selected to display data by hospitalisation numbers or rates (per 10,000 population). Compared to 2020–21, in 2021–22 rates for most age groups decreased for overnight hospitalisations with specialised psychiatric care. Across the decade from 2012–13 to 2020–21, rates for most age groups remained stable for same day hospitalisations with specialised psychiatric care.
Figure AC.2.2: Four line graphs comparing admitted patient mental health-related hospitalisations by age group for sex (males, females, or persons), separation type (same day and overnight), and care setting (with and without specialised psychiatric care) from 2012–13 to 2021–22. Sex and either specific age groups (or all ages) can be selected to display data by hospitalisation numbers or rates (per 10,000 population). Compared to 2020–21, in 2021–22 rates for most age groups decreased for overnight hospitalisations with specialised psychiatric care. Across the decade from 2012–13 to 2020–21, rates for most age groups remained stable for same day hospitalisations with specialised psychiatric care.
Source (both Figures): Admitted patients mental health-related care tables: Table AC.3
The observed differences in hospitalisation rates (per 10,000 population) between Aboriginal and Torres Strait Islander people (First Nations) and non-Indigenous Australians may be due to a range of factors including differences in access to health services.
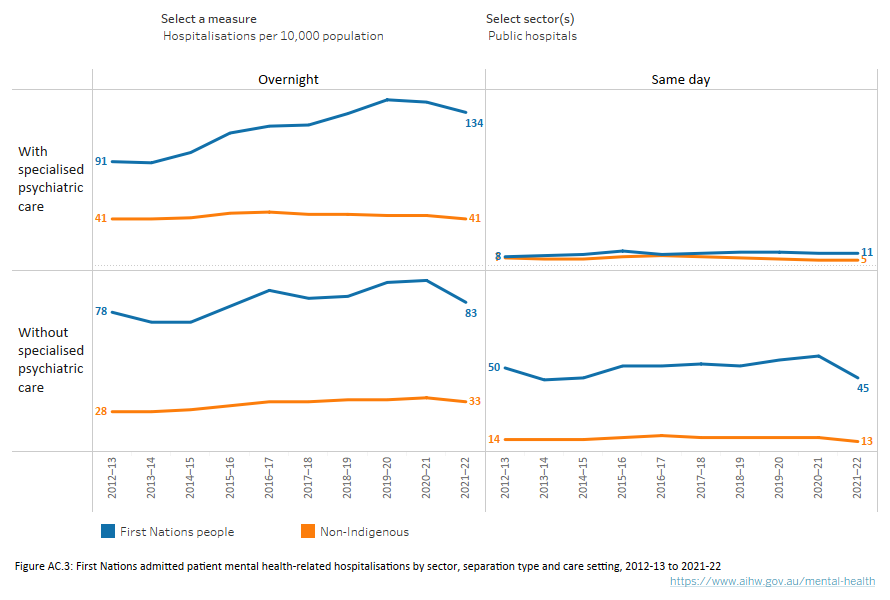
Hospitalisation (age standardised) rates (per 10,000 population) between 2012–13 and 2021–22 show consistently higher rates for First Nations patients compared with non-Indigenous patients, except for overnight private hospital stays where non-Indigenous rates were higher (Figure AC.3).
For First Nations people, public same day hospitalisation (age standardised) rates with specialised psychiatric care increased by 50% and without specialised psychiatric care decreased by 7% between 2012–13 and 2021–22. The public and private (combined) overnight rates with specialised psychiatric care increased by 53% and without specialised psychiatric care marginally increased (from 92 to 103).
For public and private hospitals combined, the difference between overnight hospitalisation rates with specialised psychiatric care for First Nations and non-Indigenous people has widened over time but narrowed in recent years. However, this disparity has slightly decreased for hospitalisations without specialised psychiatric care since 2020–21 (Figure AC.3).
Figure AC.3: First Nations admitted patient mental health-related hospitalisations by sector, separation type and care setting, 2012–13 to 2021–22
Four line graphs comparing admitted patient mental health-related hospitalisations by First Nations status for sector (public, private, or public and private combined), separation type (same day and overnight), and care setting (with and without specialised psychiatric care) from 2012–13 to 2021–22. Aboriginal and Torres Strait Islander people can be compared to non-Indigenous Australians based on sector for hospitalisation numbers, age standardised hospitalisation rates (per 10,000 population), or hospitalisation rates (per 10,000 population). In 2021–22 the difference in age standardised rates between First Nations and non-Indigenous Australians for hospitalisations in public hospitals with specialised psychiatric care was larger for overnight hospitalisations (134 for First Nations people and 41 for non-Indigenous Australians) than for same day hospitalisations (11 for First Nations people and 5 for non-Indigenous Australians).
Source: Admitted patients mental health-related care tables: Table AC.5
In comparing states and territories, it should be noted that models of care and organisational structures differ between jurisdictions and between public and private sectors. This can affect the reported volume of admitted care and the inclusion or omission of some types of care.
Due to the relatively small number of private psychiatric facilities, it is not possible to publish statistics for each state and territory separately. Some aggregation of jurisdictional data has been undertaken in the data tables to address this. The following section excludes same day private hospitalisation data.
During 2019–20 there was a decline in admitted mental health-related care, likely due to the impact of the COVID-19 pandemic on Australia’s hospitals and health care provision from February 2020. In 2020–21, some pandemic-related restrictions were eased, leading to a small increase of some types of hospitalisations.
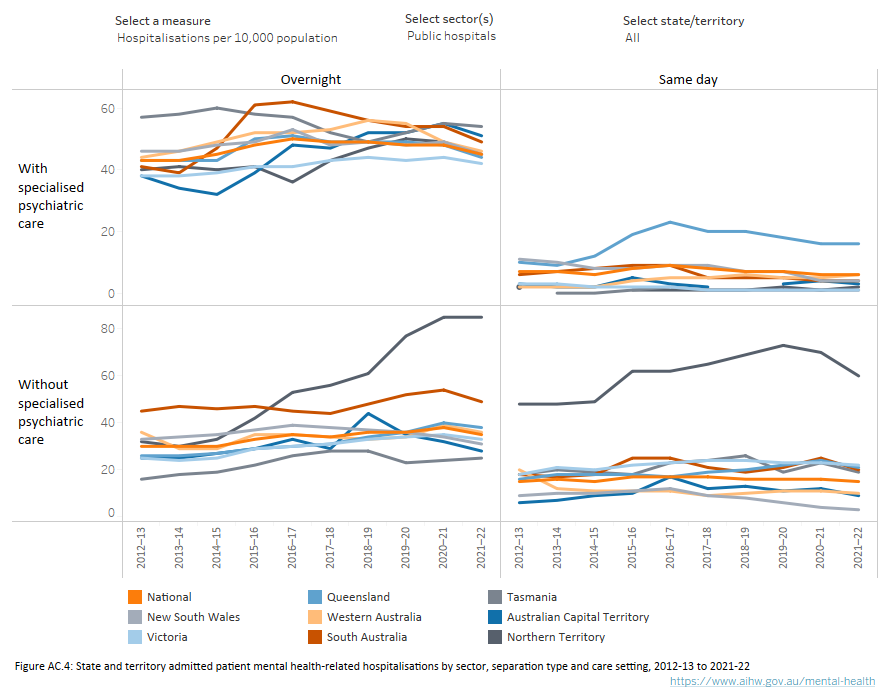
From 2012–13 to 2019–20, public hospitalisation rates (per 10,000 population) across most states and territories increased for same day without and overnight with and without specialised psychiatric care. However, in 2021–22, most states and territories decreased (Figure AC.4).
Public hospital patient days (per 10,000 population) for overnight without specialised psychiatric care increased from 2012–13 to 2019–20 across all states and territories. Northern Territory had the largest increase (186%, from 154 to 441) and New South Wales had the smallest increase (39%, from 195 to 271).
In 2021–22, public hospital overnight patient days (per 10,000 population) with specialised psychiatric care decreased the most for Australian Capital Territory (6%), whereas Tasmania had the largest increase (21%).
Private hospital overnight patient days (per 10,000 population) with specialised psychiatric care overnight decreased in 2021–22 for Western Australia (15%), and South Australia had the largest increase (32%).
Figure AC.4: State and territory admitted patient mental health-related hospitalisations by sector, separation type and care setting, 2012–13 to 2021–22
Four line graphs comparing admitted patient mental health-related hospitalisations by state and territory for sector (public, private, or public and private combined), separation type (same day and overnight) and care setting (with and without specialised psychiatric care) from 2012–13 to 2021–22. Individual jurisdictions (or national level) and sectors can be separately selected to display data by hospitalisation numbers or rates (per 10,000 population). For public hospital same day hospitalisations with specialised psychiatric care, Queensland has consistently had the highest rates from 2014–15 to 2020–21 (12 versus 16 per 10,000). Compared to 2020–21, in 2021–22 rates across most states and territories decreased for overnight hospitalisations with specialised psychiatric care.
Source: Admitted patients mental health-related care tables: Table AC.4
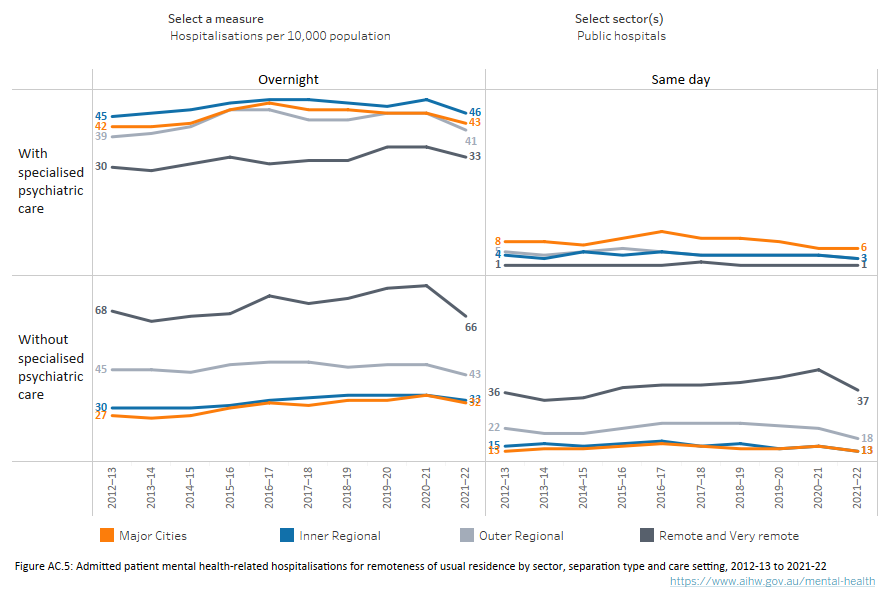
From 2012–13 to 2021–22, Remote and Very remote hospitalisation rates have been consistently lower for public same day and overnight with specialised psychiatric care, and higher for same day and overnight without specialised psychiatric care, than other areas. This may reflect lack of access to specialised psychiatric care settings in more regional and remote areas.
In 2021–22, rates for public same day hospitalisations with specialised psychiatric care decreased very slightly for Inner regional and Outer regional areas but remained the same for Major cities and Remote and Very remote. For without specialised psychiatric care, Outer regional and Remote and Very remote areas had the largest decreases. Overnight hospitalisations rates with and without specialised psychiatric care stays also decreased in all remoteness areas (Figure AC.5).
Private hospital overnight hospitalisations both with and without specialised psychiatric care have been consistently highest for Major cities and lowest for Remote and Very remote areas.
Figure AC.5: Admitted patient mental health-related hospitalisations for remoteness of usual residence by sector, separation type and care setting, 2012–13 to 2021–22
Four line graphs comparing admitted patient mental health-related hospitalisations by remoteness area of usual residence for sector (public, private, or public and private combined), separation type (same day and overnight), and care setting (with and without specialised psychiatric care) from 2012–13 to 2021–22. Sectors can be selected separately to display data by hospitalisation numbers or rates (per 10,000 population). Across the past decade from 2012–13 to 2020–21, rates have generally been stable for remoteness areas of usual residence.
Source: Admitted patients mental health-related care tables: Table AC.5
Socio-economic status
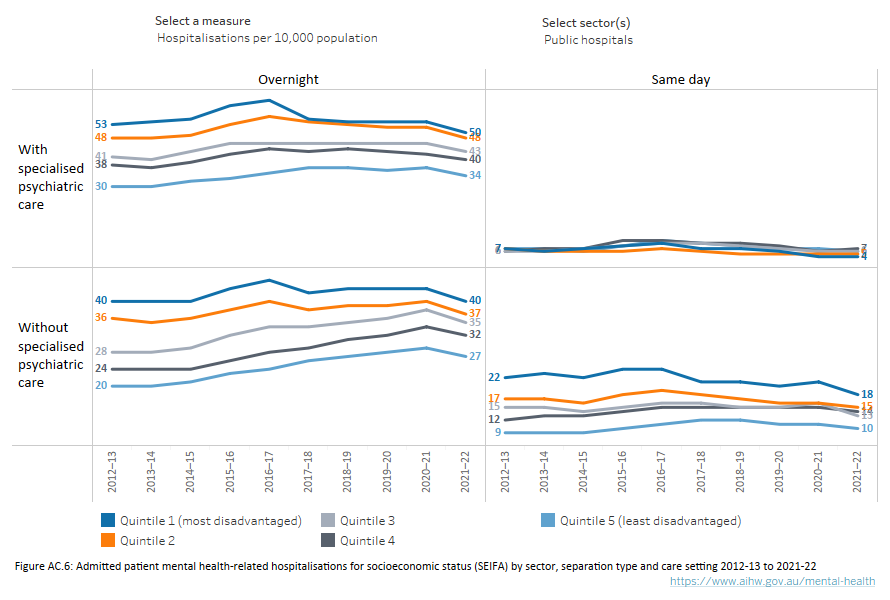
Hospitalisation rates for the past 10 years (2012–13 to 2021–22), showed that public hospital same day without specialised psychiatric care and overnight with and without specialised psychiatric care have been consistently highest for SEIFA quintile 1 (most disadvantaged) and lowest for quintile 5 (least disadvantaged) (Figure AC.6).
Rates have been consistently highest for quintile 5 (least disadvantaged) for private hospital overnight stays in both care settings (with and without).
Figure AC.6: Admitted patient mental-health related hospitalisations for socioeconomic status (SEIFA) by sector, separation type and care setting, 2012–13 to 2021–22
Four line graphs comparing admitted patient mental health-related hospitalisations by level of socio-economic status (SEIFA) quintile (quintile 1 – most disadvantaged to quintile 5 – least disadvantaged) for sector (public, private, or public and private combined), separation type (same day and overnight), and care setting (with and without specialised psychiatric care) from 2012–13 to 2021–22. Sectors can be separately selected to display data for hospitalisation numbers or rates (per 10,000 population). Across the past decade from 2012–13 to 2020–21, rates have remained relatively stable for SEIFA quintiles.
Source: Admitted patients mental health-related care tables: Table AC.5
Principal diagnosis
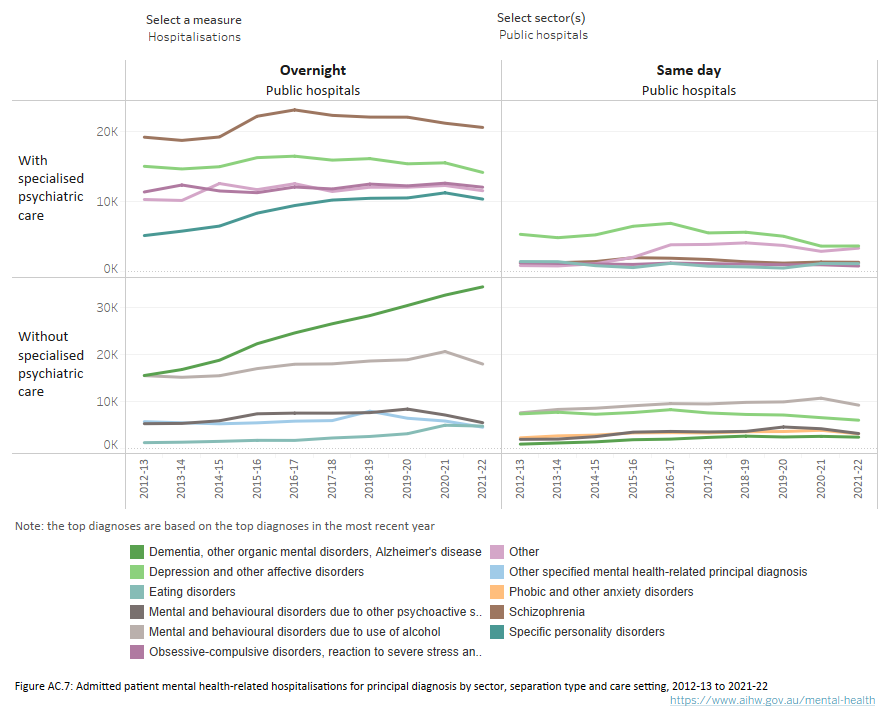
During 2012–13 to 2021–22, Depression and other affective disorders have consistently been the most frequently reported principal diagnoses for same day public and overnight private hospital admissions with specialised psychiatric care. Whereas, for overnight public hospital admissions with specialised psychiatric care, Schizophrenia has been the most common principal diagnosis.
Dementia, other organic mental disorders, Alzheimer’s disease have been the most frequently reported principal diagnoses for overnight public hospitalisations without specialised psychiatric care, and the rate (per 1,000,000 population) has nearly doubled over the ten-year period from 677 in 2012–13 to 1,322 in 2021–22. The principal diagnosis rate (per 1,000,000 population) for Eating disorders also increased and almost tripled, from 57 in 2012–13 to 187 in 2021–22.
Mental and behavioural disorders due to use of alcohol have been the most frequently reported principal diagnoses each year for same day public hospitalisations without specialised psychiatric care (Figure AC.7).
The top 3 principal diagnostic groups (Major affective and other mood disorders, Alcohol or other substance use disorders, and Anxiety and adjustment disorders) for same day private hospital episodes all decreased by 7% each in 2021–22.
Figure AC.7: Admitted patient mental health-related hospitalisations for principal diagnosis by sector, separation type and care setting, 2012–13 to 2021–22
: Four line graphs comparing admitted patient mental health-related hospitalisations by top principal diagnosis for sector (public, private, or public and private combined), separation type (same day and overnight), and care setting (with and without specialised psychiatric care) from 2012–13 to 2021–22. Sectors can be separately selected to display data for hospitalisation numbers or rates (per 1,000,000 population). Across the past decade, Depression and other affective disorders were the most common diagnoses for public hospital same day with specialised psychiatric care hospitalisations, however it has been steadily decreasing from 2012–13 (5,324) to 2021–22 (3,661). Across the past decade from 2012–13 to 2021–22, Schizophrenia was the most common diagnosis for public hospital overnight with specialised psychiatric care hospitalisations, peaking in 2016–17 (23,103) then decreasing onwards.
Source: Admitted patients mental health-related care tables: Table AC.7
Procedures refer to services that are delivered to a patient during a hospitalisation and can include surgical procedures, investigative procedures (e.g., medical imaging) and therapeutic interventions (e.g., medication). A range of different procedures may be received by patients during a mental health-related hospitalisation.
From 2017–18 to 2021–22, the most common procedure for overnight public hospital with and without specialised psychiatric care admissions was consistently Generalised allied health interventions. A breakdown of the Generalised allied health interventions is reported in the following Allied health procedures section below.
The most common procedure across 2017–18 and 2021–22 for overnight private hospital with specialised psychiatric care was consistently Psychological/psychosocial therapies. Whereas, for without specialised psychiatric care, it was Generalised allied health interventions (Figure AC.8).
Data on procedures associated with same day private psychiatric hospital care is not available.
Figure AC.8: Admitted patient mental health-related procedures by sector, separation type and care setting, 2017–18 to 2021–22
Four line graphs comparing admitted patient mental health-related patient hospitalisations by top procedure for sector (public, private, or public and private combined), separation type (same day and overnight), and care setting (with and without specialised psychiatric care) from 2017–18 to 2021–22. Sectors can be separately selected to display data by hospitalisation numbers, hospitalisation rates (per 1,000,000 population), procedure numbers, or procedure rates (per 1,000,000 population). Procedure rates for Generalised allied health interventions for public hospital same day with specialised psychiatric care, while generally lower than overnight, have consistently increased from 2018–19 to 2021–22 (72 to 118 per 1,000,000). Generalised allied health interventions for public hospital overnight with specialised psychiatric care increased from 2017–18 to 2020–21 (5,621 to 7,055 per 1,000,000) before declining slightly in 2021–22 (6,656 per 1,000,000).

Source: Admitted patient mental health-related care supplementary data tables: Table ‘Procedures’
In public hospitals, the most frequently reported allied health procedure (patient support intervention). for same day with specialised psychiatric care from 2017–18 was Social work until 2020–21, where Psychology (psychological consultation in hospital) greatly increased (by 89%) between 2019–20 and 2020–21, overtaking Social work (Figure AC.9).
Social work was also the most frequently reported allied health procedure throughout 2017–18 to 2021–22 for same day without specialised psychiatric care (45% of procedures in 2021–22), and overnight (28% with and 21% without specialised psychiatric care in 2021–22) stays.
The most commonly reported allied health procedure for overnight private hospital stays with specialised psychiatric care was Psychology (31% in 2021–22), and for without specialised psychiatric care it was Physiotherapy (27% in 2021–22) (Figure AC.9).
Figure AC.9: Admitted patient mental health-related allied health procedures by sector, separation type and care setting, 2017–18 to 2021–22
Four line graphs comparing admitted patient mental health-related patient hospitalisations by top allied health procedure for sector (public, private, or public and private combined), separation type (same day and overnight), and care setting (with and without specialised psychiatric care) from 2017–18 to 2021–22. Sectors can be separately selected to display data by procedure numbers or rates (per 1,000,000 population). For public hospital overnight with specialised psychiatric care, Pharmacy procedures increased from 2017–18 (26,409) to 2020–21 (40,694), before decreasing in 2021–22 (39,811).
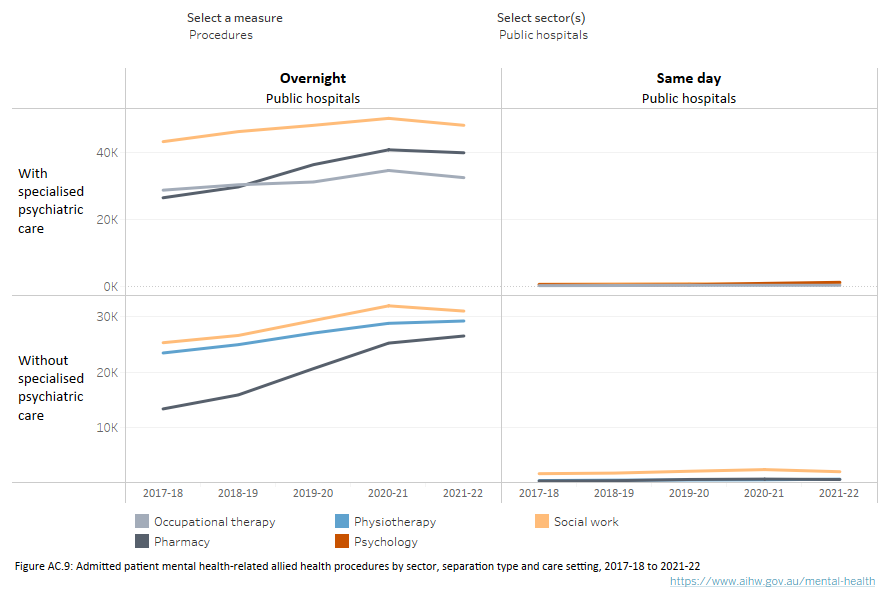
Source Admitted patient mental health-related care supplementary data tables: Table ‘Allied Procedures’
The principal source of funding for a hospitalisation is collected as part of the Admitted Patient Care National Minimum Data Set (APC NMDS). However, it should be noted that a hospitalisation may be funded by more than one funding source and information on additional funding sources is not available (refer to Table AC.9).
Over the 10 years from 2012–13 to 2021–22:
- Across both sectors (public and private), separation types (same day and overnight), and care settings (with and without specialised psychiatric care), funding sources have remained relatively stable, with public patient care (e.g., funded by the health service budget or reciprocal health care agreement) providing the majority of funding for public hospital stays, and private health insurance providing the majority of funding for private hospital stays.
- A decreasing trend for Department of Veterans’ Affairs funding can be observed for same day with specialised psychiatric care hospitalisations in public hospitals, from comprising 24% of funding in 2012–13, to 1% of funding in 2020–21. This was largely driven by recent shifts in services for veterans from admitted care to non-admitted care, for example outpatient services.
The mode of separation from care provides information on how each period of care ended, and for some, the place to which the patient was discharged or transferred (Refer to Table AC.8).
During the 10 years from 2012–13 to 2021–22:
- Across both sectors, separation types, and care settings, the most frequently reported mode of separation was discharge to home, which includes discharge to usual residence/own accommodation/welfare institution (including prisons, hostels and group homes providing primarily welfare services).
- The proportion of separations to an(other) acute or psychiatric hospital for public hospital patients in a setting without specialised psychiatric care, decreased from 21% to 12% for same day, and from 11% to 9% for overnight hospitalisations.
Where can I find more information?
You may also be interested in;
- My hospitals - Admitted patients
- Mental health services provided in emergency departments
- Community mental health care
Data sources
Although there are national standards for data on admitted patient care, the results presented here may be affected by variations in admission and reporting practices between states and territories. Interpretation of the differences between states and territories therefore needs to be made with care.
The large decline in patient days associated with public hospital mental health-related hospitalisations from 2016–17 to 2017–18 occurred after large increases from 2014–15 to 2016–17. The rise in patient days is substantially impacted by long stay mental health patients, primarily in specialised psychiatric care settings, who can individually account for hundreds of days. These fluctuations are likely to also be related to the introduction of the Mental health care type from 1 July 2015. For example, to change the care type of patients receiving mental health care, Queensland (2015–16) and New South Wales (2016–17) discharged and readmitted patients, causing the rise in hospitalisations and patient days counted in those years. The subsequent decline in patient days seen in 2017–18 is impacted by days accrued before the change in care type being counted in an earlier year.
Overnight admitted mental health-related care data and public same day admitted mental health-related care data are sourced from the National Hospital Morbidity Database (NHMD), a collation of data on admitted patient care in Australian hospitals defined by the Admitted Patient Care National Minimum Data Set (APC NMDS). It is possible for individuals to have multiple hospitalisations (separations) in any given reference period.
Due to the relatively small number of admitted patient mental health-related hospitalisations without specialised psychiatric care from public psychiatric hospitals, these have been combined with the public acute hospitals for reporting purposes.
The NHMD is a compilation of episode-level records from admitted patient morbidity data collections in Australian hospitals. Items includes demographic, administrative and length of stay data for each hospitalisation. Clinical information such as diagnoses, procedures undergone, and external causes of injury and poisoning are also recorded. For further details on the scope and quality of data in the NHMD, refer to the data quality statement in Admitted patient care NMDS 2021–22.
Further information on admitted patient care can be found in the report Admitted patients 2021–22 (AIHW 2023), which contains data for hospitalisations that occurred between 1 July 2021 and 30 June 2022. Admitted patient episodes of care/hospitalisations that began before 1 July 2021 are included if the separation date fell within the collection period. A record is generated for each hospitalisation (separation) rather than each patient. Therefore, those patients who had more than one hospitalisation in the reference year will have more than one record in the database.
Specialised mental health-related care is identified by the patient having one or more psychiatric care days recorded – that is, care was received in a specialised psychiatric unit or ward during that separation. In public acute hospitals, a specialised episode of care or separation may comprise some psychiatric care days and some days in general care. An episode of care from a public psychiatric hospital is deemed to comprise psychiatric care days only and to be specialised, unless some care was given in a unit other than a psychiatric unit, such as a drug and alcohol unit.
The principal diagnosis refers to the diagnosis established after observation by medical staff to be chiefly responsible for the patient’s episode of admitted patient care. For 2021–22, diagnoses are classified according to the International Statistical Classification of Diseases and Related Health Problems, 11th revision, Australian Modification (ICD-11-AM 11th edition) (ACCD 2021). Further information on this is included in the technical information section.
For 2021–22, procedures are classified according to the Australian Classification of Health Interventions, 11th edition. Further information on this classification is included in the technical information section. More than one procedure can be reported for a separation and not all hospitalisations have a procedure reported.
Private hospital same day admitted mental health-related care data is sourced from the Australian Private Hospitals Association’s Private Psychiatric Hospitals Data Reporting and Analysis Service (PPHDRAS) and is not directly comparable with data from the NHMD.
Some state and territory data from the PPHDRAS is aggregated to maintain privacy for participating hospitals. New South Wales and the Australian Capital Territory are reported together (NSW/ACT) as are Western Australia, South Australia, Tasmania, and Northern Territory (WA/SA/Tas/NT). Victoria and Queensland are reported separately.
Due to the relatively small number of patients in Outer regional, Remote and Very remote areas, only Urban versus Non-urban is reported. The classification of patients into Urban versus Non-urban groups was based on the Australian Statistical Geography Standard (ASGS) Remoteness classification of the Postcode of their Area of usual residence, at the first day of care within the financial year. In cases where the Area of usual residence was missing from that first day’s record, the first valid value for the patient is used. Patients whose Area of usual residence was in the ASGS group Major cities were classified as Urban, whilst those in the remaining groups (Inner regional, Outer regional, Remote and Very remote) were classified as Non-urban.
Counts of episodes include only clinically substantive episodes of care. Episodes that are of brief duration (1 or 2 contacts only) and episodes during which contacts were sparse (average interval between contacts 6 weeks or greater) are excluded from the count. Consequently, the count of episodes can in some cases be less than the count of unique patients.
The Australian Private Hospitals Association Private Psychiatric Hospitals Data Reporting and Analysis Service (PPHDRAS), previously known as the Private Mental Health Alliance Centralised Data Management Service (PMHA CDMS), was launched in Australia in 2001 to support private hospitals with psychiatric beds to routinely collect and report on a nationally agreed suite of clinical measures and related data for the purposes of monitoring, evaluating and improving the quality of and effectiveness of care. The PPHDRAS works closely with private hospitals, health insurers and other funders (e.g., Department of Veterans’ Affairs) to provide a detailed quarterly statistical reporting service on participating hospitals’ service provision and patient outcomes.
The PPHDRAS fulfils two main objectives. Firstly, it assists participating private hospitals with implementation of their National Model for the Collection and Analysis of a Minimum Data Set with Outcome Measures. Secondly, the PPHDRAS provides hospitals and private health funds with a data management service that routinely prepares and distributes standard reports to assist them in the monitoring and evaluation of health care quality. The PPHDRAS also maintains training resources for hospitals and a database application which enables hospitals to submit de-identified data to the PPHDRAS. The PPHDRAS produces an annual statistical report. In 2021–22, the PPHDRAS accounted for 98% of all private psychiatric beds in Australia (APHA 2023).
The classification of diagnostic groups used by the PPHDRAS is based on the ICD-10 principal diagnosis assigned to the episode of care at discharge. There are eight clinical groupings of the ICD-10 diagnoses relating to mental and behavioural disorders, they are as follows:
- Schizophrenia, Schizoaffective and Other Psychotic Disorders. This group includes ICD-10 diagnoses of: Psychotic disorders due to psychoactive substance use (F1x.5 and F1x.7), Schizophrenia (F20), Schizotypal disorders (F21), Delusional disorders (F22 and F24), Acute and transient psychotic disorders (F23), Schizoaffective disorders (F25), and Other non-organic psychotic disorders (F28 and F29).
- Major Affective and Other Mood Disorders. This group includes ICD-10 diagnoses of Manic episodes and bipolar affective disorders with current episode manic (F30, F31.0, F31.1 and F31.2), Depressive episodes, bipolar disorders with current episode depressed or mixed, and Recurrent depressive disorders (F31.3, F31.4, F31.5, F31.6, F31.7, F31.8, F31.9, F32 and F33), and Persistent mood disorders including cyclothymia and dysthymia, and Other mood disorders (F34, F38 and F39).
- Post Traumatic and Other Stress-related Disorders. This group includes ICD-10 diagnoses of Reactions to severe stress including acute stress reactions (F43.0, F43.8 and F43.9), Adjustment disorders with brief depressive reactions (F43.20), Adjustment disorders with prolonged depressive reactions (F43.21), Other adjustment disorders (F43.22 and F43.28) and Posttraumatic stress disorders (F43.1).
- Anxiety Disorders. This group includes ICD-10 diagnoses of Anxiety disorders including phobic anxiety, Panic disorder, Generalised anxiety disorder and Other neurotic disorders (F40, F41 and F48), and Dissociative disorders (F44). It does not include Obsessive Compulsive Disorders (F42) or Somatoform Disorders (F45) which are classified elsewhere.
- Alcohol and Other Substance Use Disorders. This group includes ICD-10 diagnoses of Alcohol and Other psychoactive substance intoxication, harmful, use, dependence and withdrawal (F1x.0, F1x.1, F1x.2, F1x.3, F1x.4, F1x.8 and F1x.9).
- Eating Disorders. This group includes ICD-10 diagnoses of Anorexia nervosa and Atypical anorexia nervosa (F50.0 and F50.1), and Eating disorders other than anorexia nervosa (F50.2, F50.3, F50.4- and F50.9).
- Personality Disorders. This group includes ICD-10 diagnoses of Paranoid and schizoid personality disorders (F60.0 and F60.1), Dissocial personality disorders including antisocial personality disorder (F60.2), Emotionally unstable personality disorders (includes borderline and impulsive) (F60.3), Histrionic, Anankastic (obsessive-compulsive), Anxious, and Dependent personality disorders (F60.4, F60.5, F60.6 and F60.7), and Other personality disorders (F60.8, F60.9, F61.0, F61.1, F62, F63, F68 and F69).
- Other Disorders, Not Elsewhere Classified. This group includes all remaining psychiatric and other diagnoses including: Organic Disorders (F00 through F09 and F1x.6); Obsessive Compulsive Disorders (F42); Somatoform disorders (F45); Behavioural Syndromes Associated with Physiological Disturbances and Physical Factors (F51, F53, F54, and F59); Sexual Disorders (F52, F64, F65 and F66); Mental Retardation (F70, F71, F72, F73, F78 and F79); Disorders of Psychological Development (F80, F81, F82, F83, F84, F88 and F89); Disorders of Childhood and Adolescence (F90, F91, F92, F93, F94, F95 and F98.0); Other Disorders, including ICD-10 diagnoses of Mental disorders, not otherwise specified (F99) and all other valid non-psychiatric diagnoses (i.e., diagnoses not grouped under either MDC 19 or MDC 20 in AR-DRG 4).
Statistics for states and territories were aggregated in accordance with PPHDRAS policy which, in order to ensure the privacy and confidentiality of both patients and providers, prohibits individual state or territory statistics being reported in cases where the number of Hospitals is less than five. As a consequence, statistics for the Australian Capital Territory are aggregated with those for New South Wales, whilst those for South Australia, Western Australia, Tasmania and Northern Territory are also aggregated.
ACCD (Australian Consortium for Classification Development) (2021) The international statistical classification of diseases and related health problems, 11th revision, Australian modification (ICD-10-AM), Australian Classification of Health Interventions (ACHI) and Australian Coding Standards (ACS), 11th ed., University of Sydney.
AIHW (2023) Admitted patients 2021–22, AIHW, Australian Government, accessed 1 September 2023.
APHA (Australian Private Hospitals Association) (2023) Private Hospital-based Psychiatric Services 1 July 2021 to 30 June 2022, APHA, accessed 21 September 2023.
Data coverage includes the time period 2006–07 to 2021–22. This section was last updated in December 2023.


