Independent variables
Four domains (or sets of variables) were selected from the 2018–19 NATSIHS as the core independent variables (Table 2.3):
- demographic/location factors (for example, age, sex, remoteness, state/territory, Socio-Economic Indexes for Areas (SEIFA))
- socioeconomic/social capital (for example, equivalised income, financial stress, education, employment status)
- cultural factors/experiences of unfair treatment (for example, language spoken at home, cultural identification, experiences of racism/discrimination)
- health status/disability (for example, perceived health status, presence of particular conditions such as diabetes or mental health conditions, comorbidities).
Domain | Included variables |
|---|---|
| |
| |
| |
|
- All people aged 15 and over.
- People aged 18 and over who were physically present at the time of the interview.
- People aged 15 and over who were physically present at the time of the interview. At the national level, the setting in which the unfair treatment took place and an additional variable (whether the respondent avoided certain situations because of past experiences of racism/discrimination) were also looked at. Because of small numbers, only the experienced/didn’t experience unfair treatment variable is included in the descriptive analyses because of small numbers in the sub-categories.
- K5 = Kessler Psychological Distress Scale.
Distribution of independent variables by domain
Demographic/location factors
Five variables were included which capture respondents’ sex, age, remoteness category, state/territory, and SEIFA quintile (which is a marker of area-level socioeconomic advantage/disadvantage) (Appendix 2, Table A2.1).
Use of primary health care tends to be higher among females than males. The data show that 51% of respondents were females (413,100) and 49% were males (400,900).
Patterns of the need for, and use of, primary health care also vary by age. Very young children, females of childbearing age, and the elderly have both the highest health needs and usage patterns. Health needs for very young children include a mix of acute and preventive care services (such as developmental health checks) while health needs among older age groups include acute, preventive and chronic disease management care.
Figure 2.3 highlights the young age distribution of the population, with more than 50% aged 0–24, and fewer than 5% aged 65 and older.
Figure 2.3: Distribution of Aboriginal and Torres Strait Islander population, by age, 2018–19
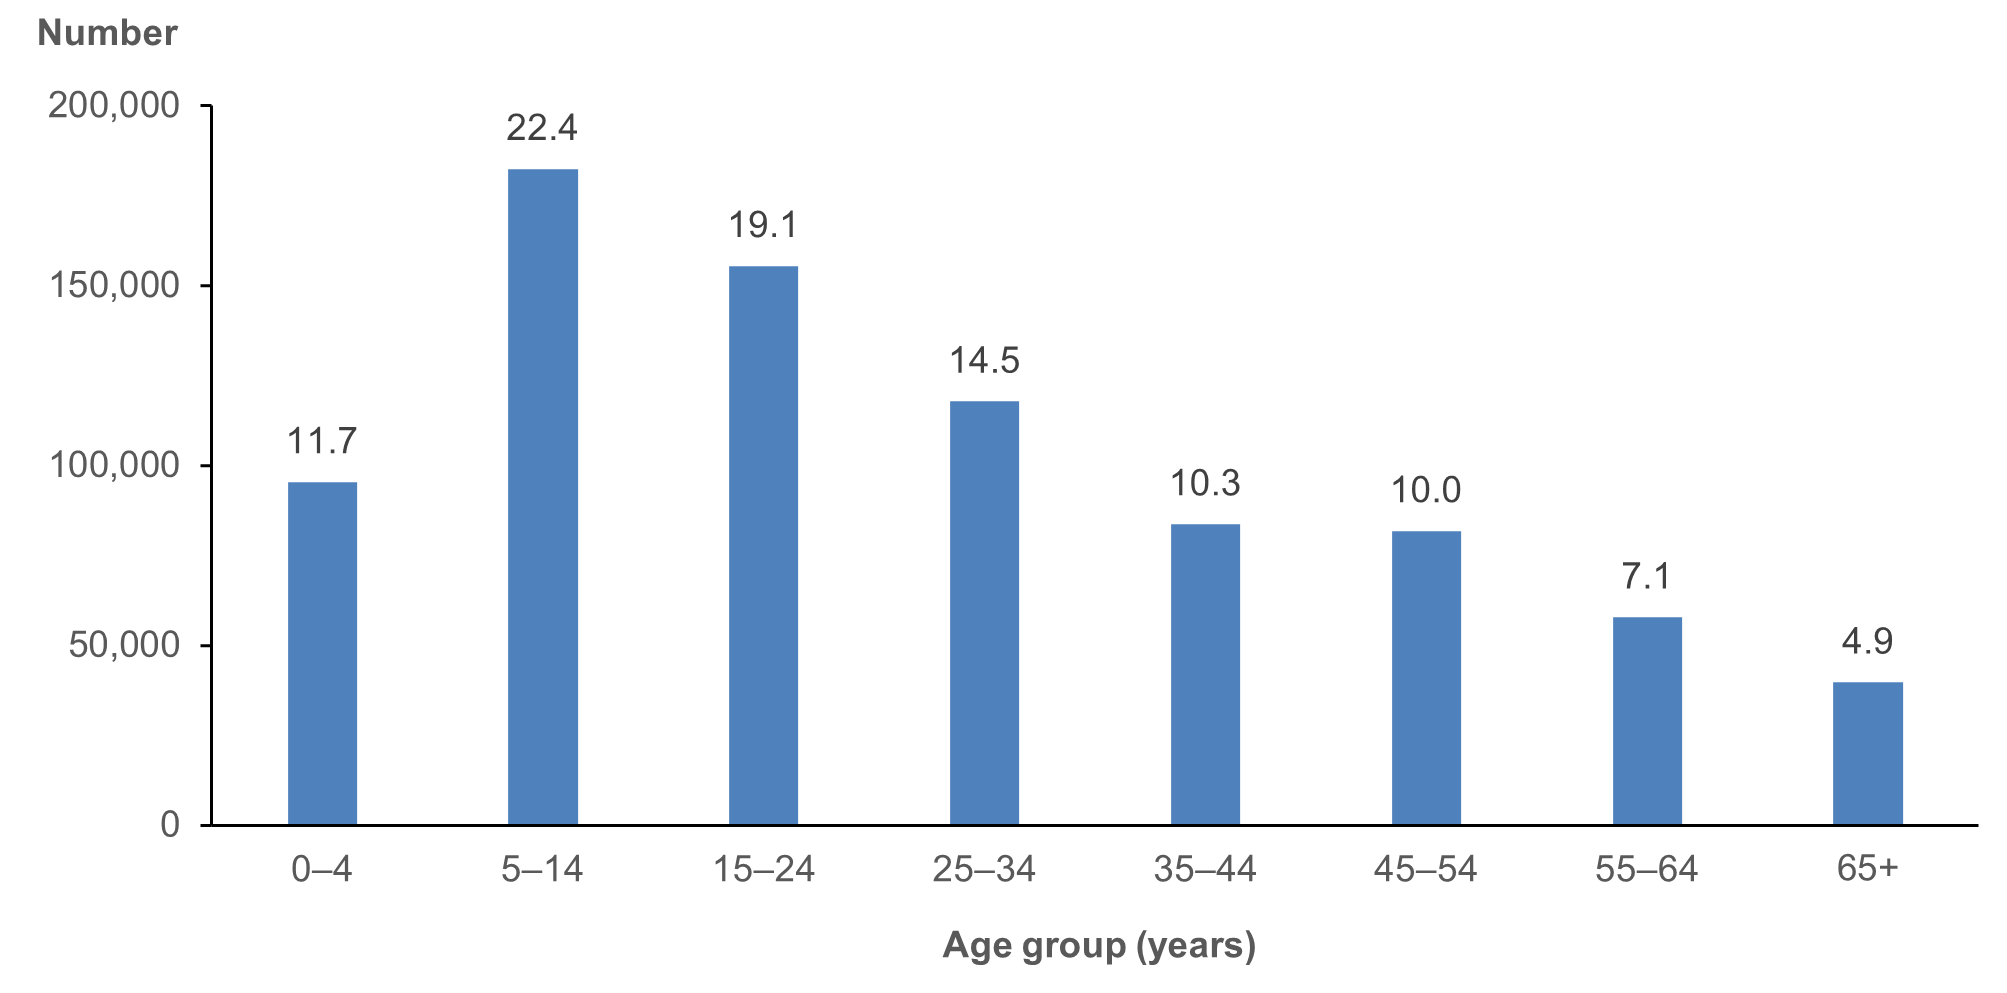
Note: The numbers above the column bars are percentages.
Source: AIHW analysis of 2018–19 NATSIHS (ABS 2019) using TableBuilder.
Previous research has shown that there is a strong association between remoteness and health service availability, social determinants, and health status among Aboriginal and Torres Strait Islander people (AIHW 2023a). It is important to note, however, that Aboriginal and Torres Strait Islander people living in more urban areas also have barriers to accessing primary health care, but the nature of some of these barriers differs from those in more remote areas (Scrimgeour and Scrimgeour 2007). As shown in Figure 2.4, more than 50% of people lived in Major cities or Inner regional areas, while 6.5% lived in Remote areas and 12% in Very remote areas.
Figure 2.4: Distribution of Aboriginal and Torres Strait Islander population, by remoteness, 2018–19
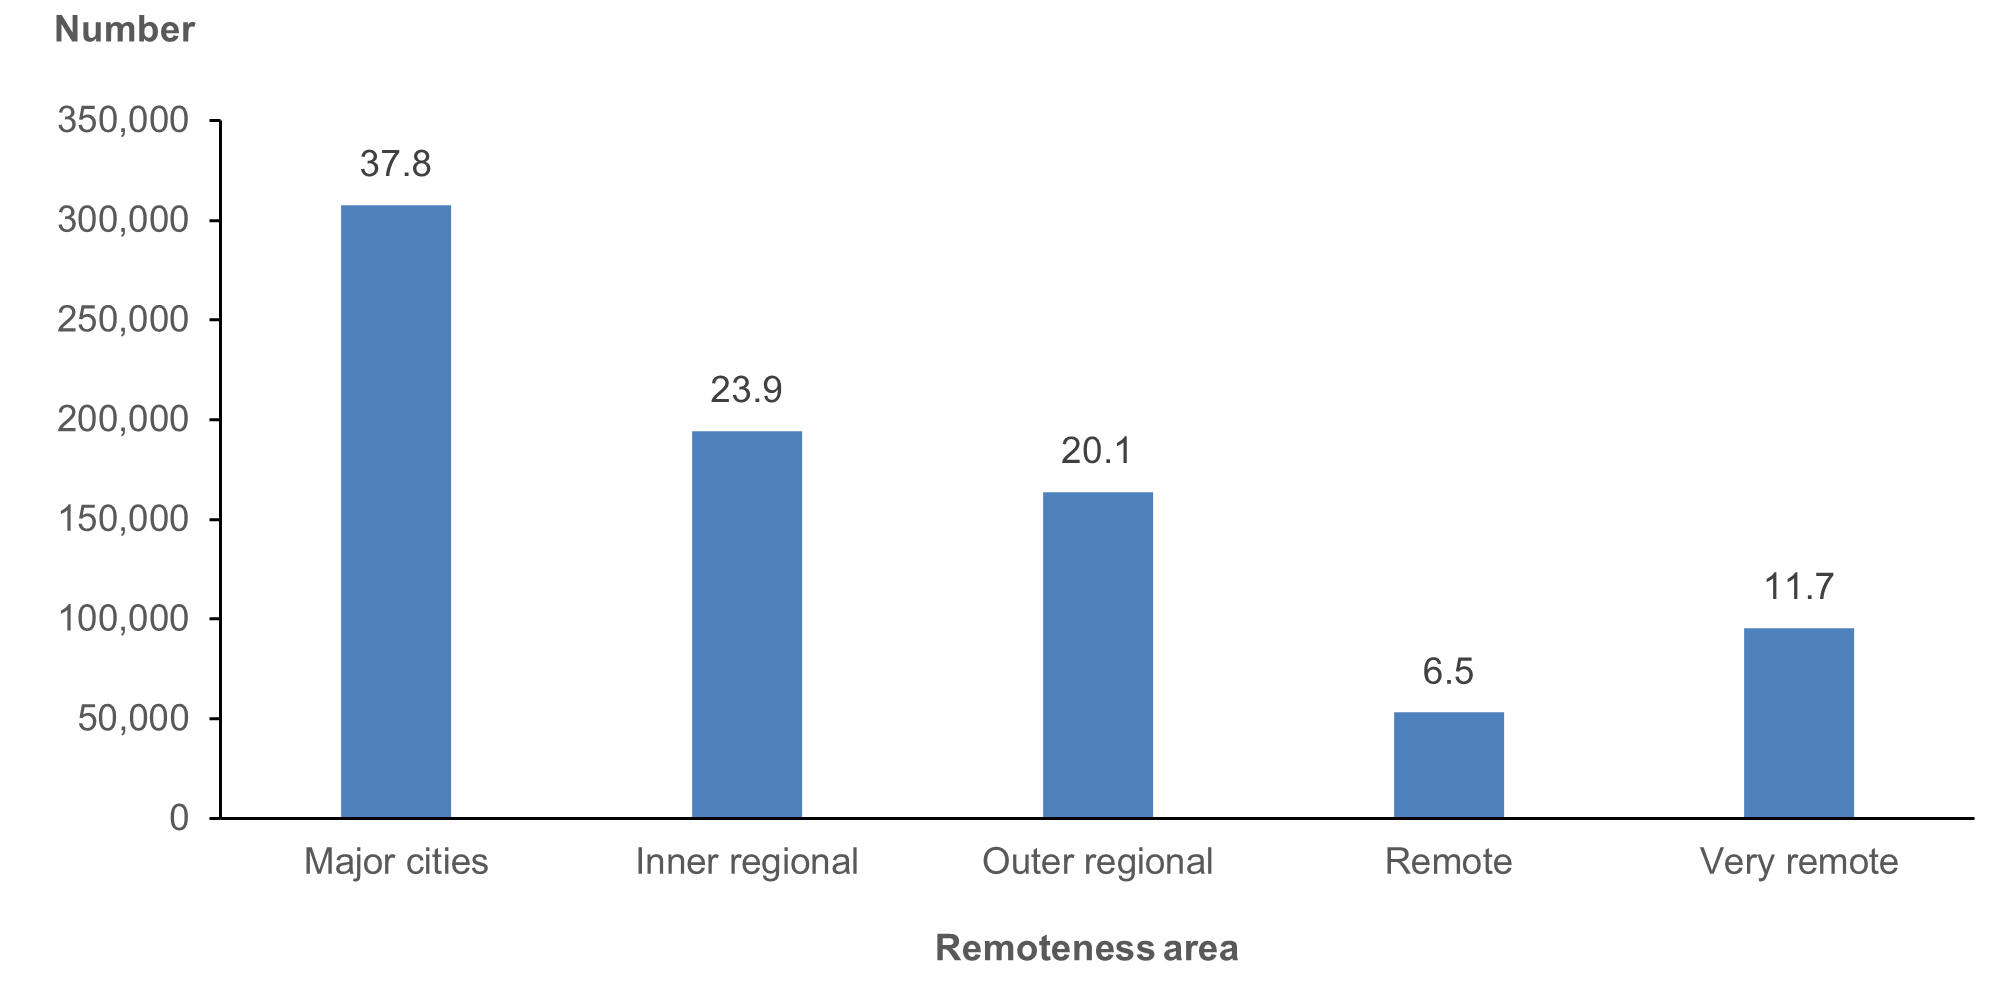
Note: The numbers above the column bars are percentages.
Source: AIHW analysis of 2018–19 NATSIHS (ABS 2019) using TableBuilder.
The largest number of Aboriginal and Torres Strait Islander people lived in New South Wales, followed by Queensland, Western Australia and the Northern Territory. Fewer than 1% lived in the Australian Capital Territory and fewer than 4% in Tasmania (Figure 2.5).
Figure 2.5: Distribution of Aboriginal and Torres Strait Islander population, by state/territory, 2018–19
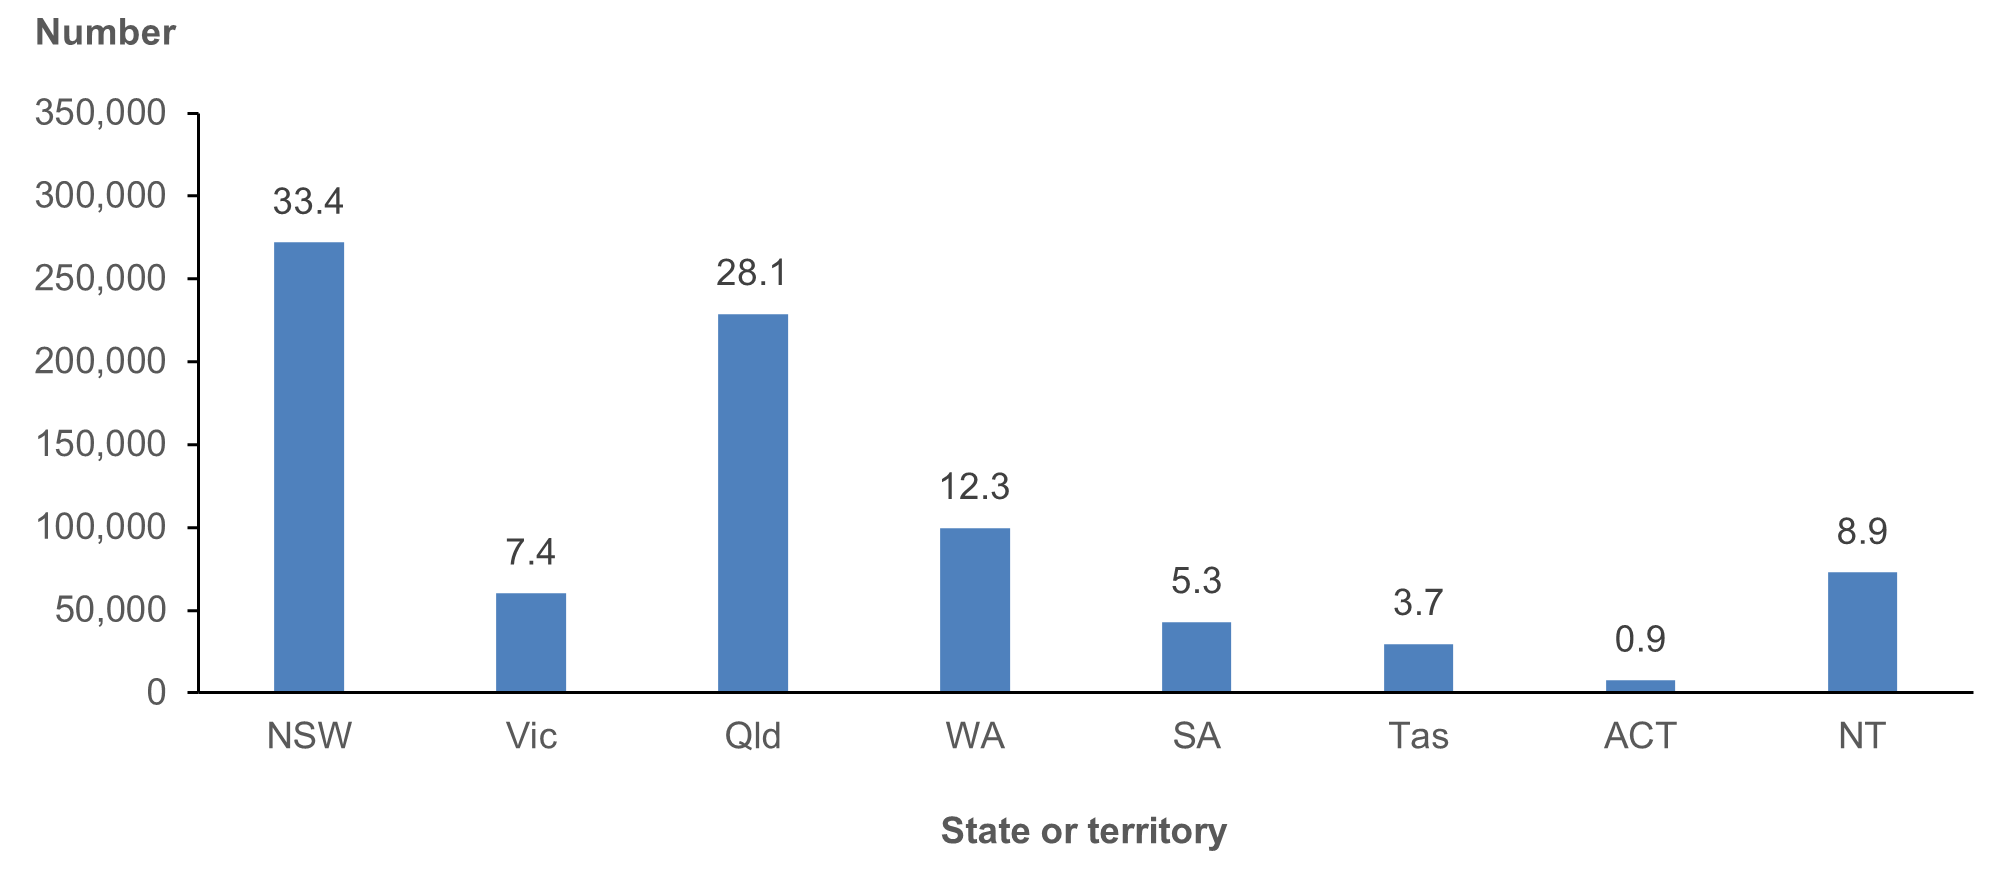
Note: The numbers above the column bars are percentages.
Source: AIHW analysis of 2018–19 NATSIHS (ABS 2019) using TableBuilder.
The distribution of area-level SEIFA shows that over half of Aboriginal and Torres Strait Islander people lived in areas (Statistical Area 1 [SA1]) with the highest levels of disadvantage and fewer than 5% lived in areas that were the least disadvantaged (Figure 2.6). (Note that SEIFA is a contextual variable – it does not mean that everyone who lives in areas with the same SEIFA score are equally advantaged or disadvantaged.) Previous research has shown associations with a range of social determinants and health service availability measures, and there is a relationship between SEIFA and life expectancy (Zhao 2015).
Figure 2.6: Distribution of Aboriginal and Torres Strait Islander population, by SEIFA quintile, 2018–19

Note: The numbers above the column bars are percentages.
Source: AIHW analysis of 2018–19 NATSIHS (ABS 2019) using TableBuilder.
Socioeconomic/social capital
As discussed previously, socioeconomic and social capital can be either a protective factor for health and health service use or pose risks, with those people with fewer resources likely to both have higher needs and lower access to health services. The set of included socioeconomic and social capital variables reflects people’s current financial circumstances and labour force status and their most recent educational attainment/qualifications (Appendix 2, Table A2.2).
Consistent with the area-level SEIFA measures, the individual/family measures of income and financial circumstances suggest a high level of financial vulnerability. Just under half (45%) of Aboriginal and Torres Strait Islander people would be able to raise $2,000 in an emergency, over 60% had days without money for basic living expenses in the past 12 months, and only about a fifth of those in Major cities and regional areas had private health cover. When family income is considered, just over 65% had equivalised income in the lowest 2 quintiles (bottom 40%) (Figure 2.7).
Figure 2.7: Distribution of equivalised annual household income among Aboriginal and Torres Strait Islander people, 2018–19
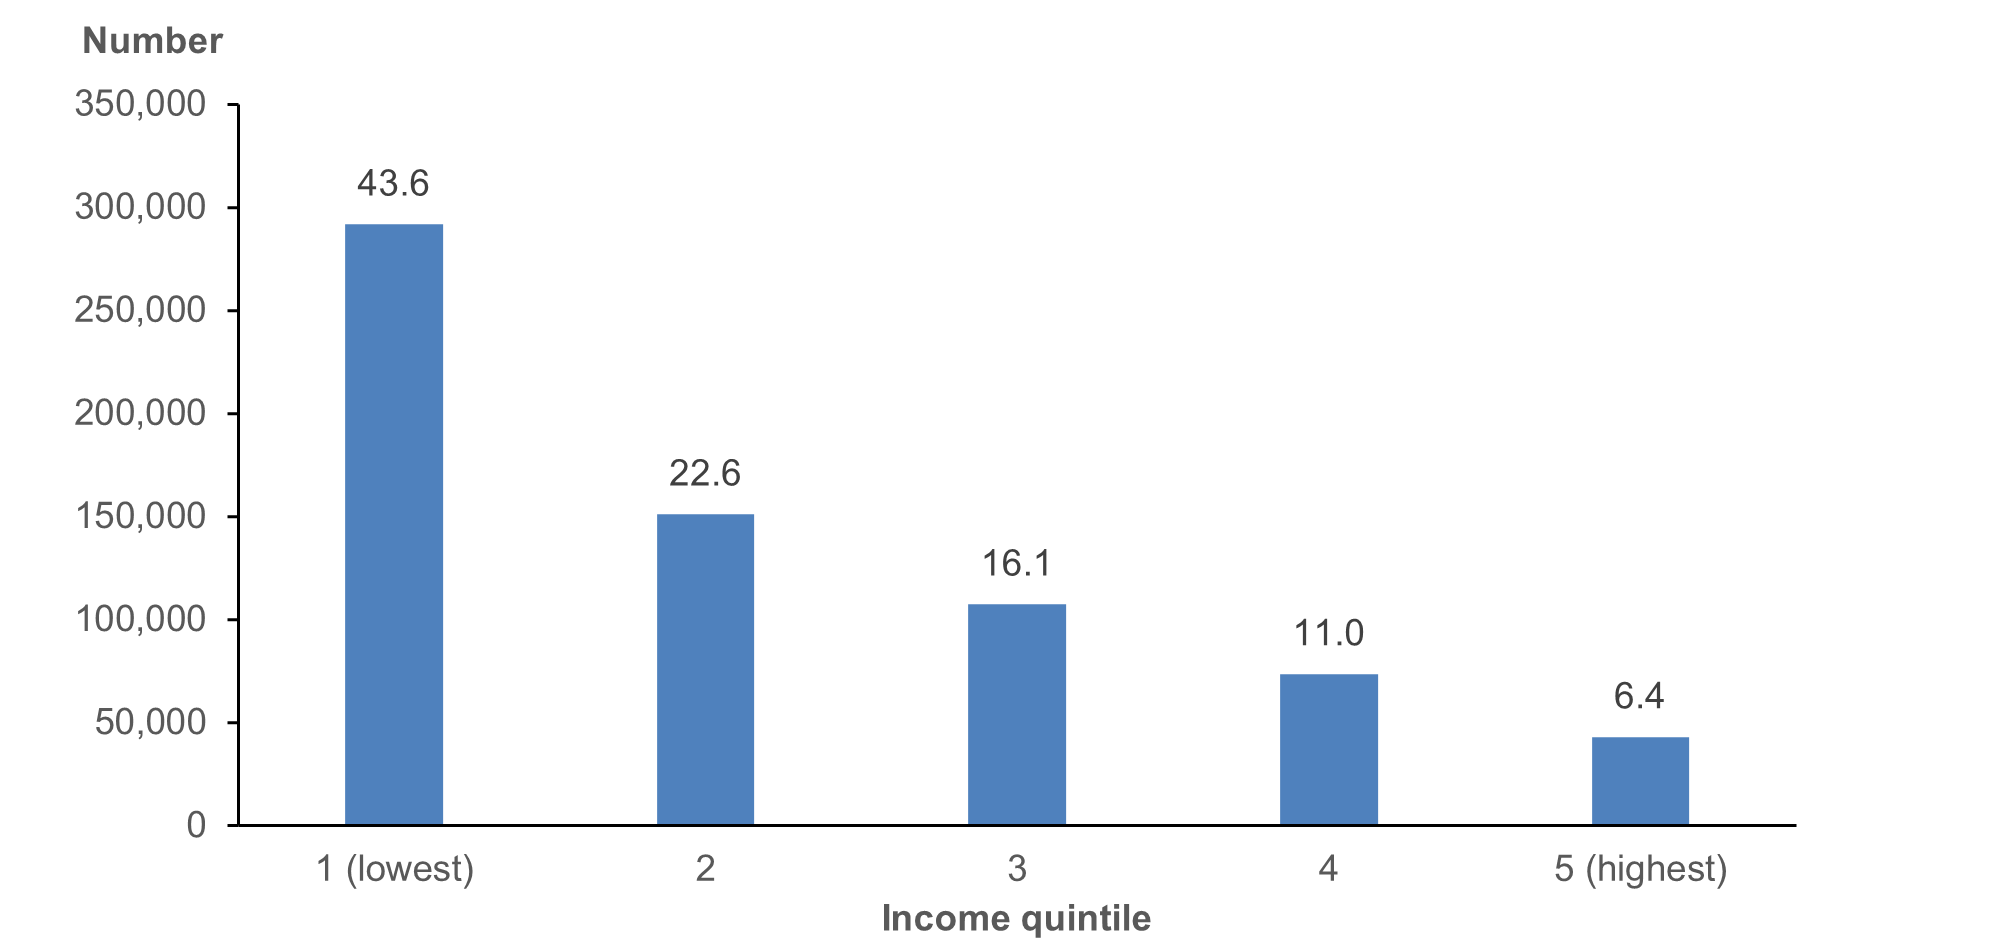
Note: The numbers above the column bars are percentages.
Source: AIHW analysis of 2018–19 NATSIHS (ABS 2019) using TableBuilder.
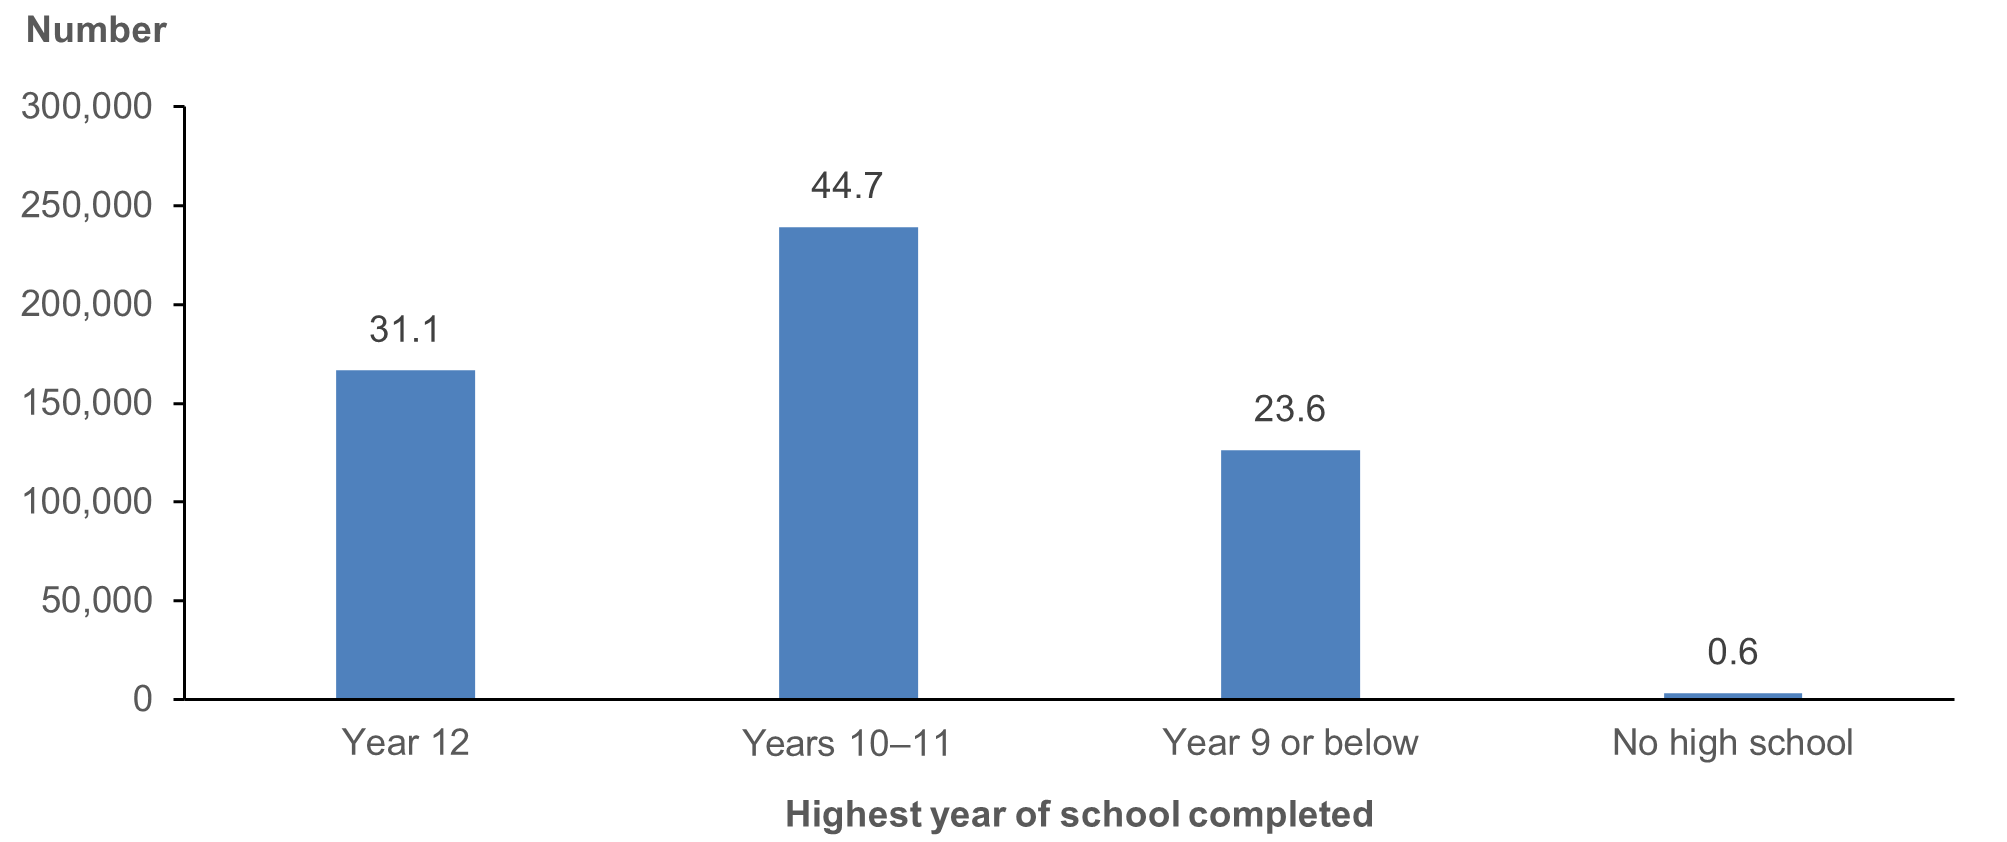
Educational attainment is closely linked with economic opportunities as well as with health literacy and protective health behaviours. Just over 30% of Aboriginal and Torres Strait Islander adults had completed year 12 (Figure 2.8), while nearly half (48% or 258,800) had a non-school qualification (post school qualification).
Figure 2.8: Distribution of highest year of school completed among Aboriginal and Torres Strait Islander people aged 15 and over, 2018–19
Note: The numbers above the column bars are percentages.
Source: AIHW analysis of 2018–19 NATSIHS (ABS 2019) using TableBuilder.
These numbers shown in Figure 2.8 are likely to be higher in the next NATSIHS, as high school attainment has been increasing over time.
In terms of labour force status, 46% of Aboriginal and Torres Strait Islander people aged 15 and over were currently working full time or part time. About 29% were living in homes that were owned/mortgaged (235,700), with another 557,900 respondents living in rental accommodation (69%).
Cultural factors/experiences of unfair treatment
As noted previously, cultural identification, engagement and participation are protective factors for Aboriginal and Torres Strait Islander people. It may also affect their preferences for type of health care (such as preference for an ACCHO).
Two cultural identification and 2 language variables were selected for initial inclusion (see Appendix 2, Table A2.3). Several other cultural identification variables in the NATSIHS were asked only of those in non-remote areas, so were not included.
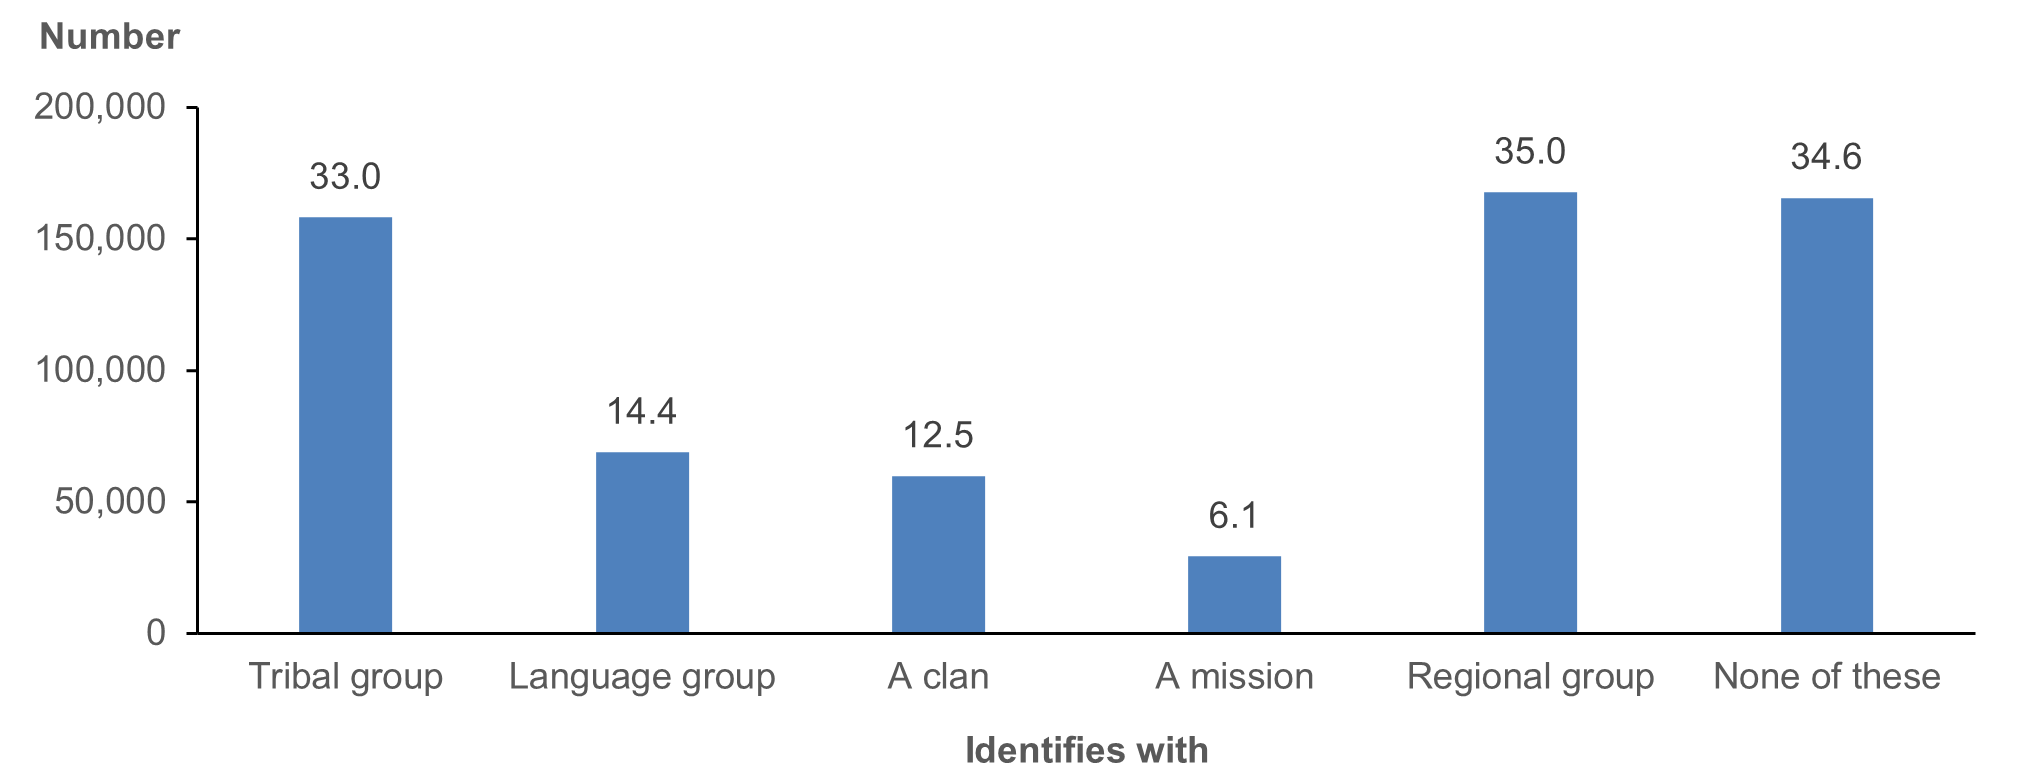
Identification with tribal group, language or group or clan variable was asked of all respondents aged 18 and over, and respondents could choose multiple responses (Figure 2.9). Of an estimated 479,000 Aboriginal and Torres Strait Islander adults, 313,400 (65%) identified at least one tribal group, language group, clan, mission or regional group. Respondents could tick as many categories as applied to them, and the categories with the highest responses were regional group and tribal group.
Figure 2.9: Aboriginal and Torres Strait Islander people aged 18 and over, by cultural identification, 2018–19
Notes
- Respondents could select multiple responses.
- The numbers above the column bars are percentages.
Source: AIHW analysis of 2018–19 NATSIHS (ABS 2019) using TableBuilder.
The second included item asked those aged 18 and over the extent to which they were satisfied with their own knowledge of culture, with 55% reporting they were satisfied or very satisfied with their own knowledge of culture, and 25% being not satisfied.
Two questions on language were included – main language spoken at home and, for those who spoke an Indigenous or other language at home, the extent to which they spoke English well. The data show that the main language spoken at home was English for 91% of respondents, with 8.4% speaking an Indigenous language as their primary language. The benefits of being able to speak a traditional language are well established; among those speaking an Indigenous language at home, the majority also reported being able to speak English well. Around 12,000 respondents in Remote and Very remote areas did not speak English well – they may be at risk of service access issues unless the primary health services are able to provide information and care either in language or through interpreters.
Experiences of unfair treatment
As discussed earlier, exposure to racism and discrimination poses risks to Aboriginal and Torres Strait Islander people’s physical and mental health and affects all aspects of life (such as educational attainment, employment, and access to and use of health services).
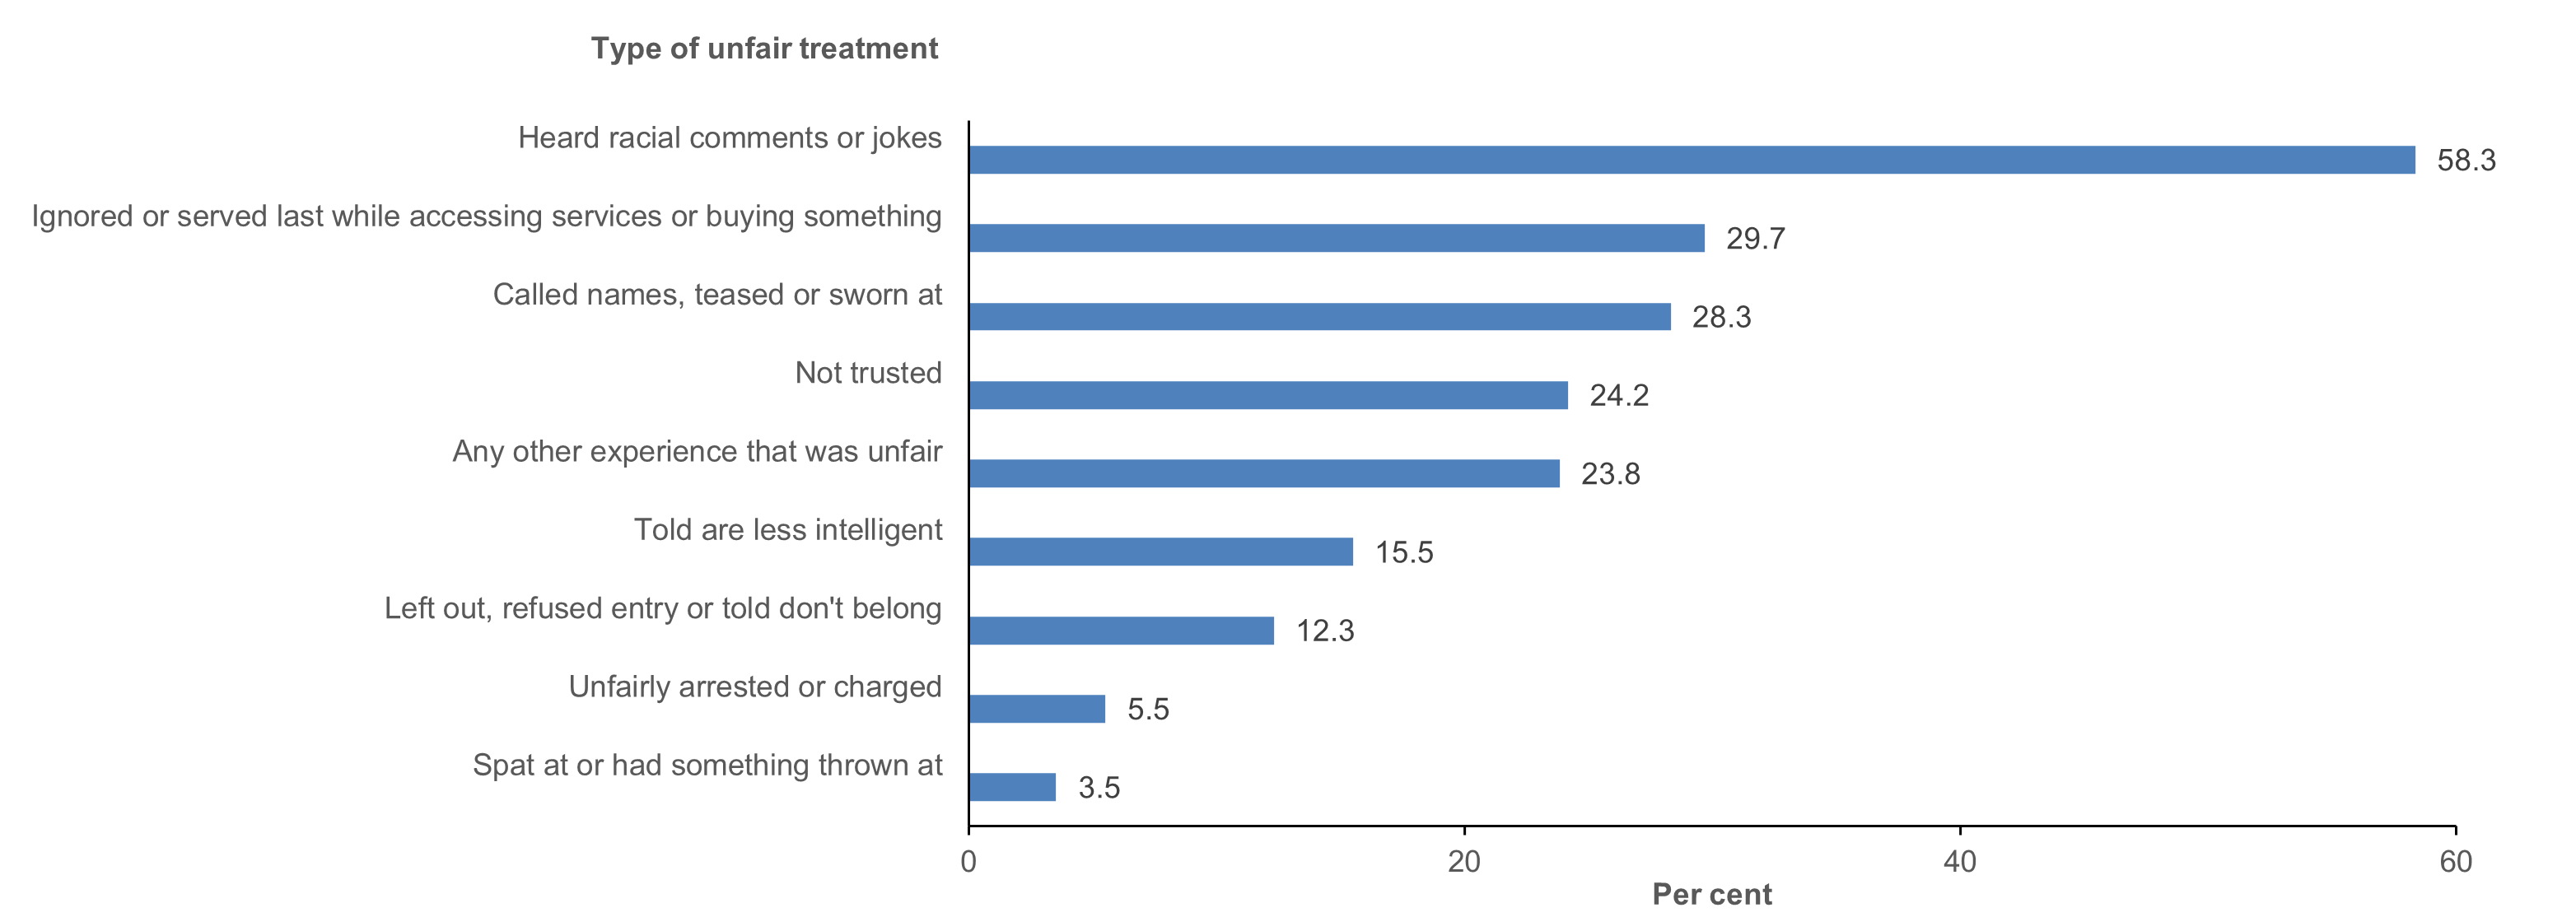
Respondents aged 15 and over who were physically present at the time of the interview were asked whether they had experienced unfair treatment in the past 12 months because they were Aboriginal or Torres Strait Islander. The data showed that 116,200 people (23% of those with a response) did experience unfair treatment.
The most frequently cited type of unfair treatment was hearing racial comments or jokes, followed by being ignored or served last while accessing services or buying something and being called names, teased or sworn at (Figure 2.10).[1]
Although for 45% (53,000) of those who had experienced unfair treatment in the past 12 months it had only happened once or rarely, for another 20% it happened often or always (22,000).
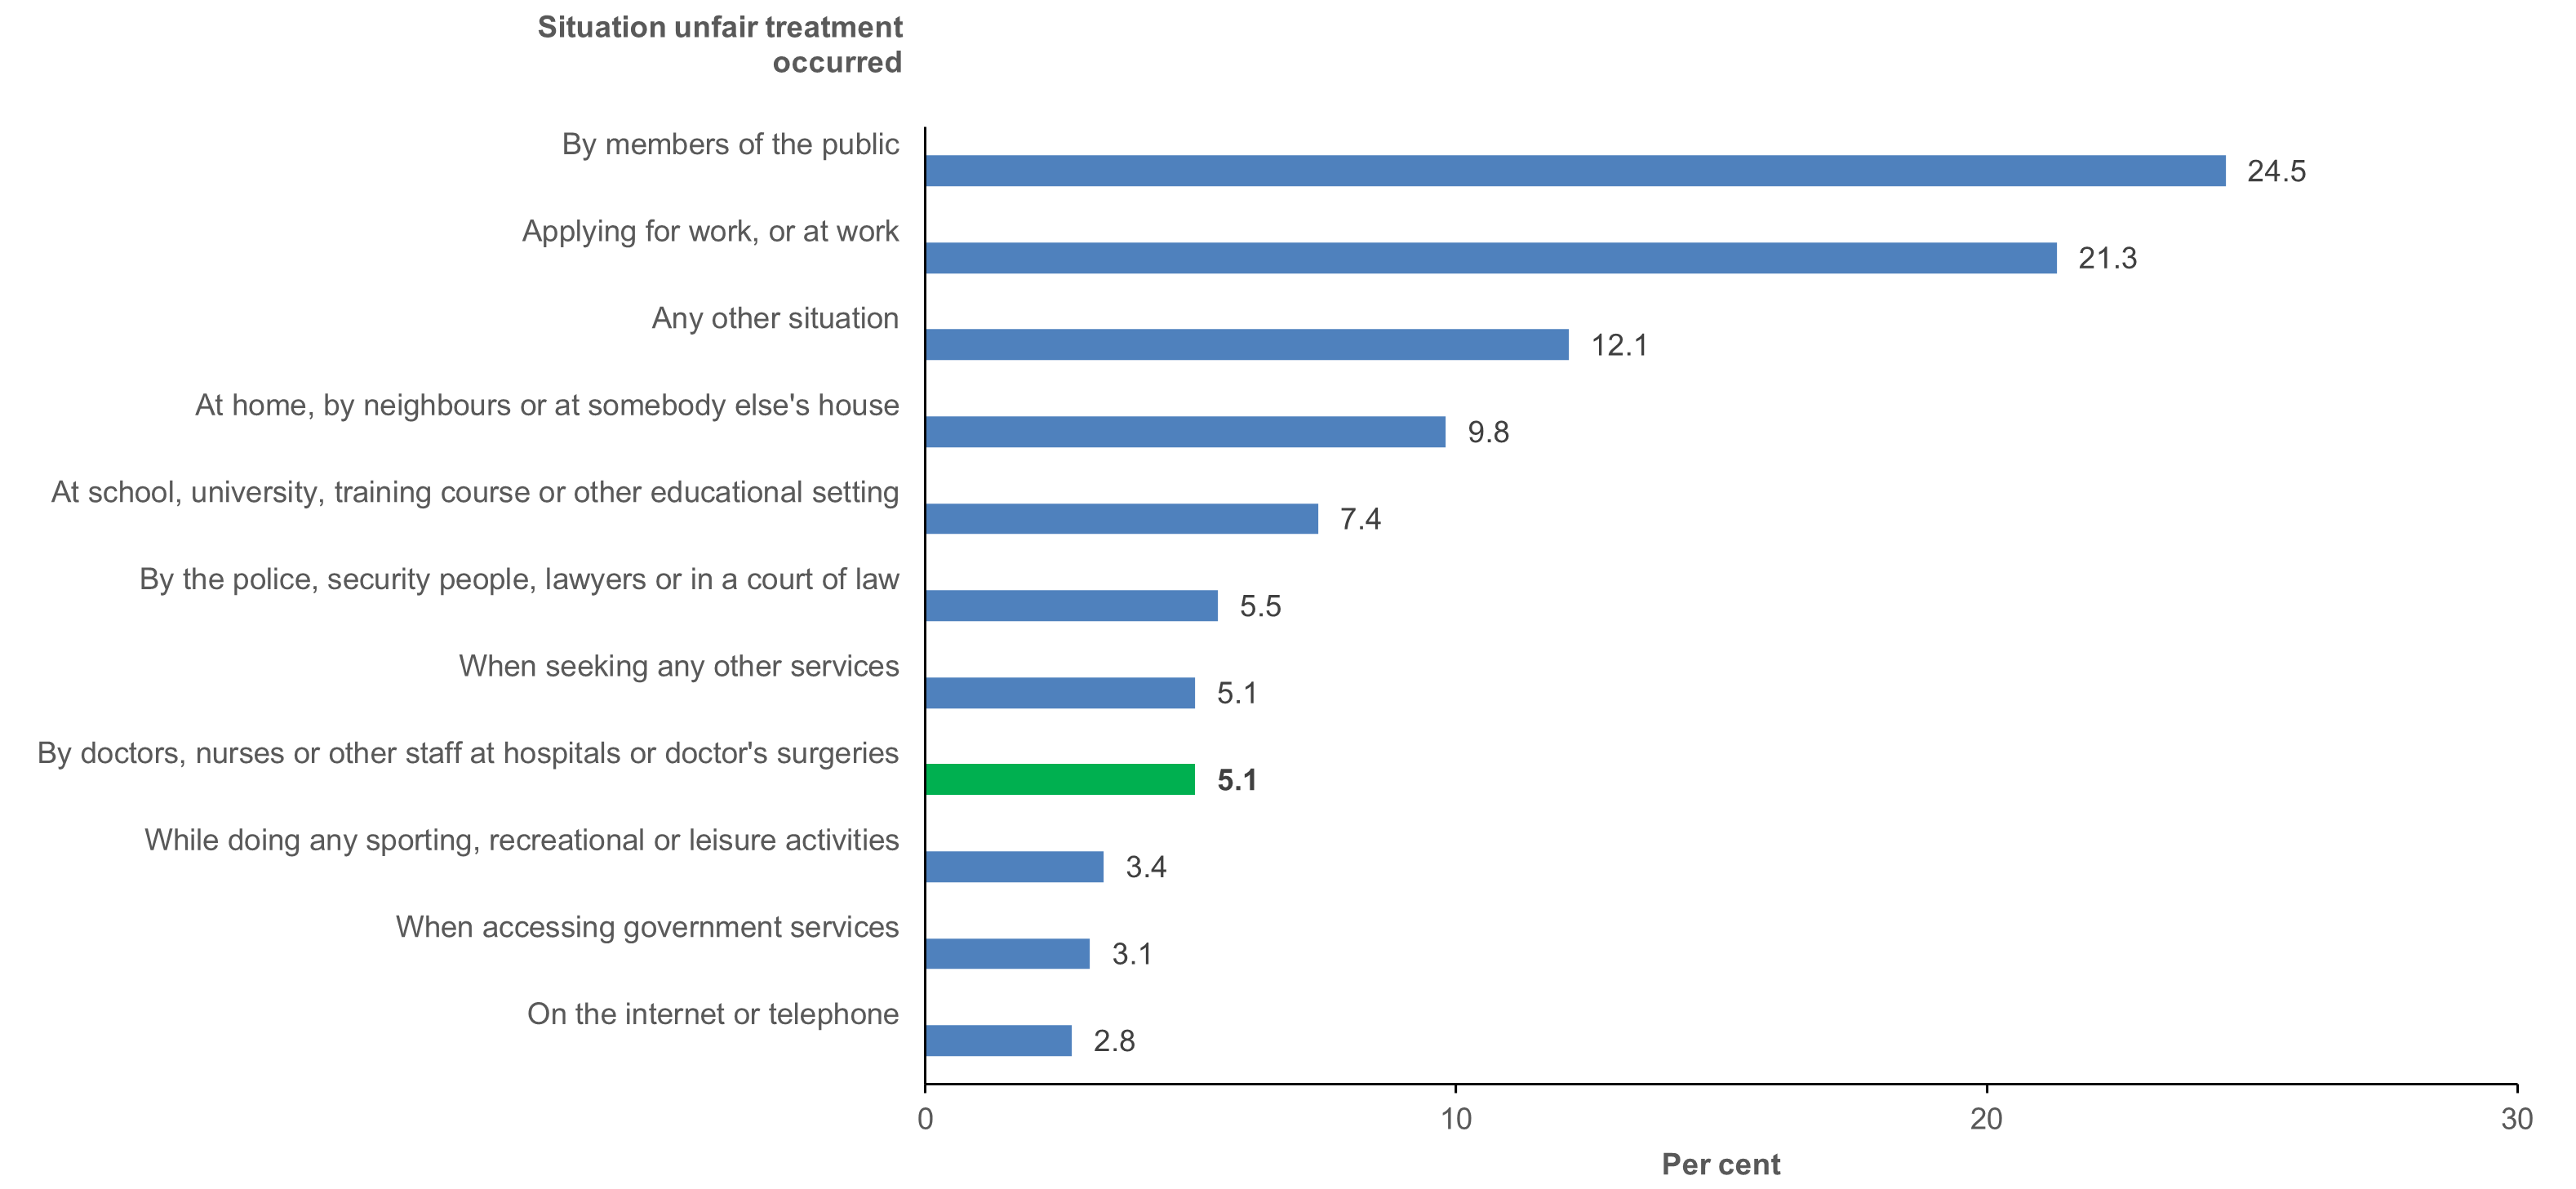
The most frequent experiences of unfair treatment were by members of the public, and when either applying for work or at work. Unfair treatment by doctors, nurses or other staff at hospitals or doctors’ surgeries was experienced by 5,900 respondents (highlighted in green) (Figure 2.11).
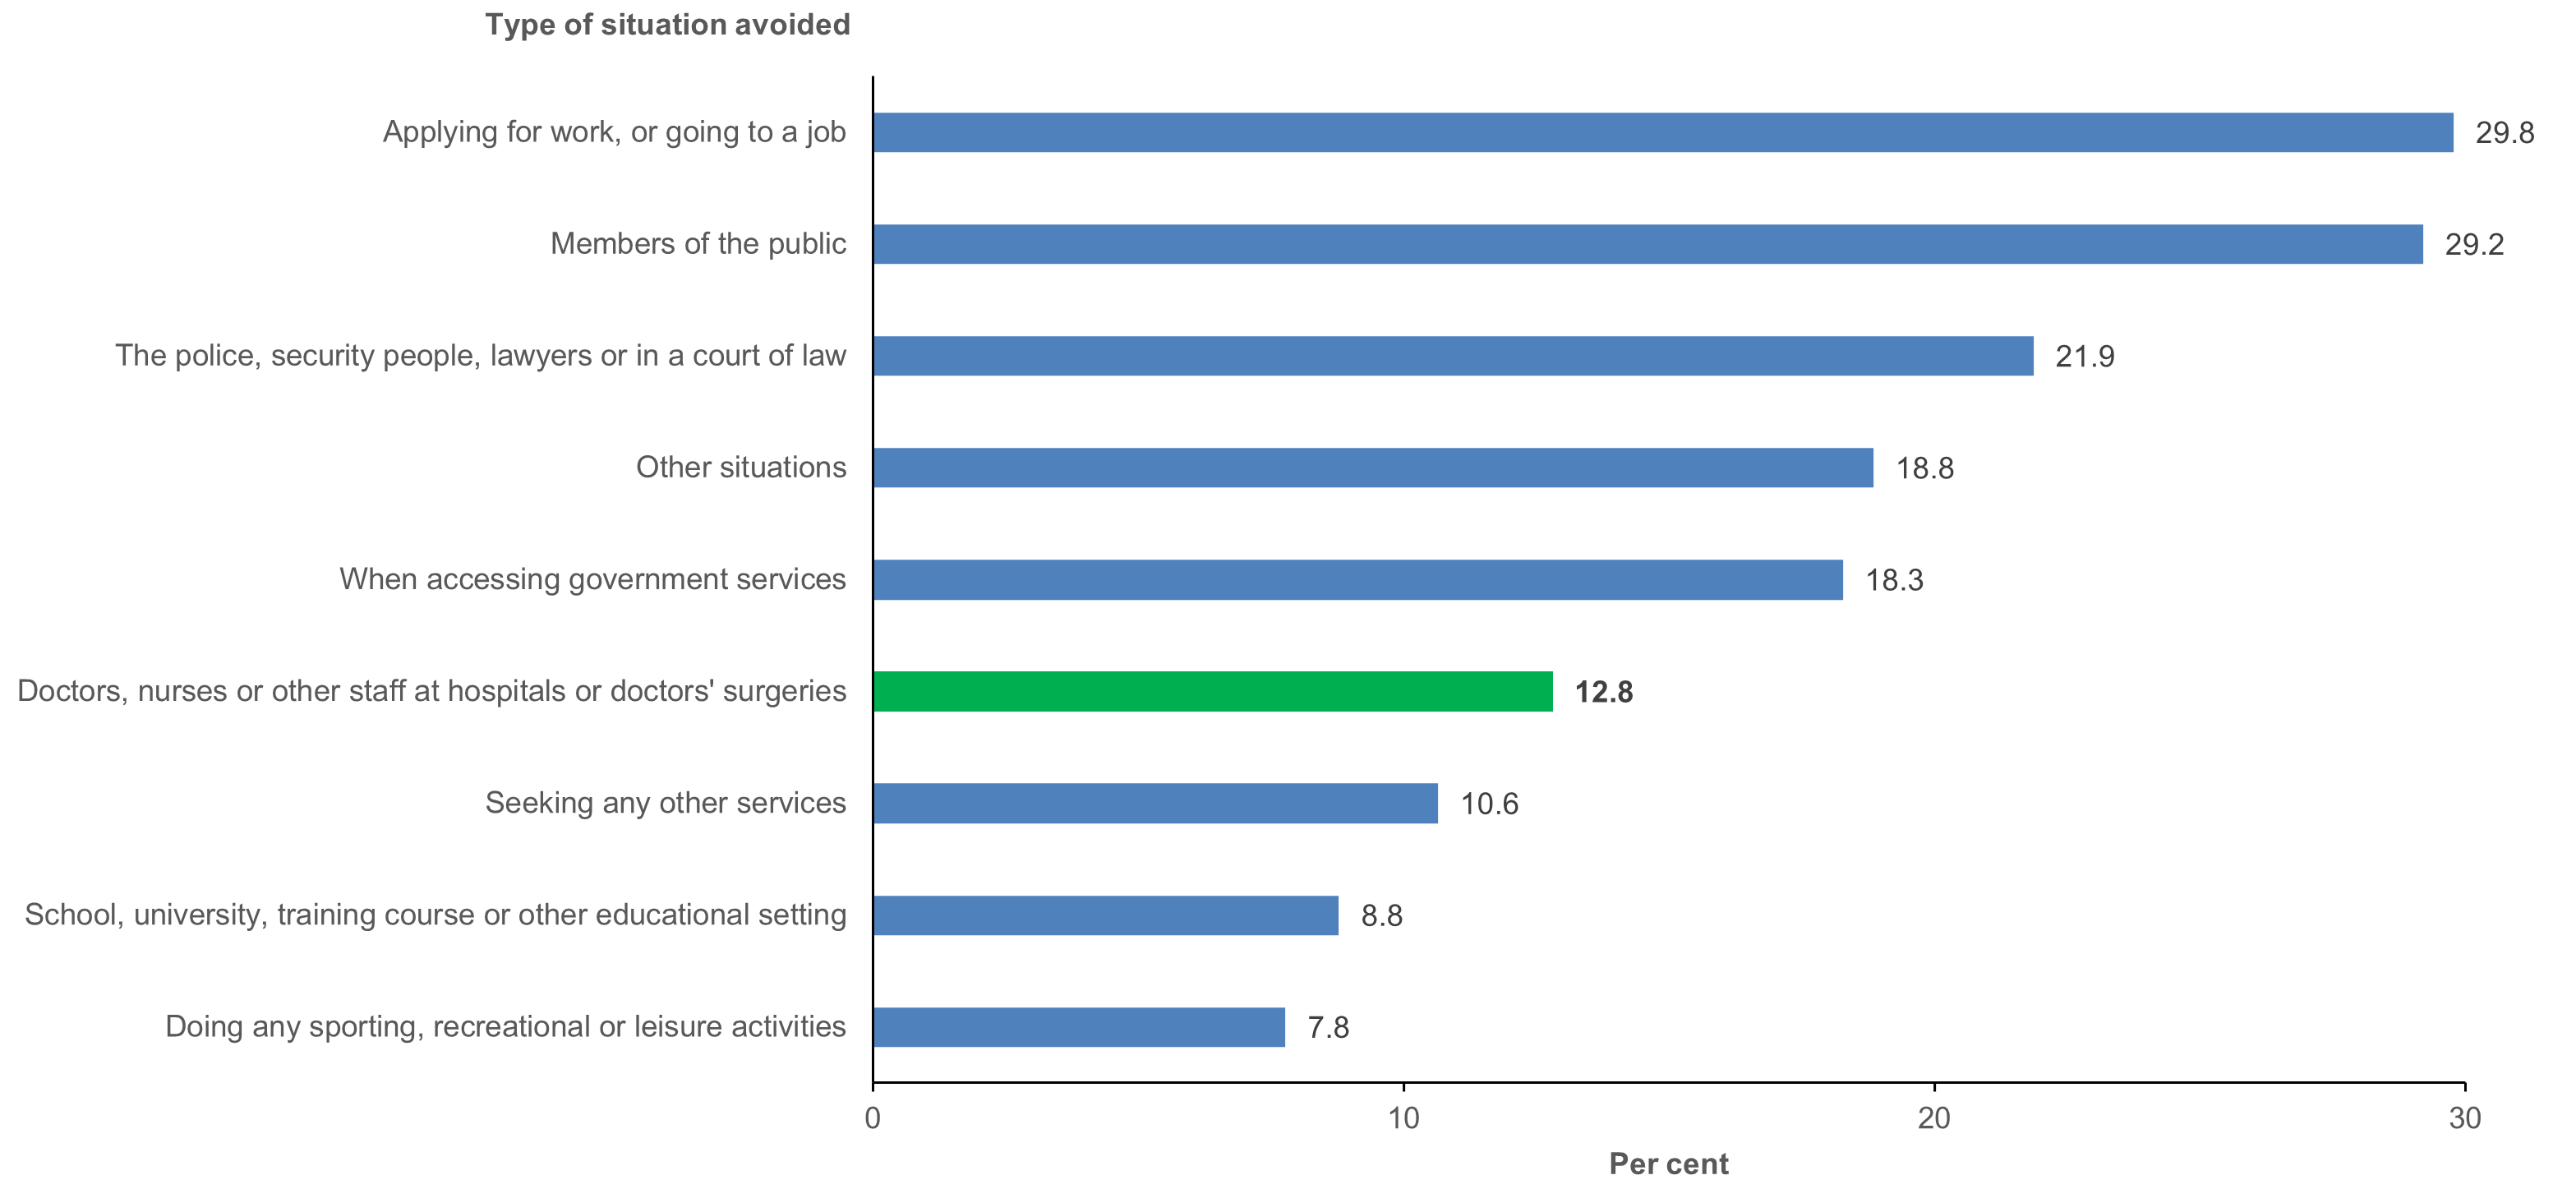
Avoiding situations because of past unfair treatment is another example of the long-term impact of exposure to discrimination and racism. Nearly 70,000 of those responding to the question (14%) reported that they had avoided situations in the past 12 months because of previously experiencing unfair treatment.
Among those who had avoided situations in the past 12 months, applying for work or going to a job and members of the public were the most frequently avoided situations (Figure 2.12). Nearly 13% reported avoided doctors, nurses or other staff at hospitals or doctors’ surgeries (highlighted in green, 8,900 respondents).
- While the numbers were too small to look at the impact of each individual type of experience, situation, and whether people avoided situations because of unfair treatment, we have presented these here for context and to highlight their importance. Only the broad indicator of whether someone experienced unfair treatment was included in the analyses.
Figure 2.10: Types of unfair treatment experienced in the past 12 months among Aboriginal and Torres Strait Islander people aged 15 and over who had experienced at least one incident of unfair treatment (n=116,200), 2018–19
Notes
- Only includes those aged 15 and over who were physically present at the time of the interview.
- Respondents were asked to tick all the types they had experienced.
- The numbers beside the bars are percentages. Percentages based only on those who reported that they had experienced at least one incident in the past 12 months.
Source: AIHW analysis of 2018–19 NATSIHS (ABS 2019) using TableBuilder.
Figure 2.11: Situation in which the most recent experience of unfair treatment occurred, among Aboriginal and Torres Strait Islander people aged 15 and over who had experienced at least one incident in the past 12 months (n=116,200), 2018–19
Notes
- Only includes those aged 15 and over who were physically present at the time of the interview.
- Respondents were asked to tick all the types they had experienced.
- The numbers beside the bars are percentages. Percentages based only on those who reported that they had experienced at least one incident in the past 12 months.
Source: AIHW analysis of 2018–19 NATSIHS (ABS 2019) using TableBuilder.
Figure 2.12: Type of situation(s) avoided among Aboriginal and Torres Strait people aged 15 and over who avoided a situation due to unfair treatment in last 12 months (n=69,700), 2018–19
Notes
- Only includes those aged 15 and over who were physically present at the time of the interview.
- Respondents were asked to tick all the situations that they had avoided.
- The numbers beside the bars are percentages. Percentages based only on those who reported that they had avoided at least one situation in the past 12 months.
Source: AIHW analysis of 2018–19 NATSIHS (ABS 2019) using TableBuilder.
Health/disability status
For Aboriginal and Torres Strait Islander people, health is a multidimensional concept (Dudgeon et al. 2014; Gee et al. 2014) and is directly affected by the other 3 domains (demographic/location factors, social determinants and social capital, and cultural factors).
For this project, several variables were selected that capture different aspects of health:
- self-assessed health status
- level of psychological distress as measured by the K5, a subset of the Kessler Psychological Distress Scale –10 (K10) which was developed with Aboriginal and Torres Strait Islander stakeholders in 2003 (Brinckley et al. 2021)
- whether the respondent has any ongoing or long-term health conditions and the proportion of respondents who have specific conditions
- the proportion of respondents with chronic conditions, musculoskeletal conditions and respiratory conditions.
We have also included variables on whether respondents have disability and, if so, the type and the status (impact) of that disability (see Appendix 2, Table A2.4 and Table A2.5).
Health and disability status are associated with the need for primary health care (and the types/frequency of particular services). For example, best practice guidelines for those people with type 2 diabetes recommend relatively frequent contact with a wide range of primary and allied health care services to effectively manage and monitor their illness, such as GPs, practice nurses and Aboriginal Health Workers/practitioners as well as dieticians and podiatrists.
Health status can also affect a person’s ability to access the services they need, with previous research showing that those with chronic conditions often have difficulties accessing care (Bailie et al. 2015; Coombes et al. 2018).
Self-assessed health status
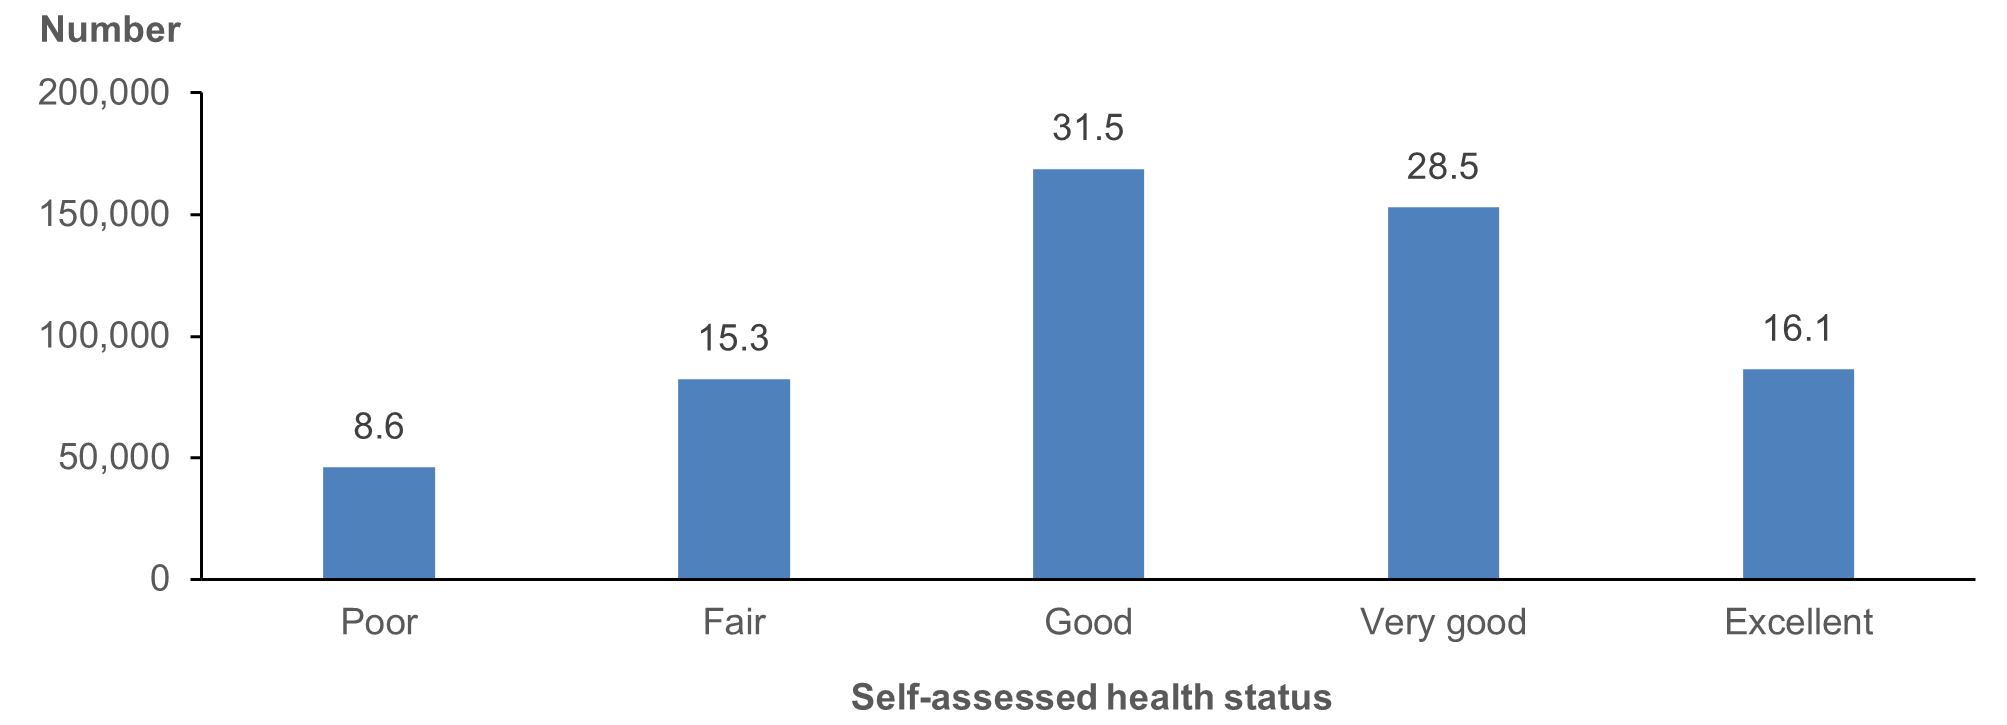
Around 60% of those aged 15 and over say their health is either good or very good (321,800), and the proportion who self-identify as having excellent health is nearly twice that of those reporting that their health is poor (16% versus 8.6%; 86,300 people compared with 46,000) (Figure 2.13).
Figure 2.13: Distribution of self-assessed health status, Aboriginal and Torres Strait Islander people aged 15 and over, 2018–19
Note: The numbers above the column bars are percentages.
Source: AIHW analysis of 2018–19 NATSIHS (ABS 2019) using TableBuilder.
Psychological distress
The significance of psychological wellbeing/distress is also highlighted in the results from the K5, which shows that around one-third (32%, 149,400) of adult respondents with valid responses had high or very high levels of psychological distress, with 322,400 having low or moderate scores (68%).
Current and long-term health conditions
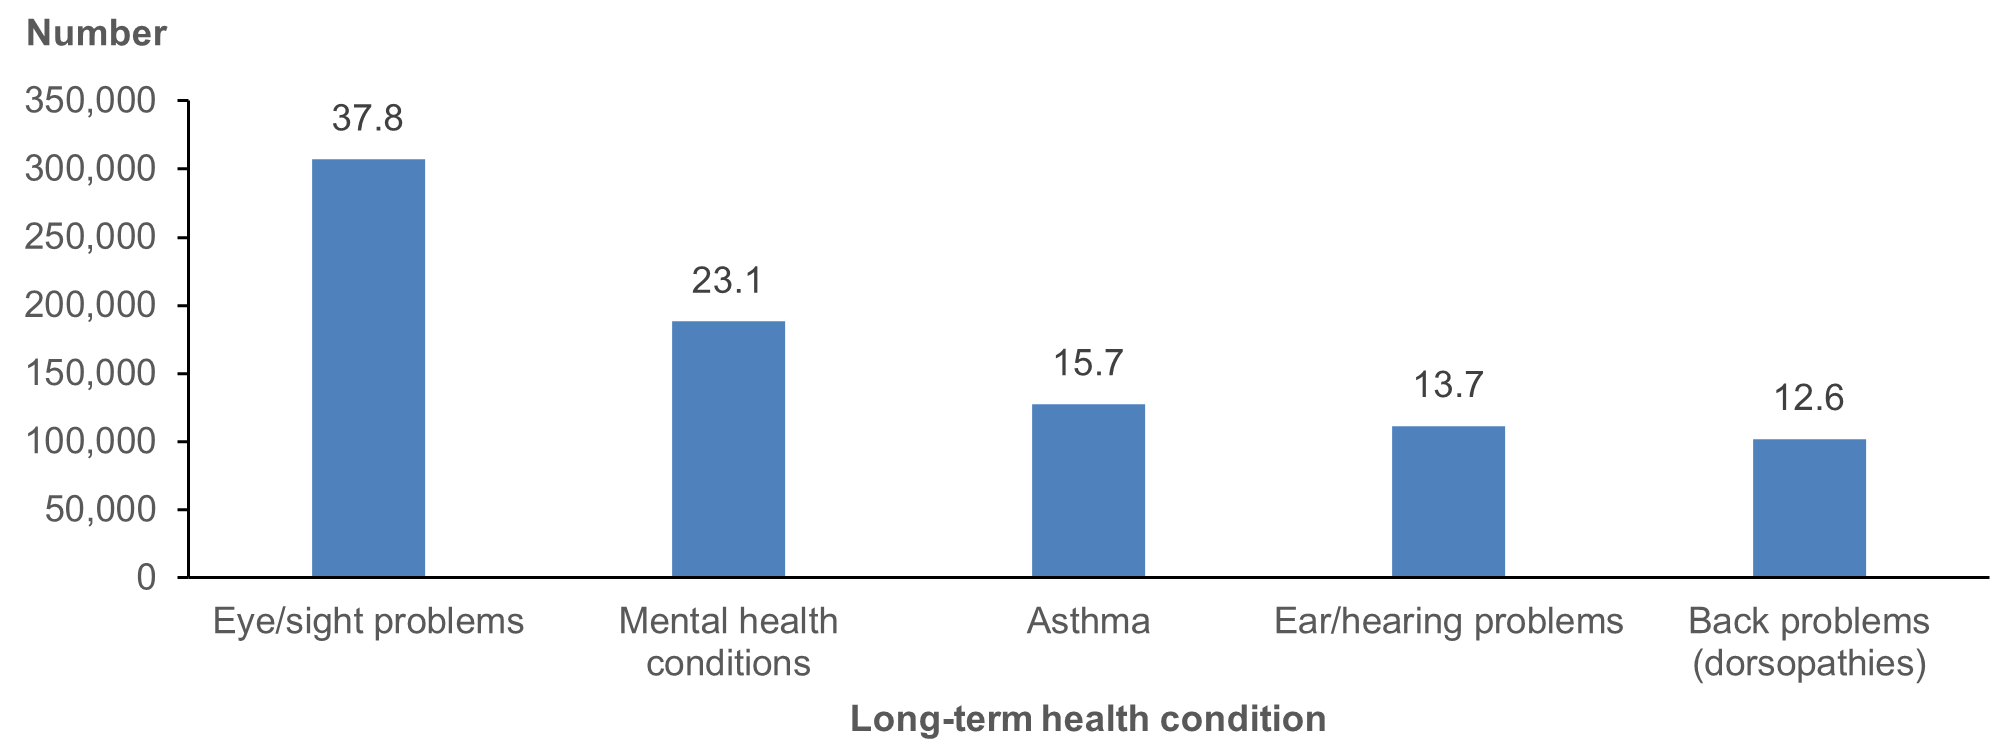
According to the responses to the 2018–19 NATSIHS, just under 60% of Aboriginal and Torres Strait Islander people (483,500) had at least one current and long-term health condition. Eye/sight problems were reported most often, followed by mental health conditions, asthma and ear/hearing problems (Figure 2.14).
Figure 2.14: Presence of specific long-term health conditions among Aboriginal and Torres Strait Islander people, 2018–19
Notes
- Respondents could tick as many conditions as applicable.
- The numbers above the column bars are percentages.
Source: AIHW analysis of 2018–19 NATSIHS (ABS 2019) using TableBuilder.
Aggregated long-term condition types
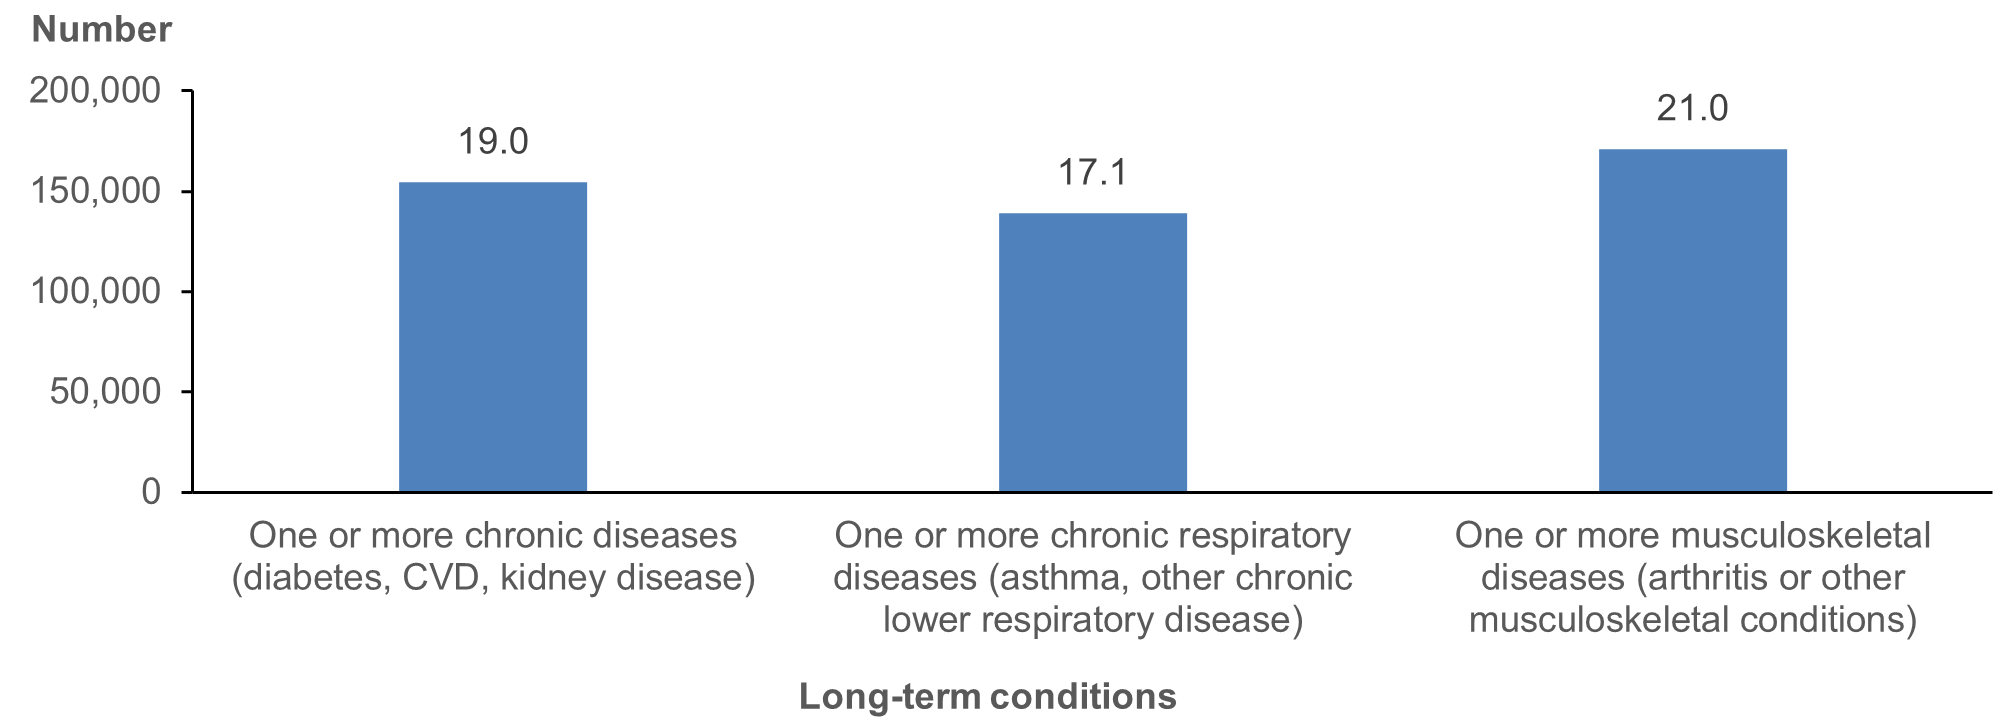
The responses to the individual condition types were further grouped into 3 broader categories – chronic diseases, chronic respiratory diseases, and musculoskeletal conditions.
The findings show that just under 20% of Aboriginal and Torres Strait Islander people (154,500) had one or more chronic diseases (diabetes, CVD, kidney disease), 17% (139,000) had one or more chronic respiratory diseases (asthma, other chronic lower respiratory disease) and 21% (171,000) had one or more musculoskeletal diseases (arthritis or other musculoskeletal conditions) (Figure 2.15).
Figure 2.15: Categories of long-term health conditions among Aboriginal and Torres Strait Islander people, by type, 2018–19
Notes
- CVD = cardiovascular disease.
- The numbers above the column bars are percentages.
Source: AIHW analysis of 2018–19 NATSIHS (ABS 2019) using TableBuilder.
Disability
According to the responses to the 2018–19 NATSIHS, over 300,000 Aboriginal and Torres Strait Islander people had disability (38%). Among these, 39% had physical disability (118,100), 25% (76,200) reported that their disability centred on sight/hearing/speech, with the remainder reporting psychological, other, and intellectual disability (Figure 2.16).
Figure 2.16: Distribution of disability among Aboriginal and Torres Strait Islander people, by main disability type, 2018–19
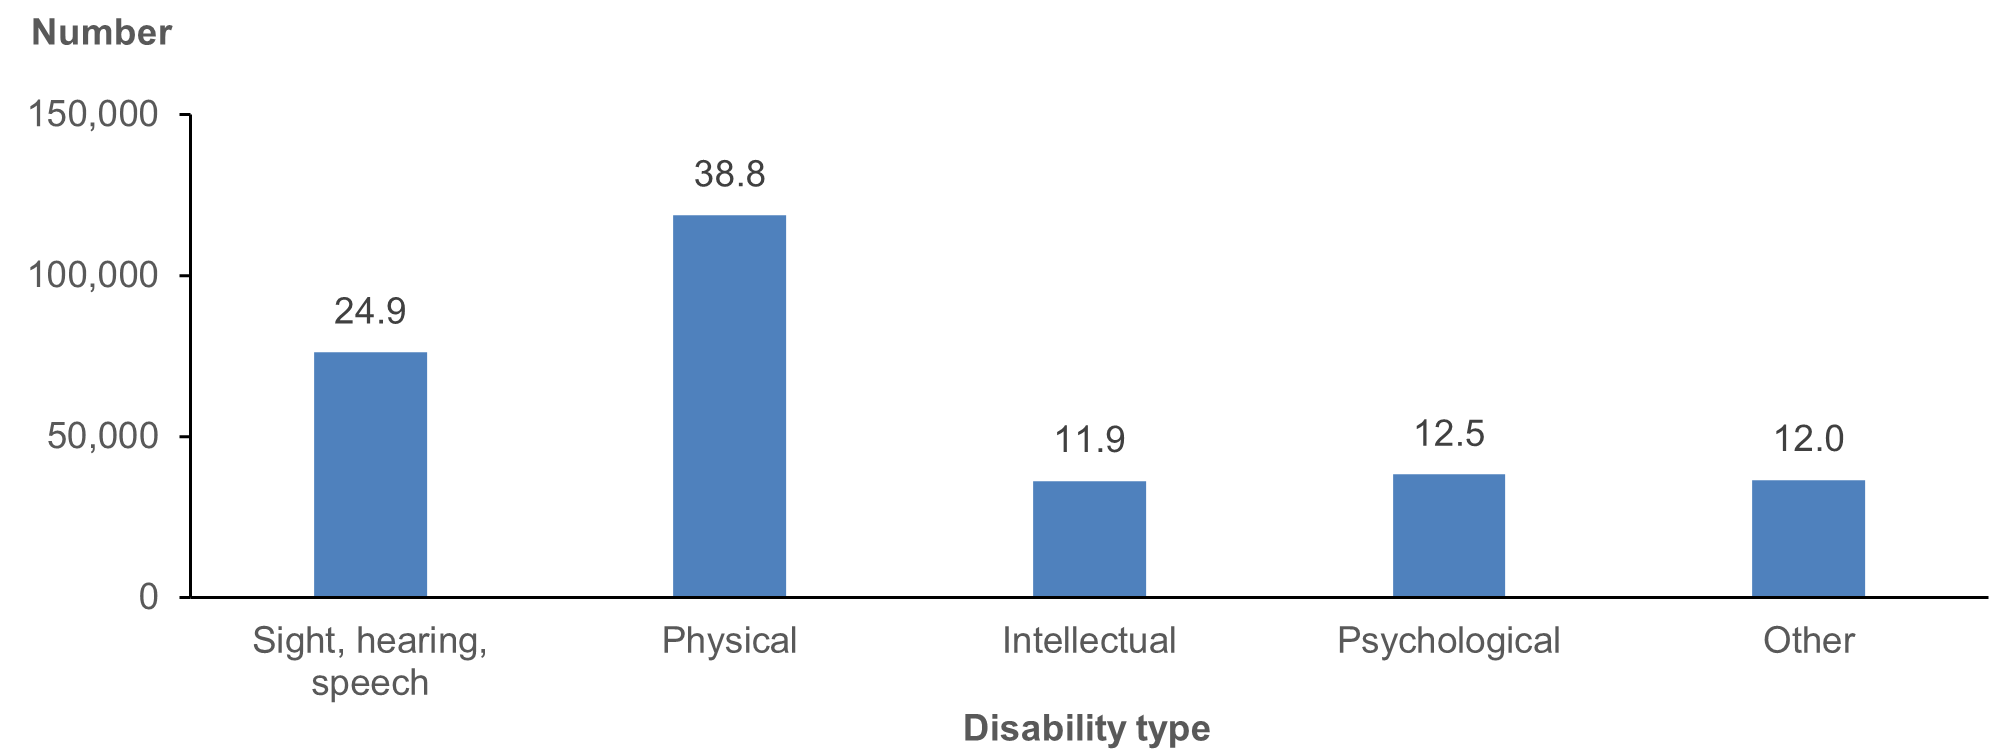
Note: The numbers above the column bars are percentages.
Source: AIHW analysis of 2018–19 NATSIHS (ABS 2019) using TableBuilder.
Of the 300,000 people reporting disability:
- 28% had no limitation or specific restrictions
- 16% had a school/employment restriction only
- 35% had a mild or moderate core activity limitation
- 22% had a severe/profound core activity limitation (Figure 2.17).
Figure 2.17: Aboriginal and Torres Strait Islander people with disability, by disability status, 2018–19
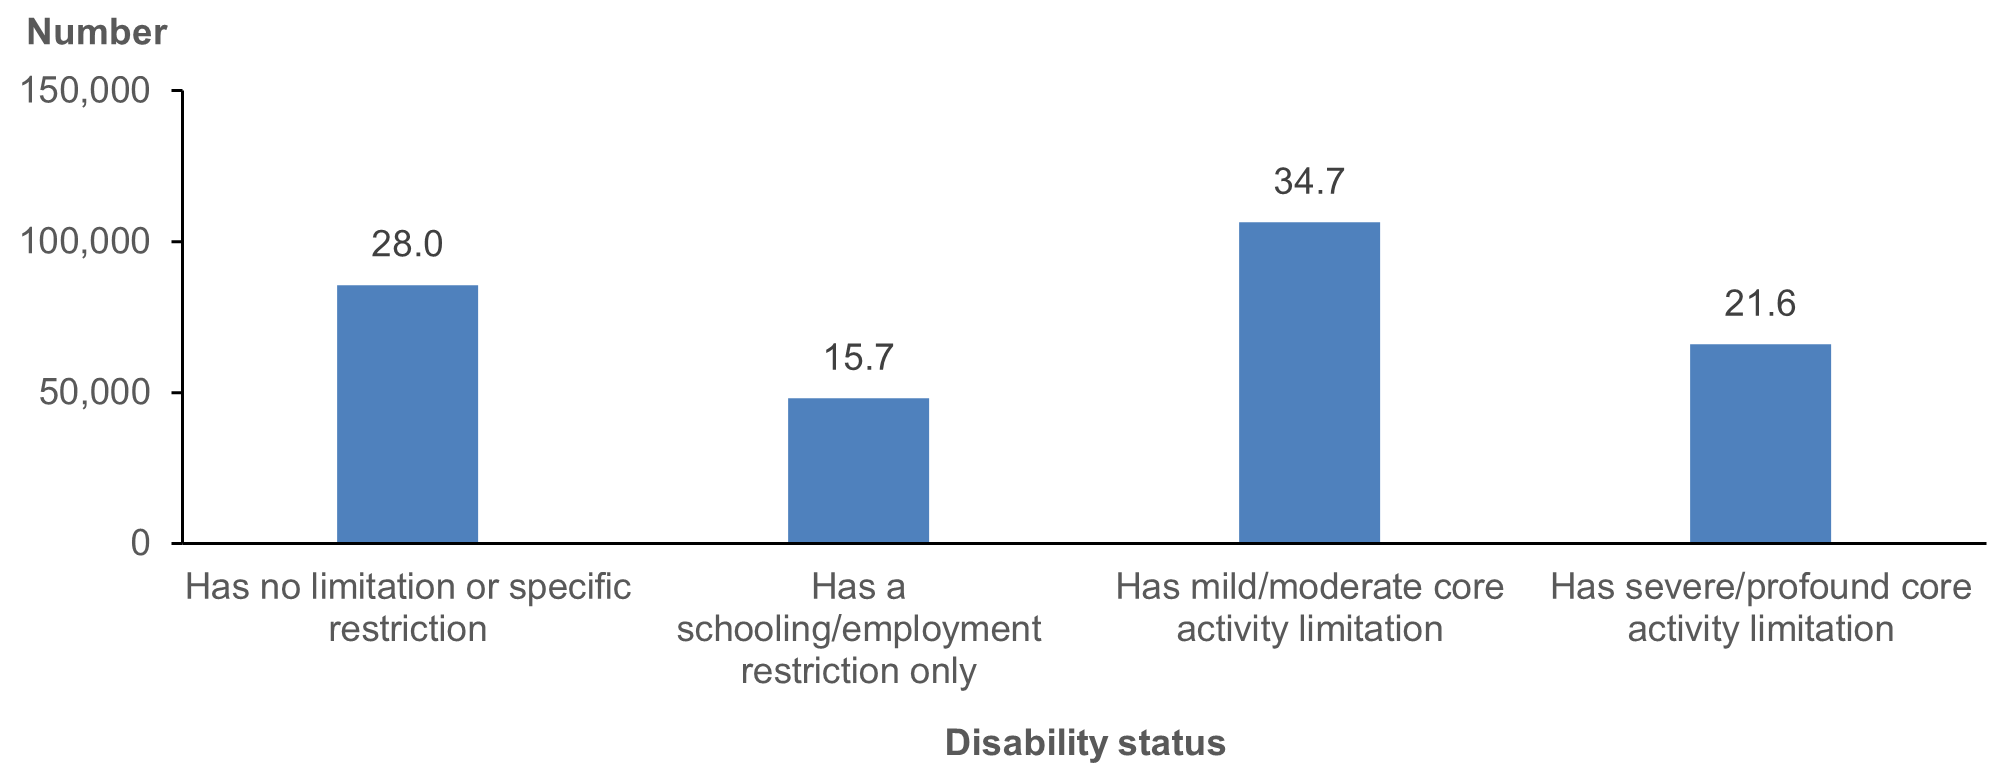
Note: The numbers above the column bars are percentages.
Source: AIHW analysis of 2018–19 NATSIHS (ABS 2019) using TableBuilder.
The next chapters in this report look at how these factors are associated with self-reported primary care service availability, use and unmet needs.