Experiences with the health care system
The set of questions in the NATSIHS that relate to respondents’ experiences and satisfaction with the health care they receive were mainly asked only of those aged 15 and over who were present at the interview and who live outside remote areas.
Rating of overall health care received (non-remote only)
Respondents aged 15 and over living outside remote areas and who were present at the interview were asked to rate how good they felt the health care they got from GPs and other health services was in the last 12 months.
The majority of the included respondents rated their health care quite highly, with nearly 75% rating it very good or excellent (Figure 5.11). Fewer than 3% of included respondents rated it as poor.
Figure 5.11: Aboriginal and Torres Strait Islander people, rating of health care received in the past 12 months, 2018–19
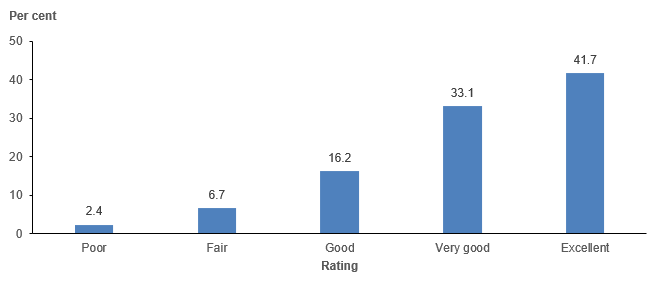
Note: Includes only those aged 15 and over who were physically present at the time of the interview and lived in non-remote areas.
Source: AIHW analysis of 2018–19 NATSIHS (ABS 2019) using TableBuilder.
Disaggregation by usual source of care (AMS/CC and mainstream GPs) showed little difference in overall rating of health care.
Experiences with own GP(s) (non-remote only)
Respondents aged 15 and over who were physically present at the interview and who lived outside remote areas were asked to rate, in the past 12 months, how often their GP(s):
- explained things in a way they could understand
- listened to them
- showed respect for what they had to say
- spent enough time with them.
Overall, respondents rated their experiences with their GPs quite highly (Table 5.3).
In the last 12 months, how often did GP(s) | Never | Rarely | Sometimes | Usually | Always | Total |
|---|---|---|---|---|---|---|
Explain things clearly | 4,800 (1.4%) | 12,600 (3.7%) | 24,500 (7.1%) | 62,400 (18.1%) | 239,700 (69.7%) | 344,000 (100%) |
Listen | 4,600 (1.3%) | 8,000 (2.3%) | 26,200 (7.6%) | 57,500 (16.7%) | 247,000 (71.9%) | 343,300 (100%) |
Show respect | 2,700 (0.8%) | 7,400 (2.2%) | 20,500 (6.0%) | 52,100 (15.2%) | 260,700 (75.9%) | 343,400 (100%) |
Spend enough time | 5,800 (1.7%) | 14,600 (4.3%) | 22,400 (6.5%) | 61,700 (18.0%) | 238,900 (69.6%) | 343,400 (100%) |
Note: Questions only asked of those aged 15 and over who were physically present at the interview and lived in non-remote areas.
Source: AIHW analysis of 2018–19 NATSIHS (ABS 2019) using TableBuilder.
Nearly 90% of respondents felt their GPs usually or always explained things in a way they could understand, spent enough time with them, and listened to them, while over 90% felt they usually or always showed respect for what they had to say (Figure 5.12).
Figure 5.12: Aboriginal and Torres Strait Islander people aged 15 and over in non-remote areas, proportion responding ‘always’ to aspects of their experiences with their GPs, by usual source of care, 2018–19
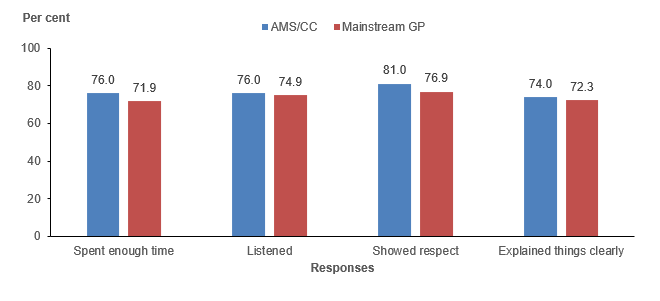
Note: Includes only those who always used the same source of care.
Source: AIHW analysis of 2018–19 NATSIHS (ABS 2019) using TableBuilder.
While those with a consistent source of care were likely to rate their GPs highly (by giving them a score of ‘always’ on the 4 aspects), the proportions were higher for those who always used an AMS/CC than for those who always used a mainstream GP, with 81% saying their GP always showed respect in their interactions.
Co-pay for care and unfilled scripts (non-remote only)
One area where there were large differences in respondents’ experiences by usual source of health care was in the payments required for consultations with specialists, with other health providers, and the likelihood of not filling a prescription (Figure 5.13).
Figure 5.13: Aboriginal and Torres Strait Islander people, co-payments at last consultation, by type of provider and unfilled scripts and usual source of health care, 2018–19
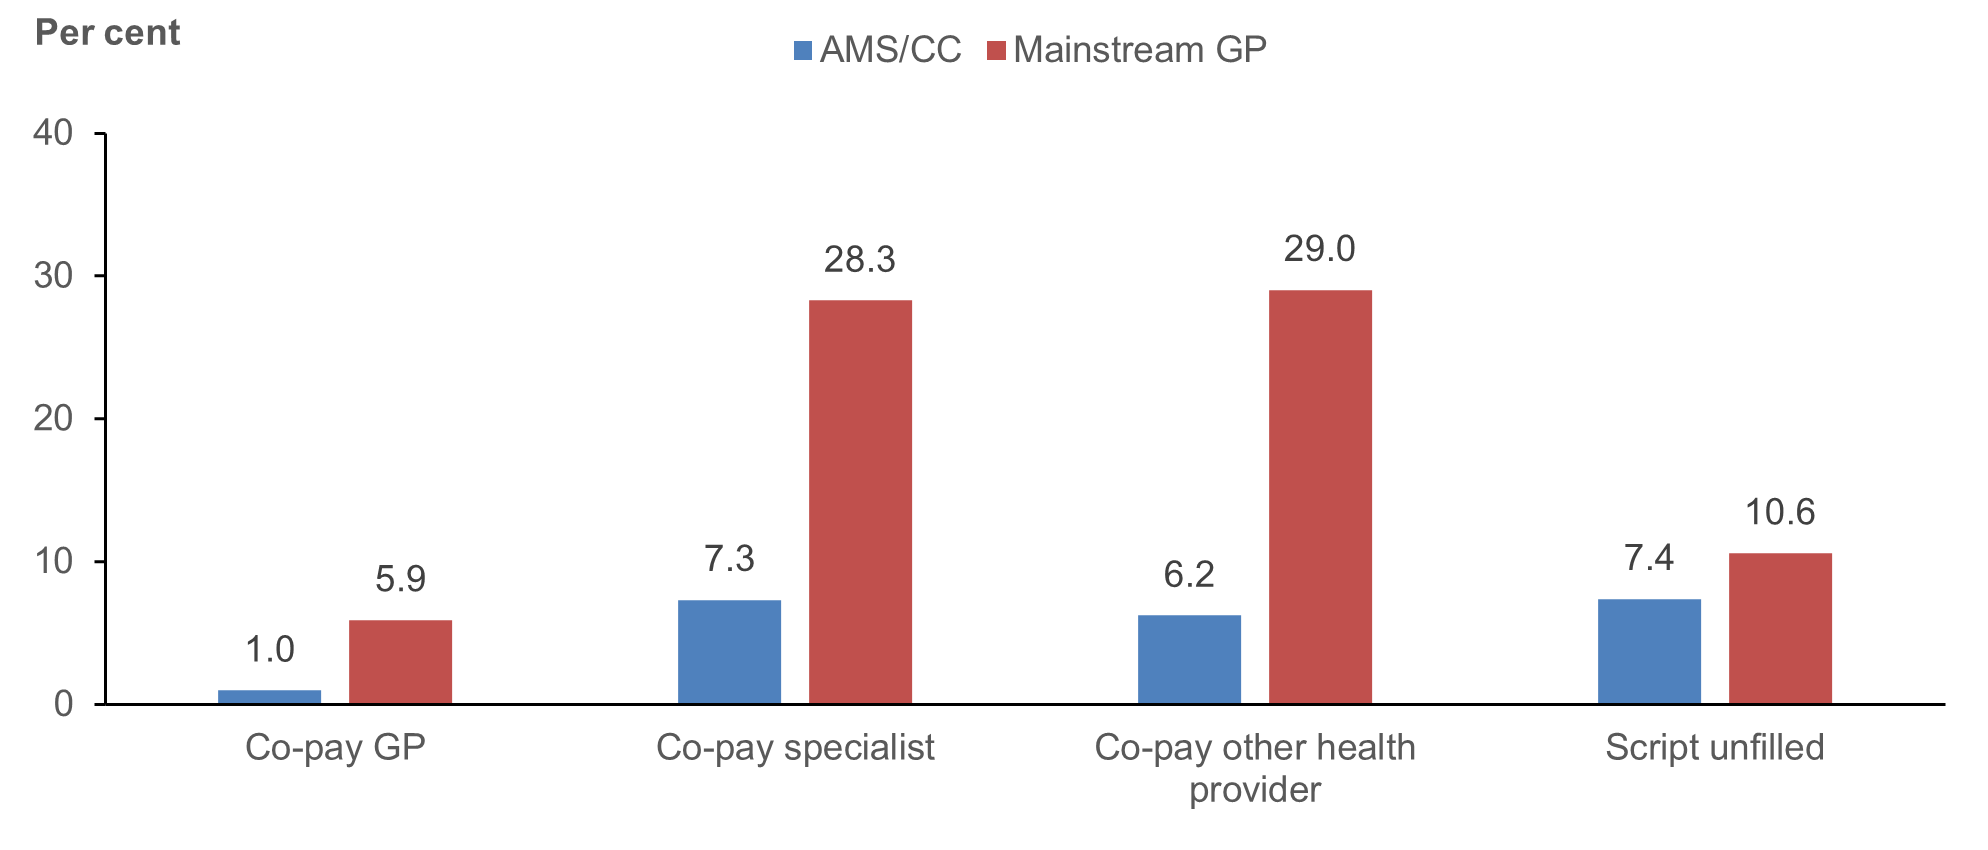
Notes
- Includes only non-remote areas.
- Percentages are calculated on the number of respondents who had a consultation with the provider in the past 2 weeks.
Source: AIHW analysis of 2018–19 NATSIHS (ABS 2019) using TableBuilder.