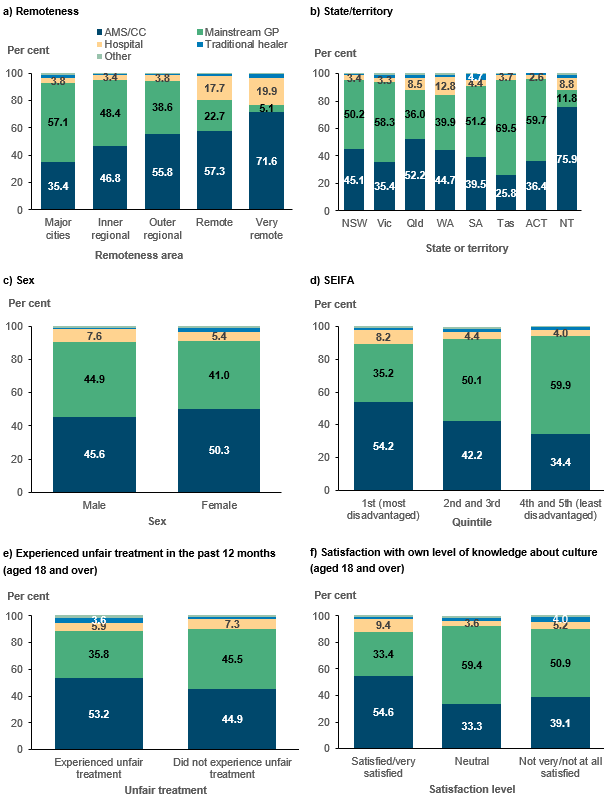
Preference for an AMS/CC was also higher among those who had experienced unfair treatment/discrimination in the past 12 months (53% compared with 45% of those who had not experienced unfair treatment), highlighting the importance of culturally safe care. Preference was also higher among those who were more satisfied with their own knowledge about their culture (55%) than among those who were neutral (33%) or not very/not at all satisfied (39%).
Preferences are also related to service availability – for example, the availability of AMS/CC is highest in more remote areas, as is preference for AMS/CCs, while the opposite pattern is seen for mainstream GPs. This relationship is seen at the local level (Table 4.1) – among the nearly 108,000 Aboriginal and Torres Strait Islander people with only an AMS/CC in their area, 82% listed that as their preferred source, while 12% preferred a hospital, and 3.1% a mainstream GP.
Table 4.1: Aboriginal and Torres Strait Islander people, preferred source of care, by primary care services in local area, 2018–19Primary care in area | AMS/CC | Main-stream GP | Hospital | All others | Total |
|---|
AMS/CC only | 88,867 (82.4%) | 3,393 (3.1%) | 13,391 (12.4%) | 2,209 (2.0%) | > 107,860 (100%) |
Both AMS/CC and mainstream GP | 225,557 (51.3%) | 179,914 (40.9%) | 25,245 (5.7%) | 8,988 (2.0%) | 439,704 (100%) |
GP only | 72,140 (28.9%) | 160,670 (64.4%) | 8,390 (3.4%) | 8,332 (3.3%) | 249,532 (100%) |
Neither | 3,774 (22.0%) | 6,163 (35.9%) | 5,808 (33.9%) | 1,402 (8.2%) | 17,147 (100%) |
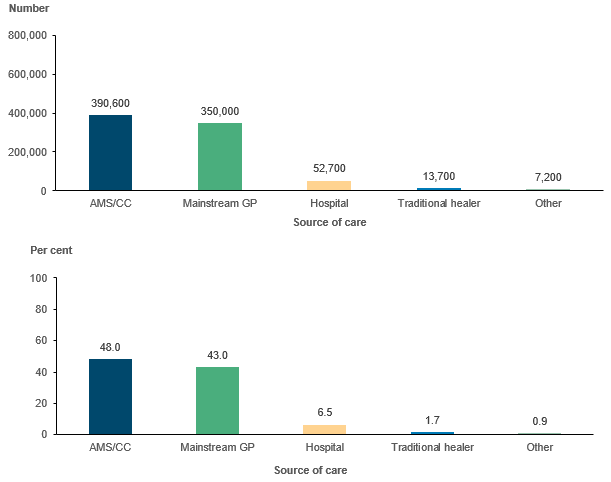
Total | 390,339 (47.9%) | 350,140 (43.0%) | 52,834 (6.5%) | 20,931 (2.6%) | 814,244 (100%) |
Note: Data are weighted frequencies.
Source: AIHW analysis of 2018–19 NATSIHS (ABS 2019) using DataLab.
When both an AMS/CC and a mainstream GP were in people’s local areas, 51% preferred an AMS/CC and another 41% preferred a mainstream GP. When only a mainstream GP was in their local area, 64% cited that as their preferred type. However, 29% of those in areas with only mainstream GPs expressed a preference for an AMS/CC. An estimated 76,000 Aboriginal and Torres Strait Islander people had a preference for an AMS/CC, but did not have one in their local area.
Modelling preference for an AMS/CC
In order to look at the impact of variables from all 4 domains (plus local availability) on preference for an AMS/CC compared with all other service types, we ran a series of multivariate logistic regression models on those aged 18 and over.1
- Model 1 includes demographic and location variables only
- Model 2 is Model 1 + socioeconomic status/social capital + cultural/unfair treatment
- Model 3 is Model 2 + health status/disability
- Model 4 is Model 3 + GP services in local area by type.
The results (odds ratios) from 4 models are presented in Table 4.2. Odds ratios over 1 indicate a higher likelihood of preferring an AMS/CC relative to the omitted category, while odds ratios under 1 indicate a lower likelihood, holding all other variables constant. The cells are colour coded by level of statistical significance, making it easier to visualise any changes in statistical significance when new sets of variables are introduced into the model.
Findings by domain
Location and demographic variables
The findings for the location and demographic variables show that, holding other variables constant:
- males are consistently less likely than females to prefer an AMS/CC (odds ratio of 0.8)
- people aged 55–64 and 65 and over are less likely than those aged 18–24 to prefer an AMS/CC (odds ratios of 0.6 and 0.4, respectively)
- SEIFA is not statistically significant
- all categories of remoteness are statistically significant until Model 4 – that is, once local area availability of an AMS/CC is controlled for, remoteness itself is no longer significant (signalling that it was likely a proxy variable for availability)
- those in the Northern Territory are 1.4 times as likely to prefer an AMS/CC as those in New South Wales, while those in South Australia and Tasmania are less likely to prefer an AMS/CC than those in New South Wales.
Socioeconomic and social capital
Once other variables in the modelled are controlled for:
- equivalised household income is not statistically significant, although those who could raise $2,000 in an emergency were 0.8 times as likely to prefer an AMS/CC as those who could not
- there was no significant effect for labour force status or non-school qualifications, but, compared with those who completed year 12, those whose highest completed year of high school was year 10 or 11 were 1.3 times as likely to prefer an AMS/CC, and those who finished at year 9 or below were 1.5 times as likely.
Cultural identify and experiences of unfair treatment
- The relationship between having experienced unfair treatment and preference for an AMS/CC holds even after controlling for other variables, with those having experienced it being 1.3 times as likely to prefer an AMS/CC.
- Those who did not identify with any tribal, clan or language group were half as likely to prefer an AMS/CC than those who did identify with at least one.
- There were mixed results for satisfaction with own level of knowledge about culture – in models 2 and 3 those who were not very/not at all satisfied and those who were neutral or did not express an opinion were significantly less likely to prefer an AMS/CC as those who were very satisfied with their own knowledge. Once the availability variables were added to the model, the odds ratio for those who were not very/not all satisfied was no longer significant.
Table 4.2: Logistic regression results (odds ratios) and level of statistical significance, preference for an AMS/CC (compared with any other service) for Aboriginal and Torres Strait Islander people aged 18 and over
See PDF publication p. 43.
Health and disability
None of the included health and disability variables were statistically significant.
Services available in local areas
The strongest predictor of preference for an AMS/CC was having one in a person’s local area. Those who had only an AMS/CC in their area were 5.2 times as likely to prefer an AMS/CC as those without one, and those who had both an AMS/CC and a mainstream GP in their area were 2.3 times as likely to prefer an AMS/CC.