Approach
This project adopted a conceptually-based, multi-faceted approach by bringing together Aboriginal and Torres Strait Islander people’s own lived experiences of primary health care use and their unmet needs (as reflected in the survey data) with an analysis of the current patterns of where primary health services are located relative to where Aboriginal and Torres Strait Islander people live. An overview of the 2 streams of work are presented in figures 1.1 and 1.2.
Overview of the analysis of the 2018–19 NATSIHS
Figure 1.1: Steps for the analysis of the 2018–19 NATSIHS data

A flowchart that presents the 5 steps used for the analysis of the 2018–19 NATSIHS data:
- development of conceptual framework/literature review
- selection of key primary health care and independent variables based on conceptual framework and literature review
- exploratory descriptive analysis (univariate and bi-variate distributions)
- construction of a 4-category service availability variable and descriptive analysis
- logistic regressions on:
- preference for an Aboriginal Medical Service/Community clinic
- ability to use an AMS/CC among those who preferred them.
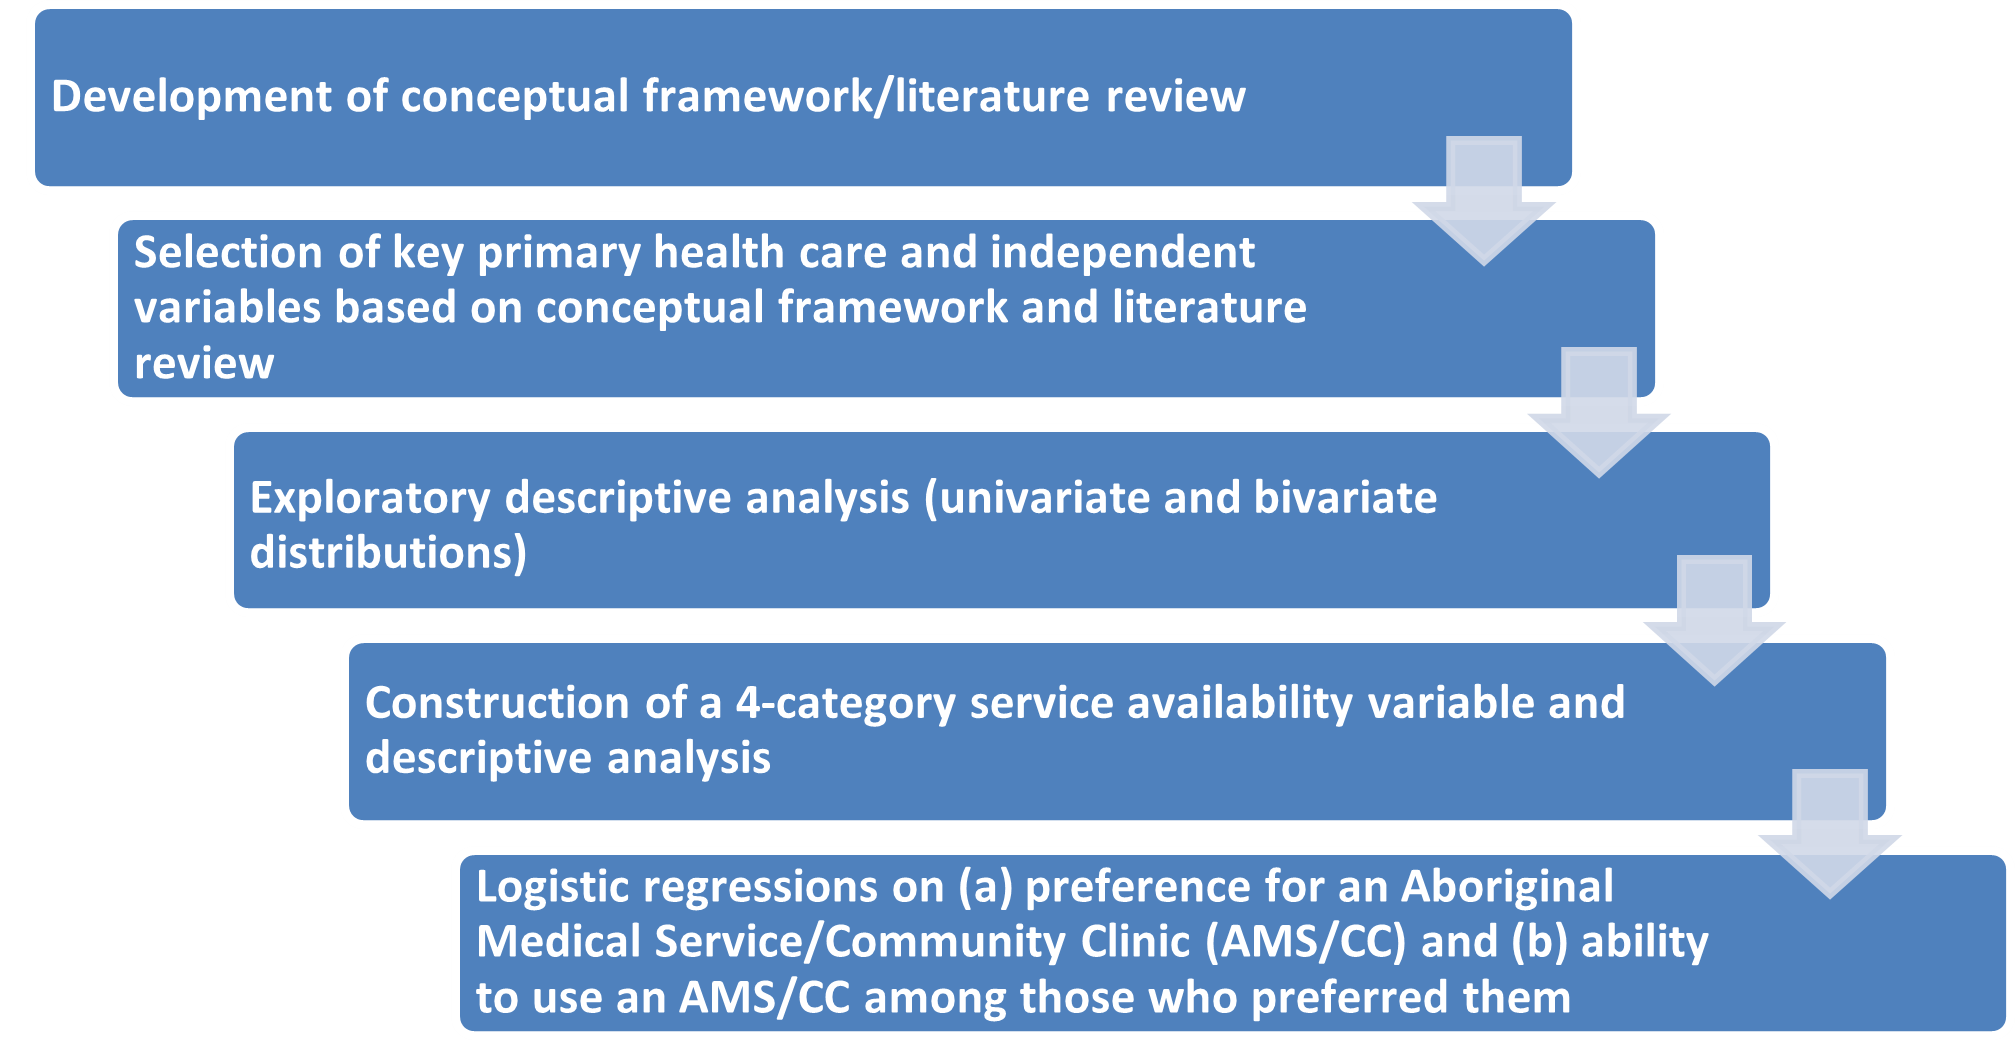
The conceptual framework and literature review were used to drive the selection of the primary health-care variables and independent variables to include in the analyses. Univariate and bi-variate analyses were undertaken using the ABS’s TableBuilder.[1]
One of the key variables in this project is the availability of primary health care services. The 2018–19 NATSIHS asked respondents to tick which ones from a selected list of health services[2] were available in their local area (noting that respondents defined their local areas themselves). This question thus captures perceived availability.
While the analysis in TableBuilder highlights how many people had each type of service in their local area, it cannot be used to look at whether there was more than one type of service in their area.
Using the unit record level data in the ABS’s DataLab environment, a variable was created which assigned respondents to one of 4 categories focusing on the types of GP services in their area:
- AMS/CC[3] only
- mainstream GP (other doctor/GP not from AMS or hospital) only
- both AMS/CC and mainstream GP
- neither AMS/CC nor mainstream GP[4] (no primary health services).[5]
This variable is designed to capture not only the distribution of service availability, but how much choice respondents have in what type of primary health service they use.
Building on the descriptive analyses (which focused on the relationships between individual variables and the primary health variables), the final step used multivariate logistic regression to examine the relative impact of a subset of these variables on 2 selected outcomes:
- preference for an AMS/CC
- whether the respondent was able to use an AMS/CC (among those who expressed a preference for one).
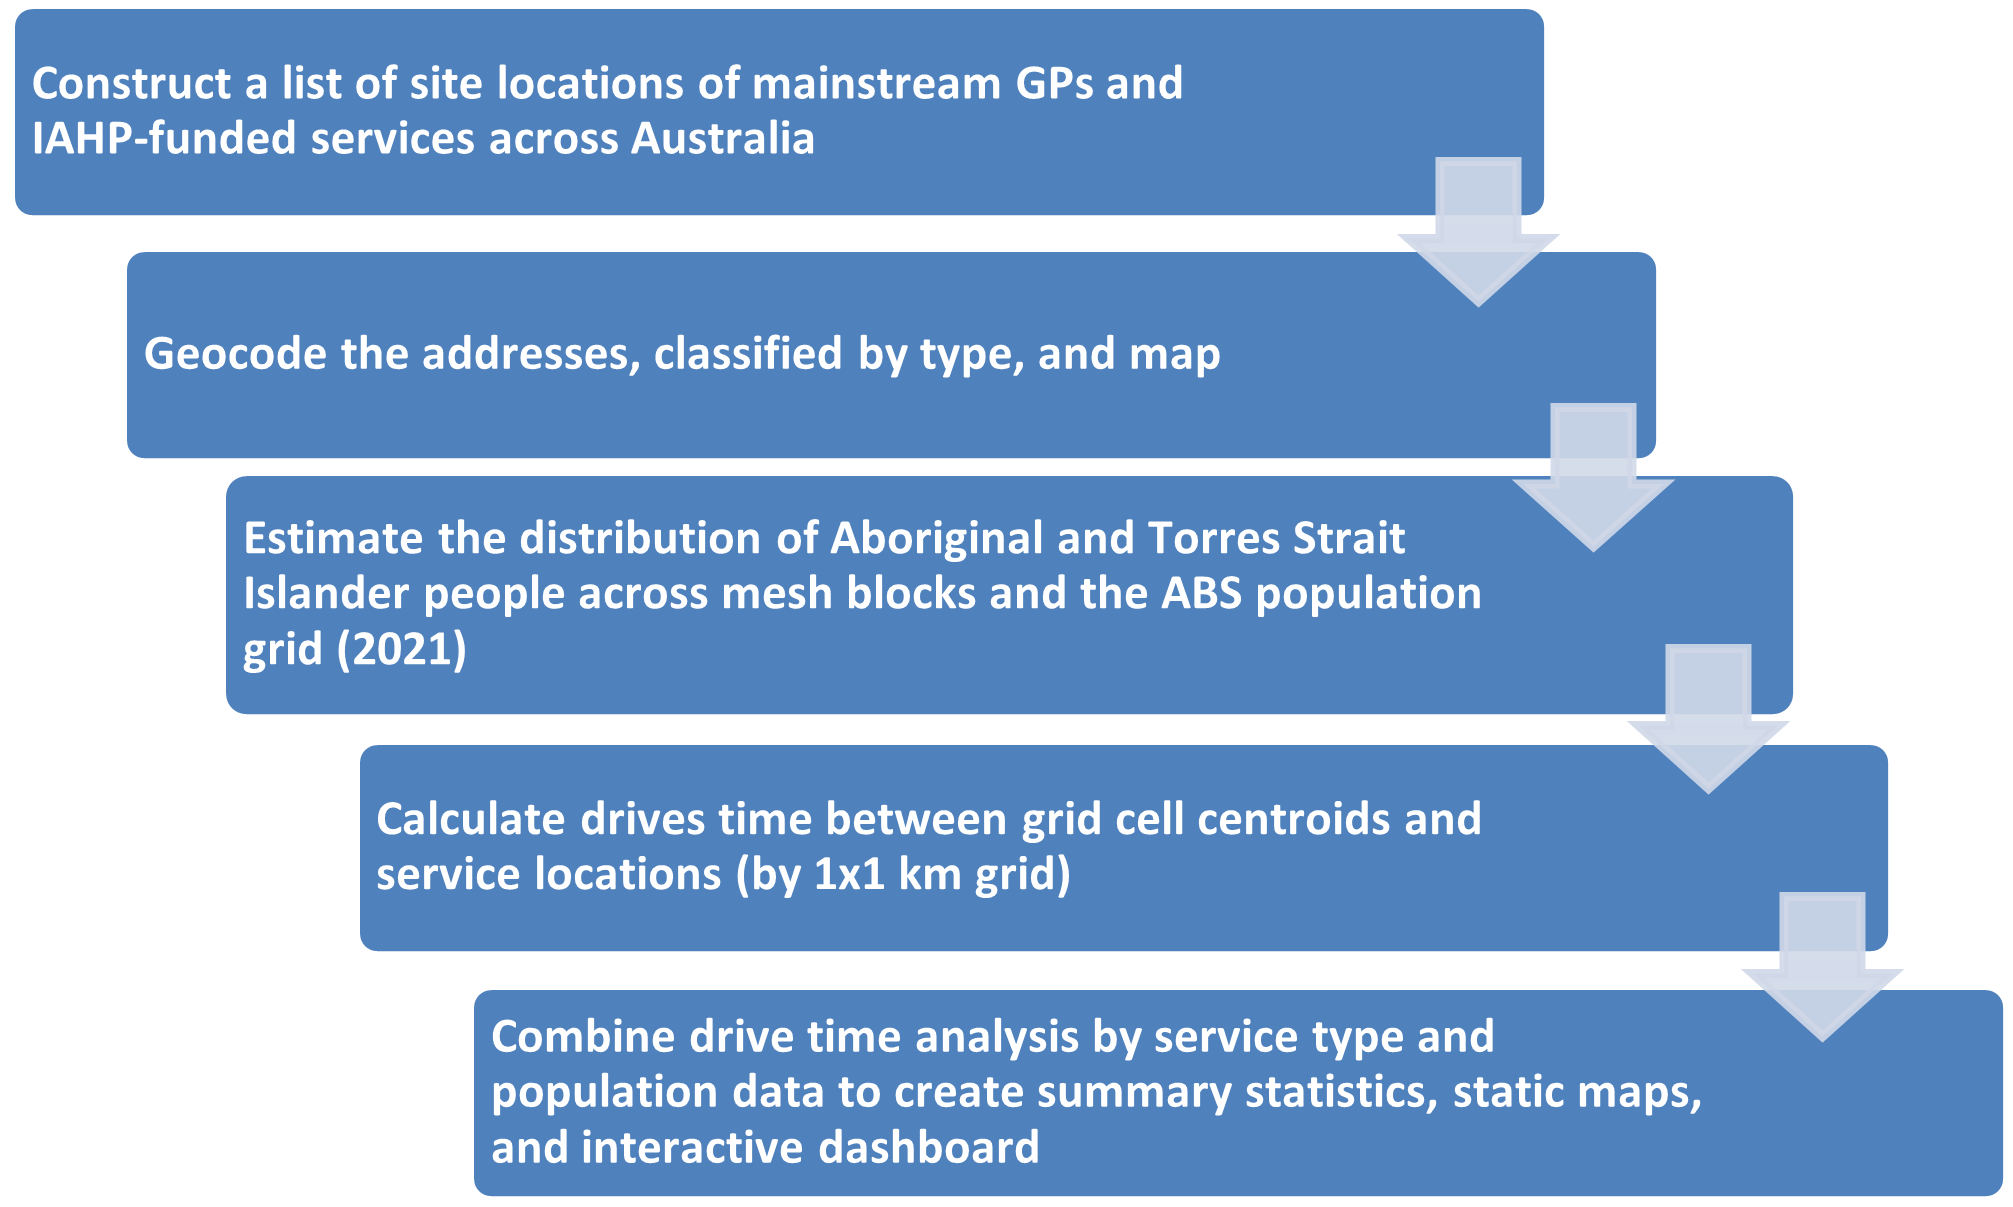
Overview of the spatial analysis
Figure 1.2: Steps for spatial analysis of primary health care services[6]

A flowchart that presents the 5 steps used in the spatial analysis of primary health care services:
- construct a list of site locations of mainstream GP and IAHP-funded services across Australia
- geocode the addresses, classified by type, and map
- estimate the distribution of Aboriginal and Torres Strait Islander people across mesh blocks and the ABS population grid (2021)
- calculate drive times between grid cell centroids and service locations (by 1x1 km grid)
- combine drive-time analysis by service type and population data to create summary statistics, static maps, and interactive dashboard.
Locations of mainstream GPs were taken from the National Health Services Directory (NHSD), and the locations of IAHP-funded organisations were taken from AIHW analysis of the OSR. For the purposes of the work presented here, mainstream services were defined as any GP service site in the NHSD that was not included in the OSR.
Population-to-service drive times from the midpoint of each populated cell in the ABS’s 2021 population grid were calculated using Geographic Information System (GIS) software and a road network data set with speed limits. The population grid is made up of 1x1 km cells, which allows for a high resolution of where people live and how drive times to services vary. The available low-level Aboriginal and Torres Strait Islander population estimates were used in combination with the total population estimates for each grid cell to estimate the Aboriginal and Torres Strait Islander population in all populated grid cells.
It is important to note that service locations change and that the snapshot captured by these data sources is not 100% complete. Any service (including permanent clinics and outreach locations) not covered by the NHSD or the OSR has not been considered in the analysis presented here. This means that while the results included in this report will give a good indication of how access varies at a local level, further information about current activities on the ground may be needed to gain a full understanding of the access situation experienced by people living in identified service gap areas.
The detailed methodology is presented in Appendix 1.
Consultation during the project
Feedback on the approach and content was provided during the project by the Department of Health and Aged Care, the National Aboriginal Community Controlled Health Organisation (NACCHO) and the AIHW’s Indigenous Statistical Information and Advisory Group (ISIAG). One of the key themes of this feedback was that the results needed to have practical implications, particularly in identifying population subgroups and geographic areas with unmet needs for, or low access to, primary health care (under-served populations).
Notes:
- Weighted frequencies were used to provide population-level estimates of the distributions of key variables.
- Aboriginal Medical Service/Community Clinic (AMS/CC); mainstream GP; hospital; traditional healer; other; none.
- It is not known how the respondents interpreted this term (for example, whether they would have included all IAHP-funded services, or just those run by ACCHOs; nor is it known what proportion included mainstream community clinics).
- They may have had a hospital in the area, but these analyses focus on the availability of primary health care services specifically.
- The spatial analyses include a similar set of categories.
- For more detail, see the AIHW’s Online Services Report for First Nations-specific primary health care.