Continuity of care
Consistently seeing the same health-care provider can promote good health through better coordination of health-care services, and through the development of trust and strong relationships, which are particularly important for Aboriginal and Torres Strait Islander people (Nolan-Isles et al. 2021).
The NATSIHS results indicate that just under 693,000 Aboriginal and Torres Strait Islander people (85%) always used the same source of health care, with just under 58,000 (7.1%) using more than one source, and an additional 63,800 (7.8%) not having any usual source.[1]
Nearly 93% of those who had an AMS/CC or a mainstream GP as their usual source of care always used them, compared with 88% of those whose main source of care was a hospital (Figure 5.1).
Figure 5.1: Aboriginal and Torres Strait Islander people, always used the same source of health care, by usual source of care, 2018–19
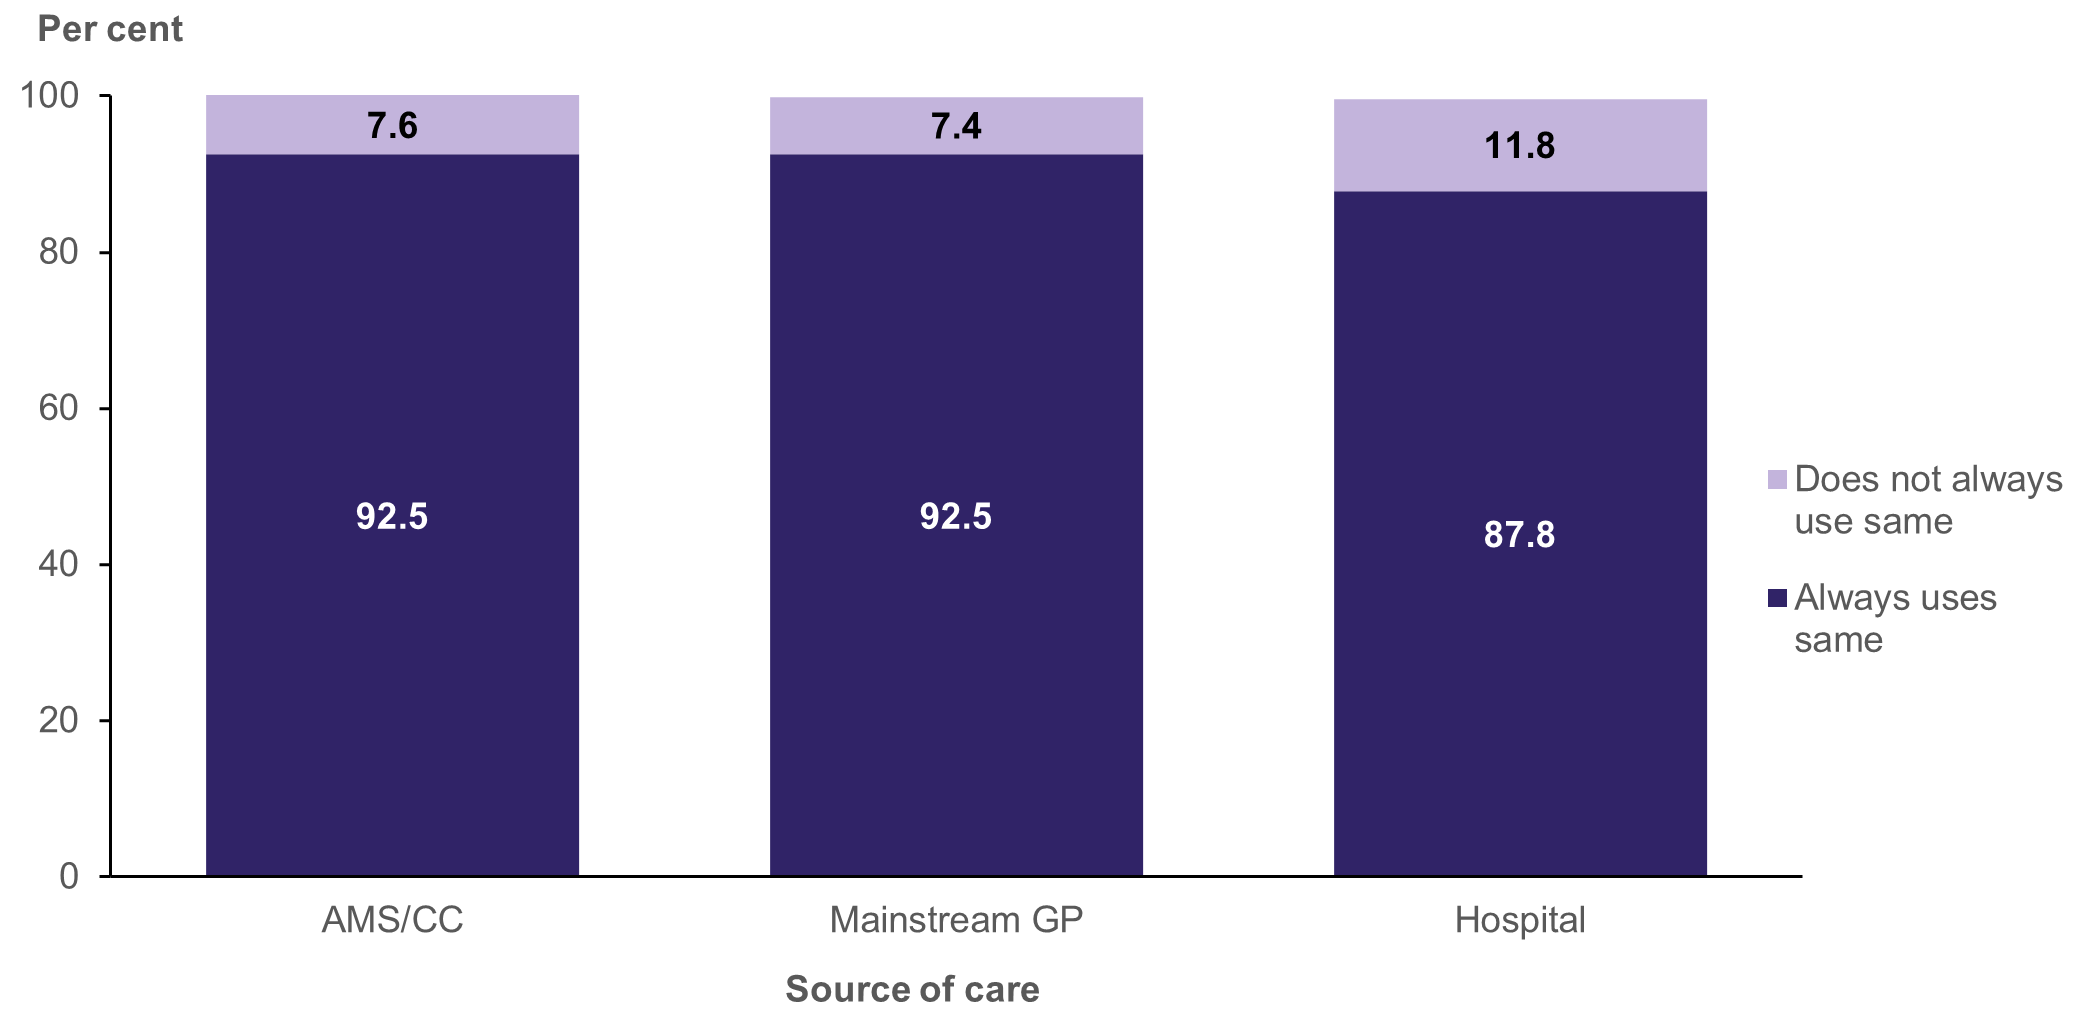
Note: Columns may not add to 100% because of rounding.
Source: AIHW analysis of 2018–19 NATSIHS using TableBuilder (ABS 2019).
The likelihood of always using the same source varied across a number of the independent variables (Figure 5.2; Data: Descriptive analysis supplementary tables, Table S.4).
Figure 5.2: Aboriginal and Torres Strait Islander people, always used the same source of care, by selected characteristics, 2018–19
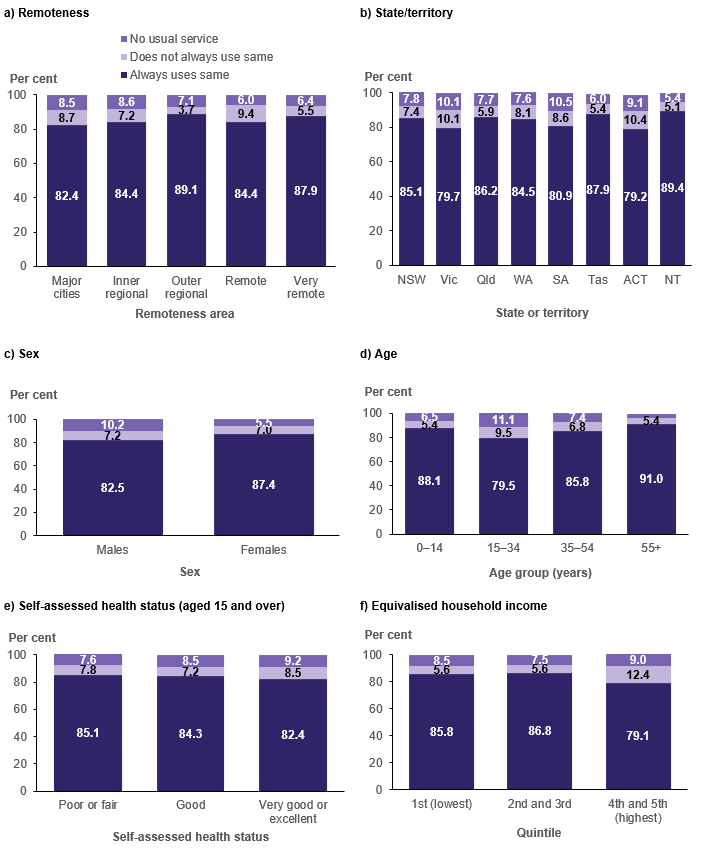
Source: AIHW analysis of 2018–19 NATSIHS using TableBuilder (ABS 2019).