Usual source of care
The previous section focused on preference; this section looks at respondents’ actual sources of care. The NATSIHS results suggest that, in 2018–19, nearly all Aboriginal and Torres Strait Islander people had a usual source of care, with 62,600 saying they had none (7.7%) (Figure 4.3). It is not known whether those without a usual source of care used multiple sources or whether they had not needed health care. Over half cited a mainstream GP as their usual source, with another 34% reporting an AMS/CC.
Figure 4.3: Usual source of health care among Aboriginal and Torres Strait Islander people, 2018–19
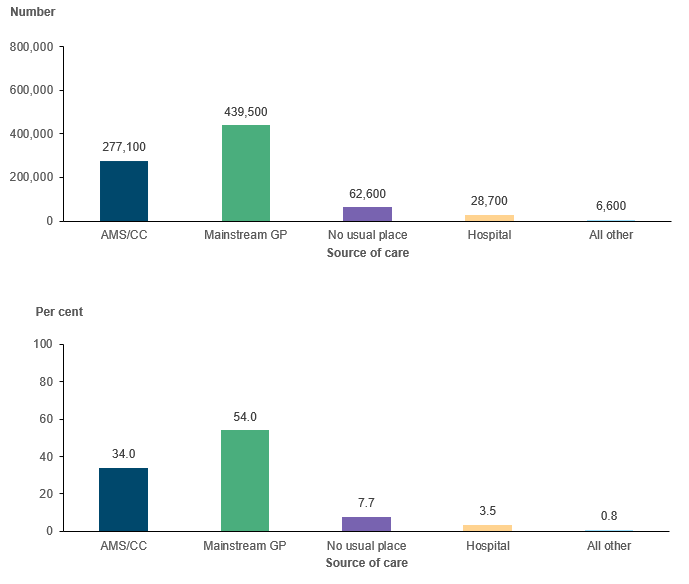
Note: Estimate for those reporting none has a relative standard error between 25% and 50% and should be used with caution.
Source: AIHW analysis of 2018–19 NATSIHS using TableBuilder (ABS 2019).
Usual source of care is strongly related to the services available in a person’s local area. However, it is also important to note that some people will travel outside their local area for a service they prefer, there may be different services in the area in which people work compared with the area in which they live (so they may access care near where they work), and availability does not mean that a service will have capacity to serve everyone in their area.
At a broad level, and consistent with how primary care services are distributed throughout Australia (as shown in Chapter 3), there is a strong relationship between remoteness and usual source (Figure 4.4). Around 15% of those in Major cities had an AMS/CC as their usual source of care, compared with 75% of those in Very remote areas, while 75% of those in Major cities had a mainstream GP, compared with 27% of those in Remote areas.[1]
Area-level and family-level indicators of socioeconomic status showed similar patterns. Having an AMS/CC as their usual source was highest among those Aboriginal and Torres Strait Islander people living in the most disadvantaged areas (45%) and among those with lower household incomes (42%), while mainstream GP as the usual source was highest among those in more advantaged areas (90%) and who had higher incomes (75–77%).
AMS/CC use was slightly higher among adults who reported experiencing unfair treatment in the previous 12 months compared with those who had not (37% and 33%, respectively). For those aged 18 and over, AMS/CC was strongly related to satisfaction with one’s own knowledge of culture – 46% of those who were satisfied/strongly satisfied had an AMS/CC as their usual source, compared with fewer than 20% of those who were less satisfied (noting that having an AMS/CC as a usual source could increase people’s knowledge of culture).
Figure 4.4: Usual source of care among Aboriginal and Torres Strait Islander people, by selected characteristics, 2018–19
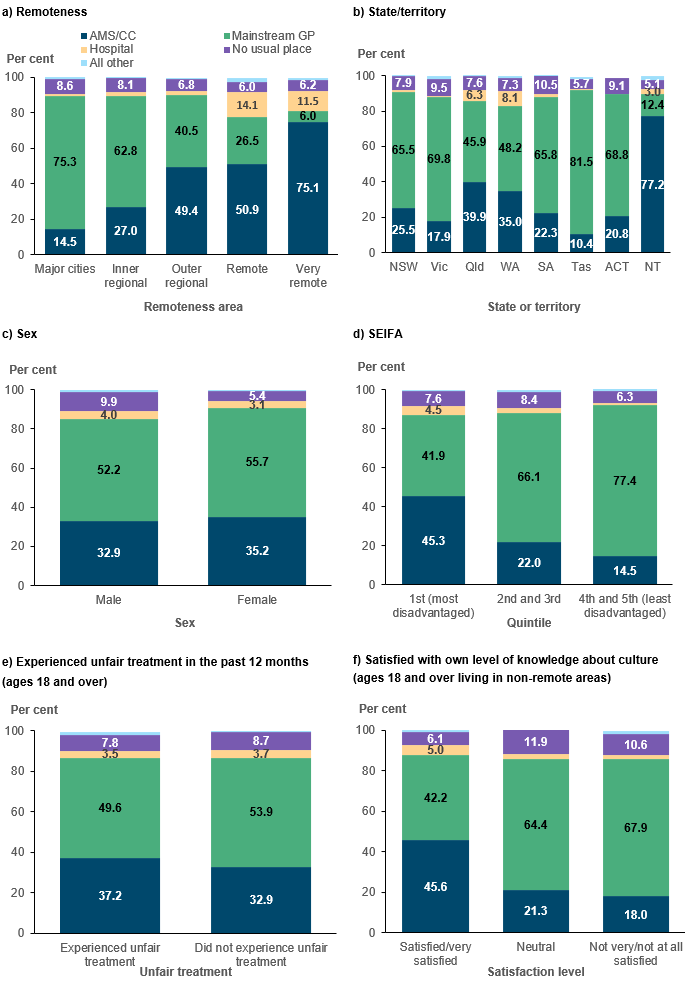
Note: Estimate for those reporting All other has a relative standard error between 25% and 50% and should be used with caution.
Source: AIHW analysis of 2018–19 NATSIHS (ABS 2019) using TableBuilder.