Drive times
Nationally, an estimated 99% of Aboriginal and Torres Strait Islander people have a primary care service within a 1-hour drive, with just over 11,100 people having no primary health service location within 60 minutes (Table 6.2).[1]
It is important to note that this is a baseline measure of access and only captures whether there is a service within that drive time – it does not take the current capacity of the practice to serve patients or the cultural safety of the services into account. It also does not reflect whether individuals have the resources to be able to travel to the locations.
Table 6.2 also shows that there are an estimated 52,700 Aboriginal and Torres Strait Islander people who live outside a 1-hour drive to any IAHP-funded service location (5.4%), and over 90,200 who live outside a 1-hour drive to an IAHP-funded ACCHO specifically (9.2%). The analysis also found that 6.8% of Aboriginal and Torres Strait Islander people live outside a 1-hour drive to a mainstream GP practice location.
Table 6.2: Distribution of Aboriginal and Torres Strait Islander people, by drive time to nearest primary health service location and by provider type
Variation by remoteness
As shown in Figure 6.1, there are considerable variations in service locations by remoteness. The impact of this variation is seen in the results of the drive time analysis: everyone in a Major city or Inner regional area was within a 1-hour drive of at least one type of primary care service, as were 99% of those in Outer regional and Remote areas, compared with 89% of those in Very remote areas (Figure 6.2).
The importance of IAHP-funded services (both ACCHOs and non-ACCHOs) in providing access to primary health care in Remote and Very remote areas is highlighted in panels (c) and (d) of Figure 6.2. Fifteen per cent of those in Remote areas and 64% of those in Very remote areas live more than a 1-hour drive to a mainstream GP. When IAHP-funded services are included, however, 99% of those in Remote areas and 89% of those in Very remote areas live within a 1-hour drive of at least one of the included primary care services.[2]
Figure 6.2: Percentage distribution of Aboriginal and Torres Strait Islander people by drive time to nearest primary health service location and by provider type and remoteness
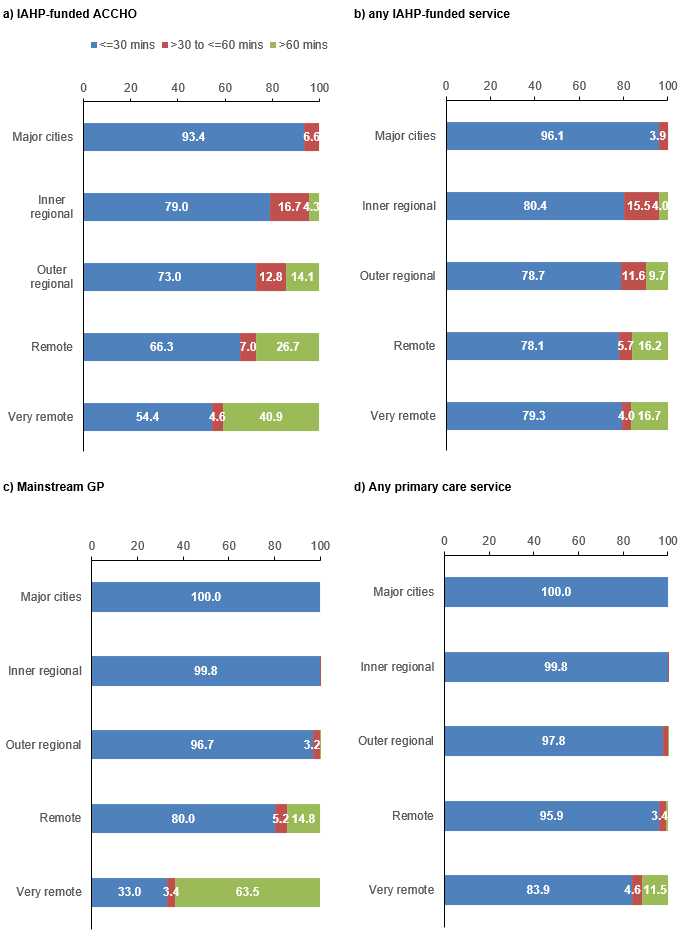
Note: For more details see Appendix 1. Underlying numbers of people in each group are available in Appendix 2, Table A2.20.
Sources: Service locations for the IAHP-funded services are from the 2022–23 OSR data collection and include only those with declared primary health functions (excluding sites providing only maternal and child health services). Mainstream GP locations are from the NHSD, excluding sites also in the OSR.
Maps
The local-level distributions of Aboriginal and Torres Strait Islander people by drive times are illustrated in the following series of maps, beginning with the distribution across Australia as a whole and then with breakout maps of smaller areas.[3]
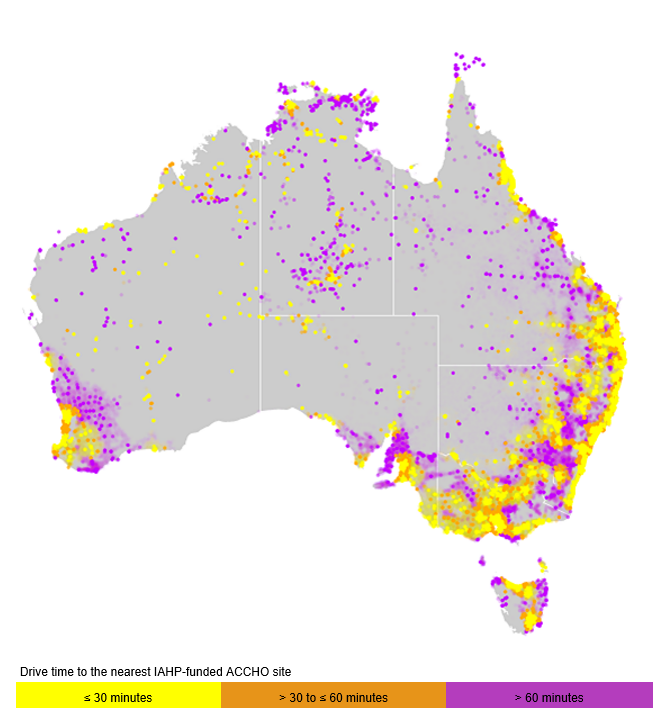
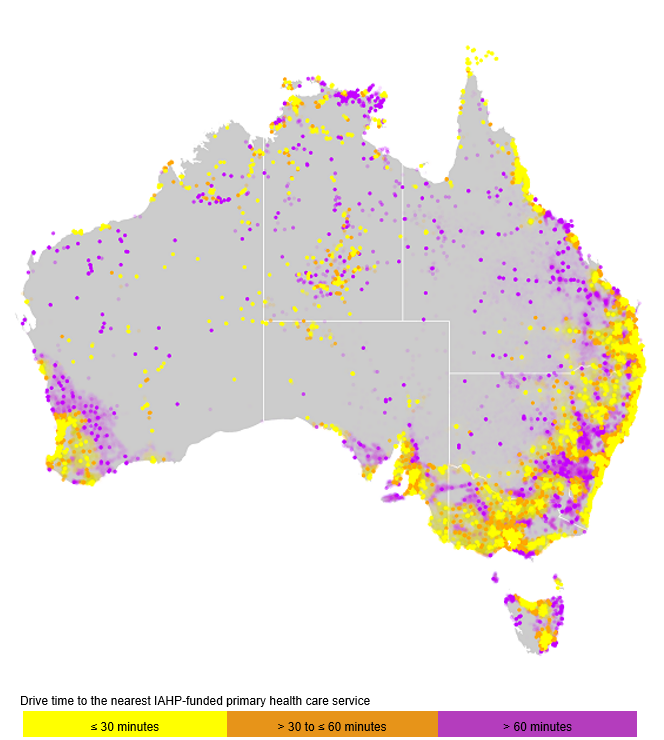
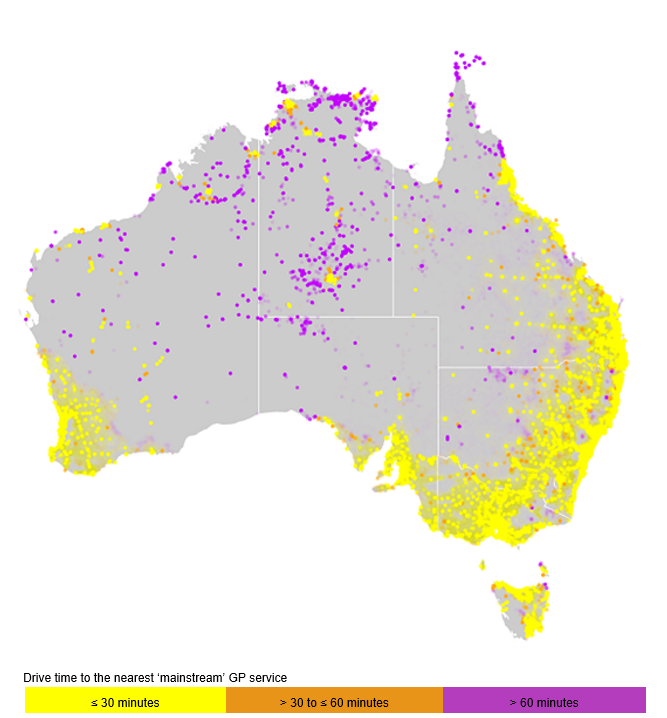
The purple dots highlight locations for which Aboriginal and Torres Strait Islander people are more than a 1-hour drive from an IAHP-funded ACCHO (Figure 6.3), from any IAHP-funded service (Figure 6.4), from a mainstream GP (Figure 6.5), and from any primary health service (Figure 6.6), while the yellow dots represent those with drive times of 30 minutes or less.
The maps illustrate the importance of looking at availability at a local level and by provider type. The map of drive times to IAHP-funded ACCHOs (Figure 6.3) highlights that there is a great deal of variation across Australia, and within states/territories and remoteness areas – some cities and regional/remote areas have good access (yellow dots), while others have poor access (purple dots).
The addition of other IAHP-funded services to the IAHP-funded ACCHOs changes the picture slightly, particularly in the Northern Territory, where a number of the areas change from purple to yellow or orange (representing lower drive times/improved access) (Figure 6.4).
Figure 6.5 (drive times to mainstream GPs) presents a vastly different picture, with the map dominated by yellow dots in the urban and regional areas and with purple dots in northern Australia (including far north Queensland, the Northern Territory, and parts of Western Australia).
Drive times to any primary service show that there are small geographic areas within most states and territories where Aboriginal and Torres Strait Islander people live more than a 1-hour drive from any service (Figure 6.6).
As it can be difficult to see variation within cities and regional areas in the larger national maps, breakout maps of selected cities/regional areas have been provided for drive times to IAHP-funded ACCHOs (Figure 6.7), any IAHP-funded service (Figure 6.8), and to mainstream GPs (Figure 6.9). No map of access to any primary health service is included because Figure 6.9 shows that every included area is within a 30-minute drive of a mainstream GP.
Figure 6.3: Drive times to IAHP-funded ACCHOs
Notes
- Points represent locations with Aboriginal and Torres Strait Islander residents. Locations with very sparse populations (<10 people per sq km) are rendered transparent.
- Drive times reflect the service locations in the 2022–23 OSR data collection. Service locations include only those with declared primary health care function (excluding sites providing only maternal and child health services). No modifications, including additions of service locations or adjustments to existing entries, have been made to the data.
Sources: AIHW analysis of ABS population data (30 June 2021); Online Services Report 2022–23.
Figure 6.4: Drive times to any IAHP-funded service
Notes
- Points represent locations with Aboriginal and Torres Strait Islander residents. Locations with very sparse populations (<10 people per sq km) are rendered transparent.
- Drive times reflect the service locations in the 2022–23 OSR data collection. Service locations include only those with declared primary health care function (excluding sites providing only maternal and child health services). No modifications, including additions of service locations or adjustments to existing entries, have been made to the data.
Sources: AIHW analysis of ABS population data (30 June 2021); Online Services Report 2022–23.
Figure 6.5: Drive times to mainstream GPs
Notes
- Points represent locations with Aboriginal and Torres Strait Islander residents. Locations with very sparse populations (<10 people per sq km) are rendered transparent.
- Drive time reflect the service locations in the NHSD, excluding sites also in the 2022–23 OSR data collection. Service locations include only those with Service category ‘General practice/GP’. No modifications, including additions of service locations or adjustment to existing entries, have been made to the data.
- Some of the remaining NHSD sites may either receive IAHP funding or belong to other organisations focused on Aboriginal and Torres Strait Islander health care. Other NHSD sites receiving IAHP funding may have been excluded, even if they typically provide mainstream services on site.
Sources: AIHW analysis of ABS population data (30 June 2021); NHSD (downloaded 2 April 2024).
Figure 6.6: Drive times to any primary care service
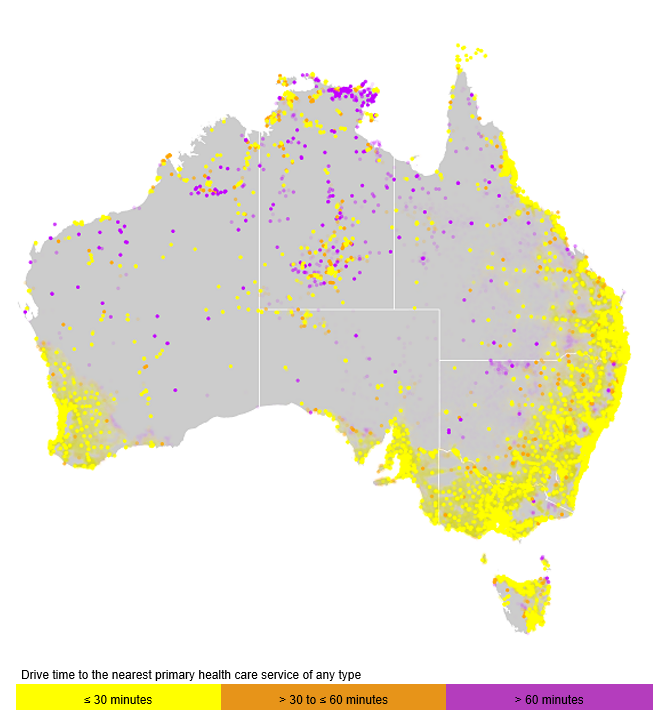
Notes
- Points represent locations with Aboriginal and Torres Strait Islander residents. Locations with very sparse populations (<10 people per sq km) are rendered transparent.
- Drive times reflect the service locations in the 2022–23 OSR data collection and the NHSD. OSR service locations include only those with declared primary health care function (excluding sites providing only maternal and child health services). NHSD locations include only those with Service category ‘General practice/GP’. No modifications, including additions of service locations or adjustments to existing entries, have been made to the data.
Sources: AIHW analysis of ABS population data (30 June 2021); NHSD (downloaded 2 April 2024); Online Services Report 2022–23.
Figure 6.7: Drive times to IAHP-funded ACCHOs, small area breakouts
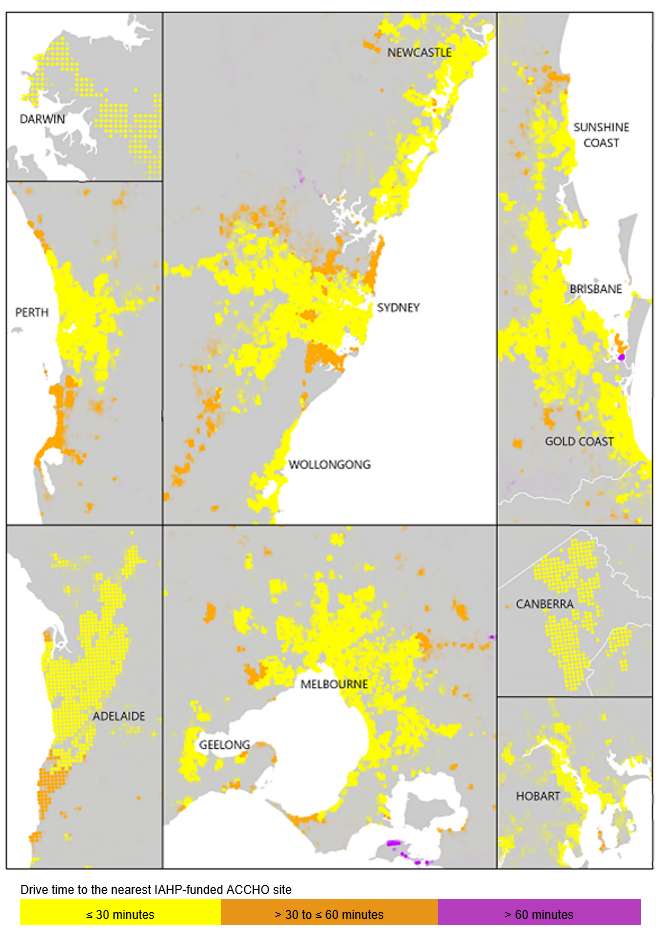
Notes
- Points represent locations with Aboriginal and Torres Strait Islander residents. Locations with very sparse populations (<10 people per sq km) are rendered transparent.
- Drive times reflect the service locations in the 2022–23 OSR data collection. Service locations include only those with declared primary health care function (excluding sites providing only maternal and child health services). No modifications, including additions of service locations or adjustments to existing entries, have been made to the data.
Sources: AIHW analysis of ABS population data (30 June 2021); Online Services Report 2022–23.
Figure 6.8: Drive times to any IAHP-funded service, small area breakouts
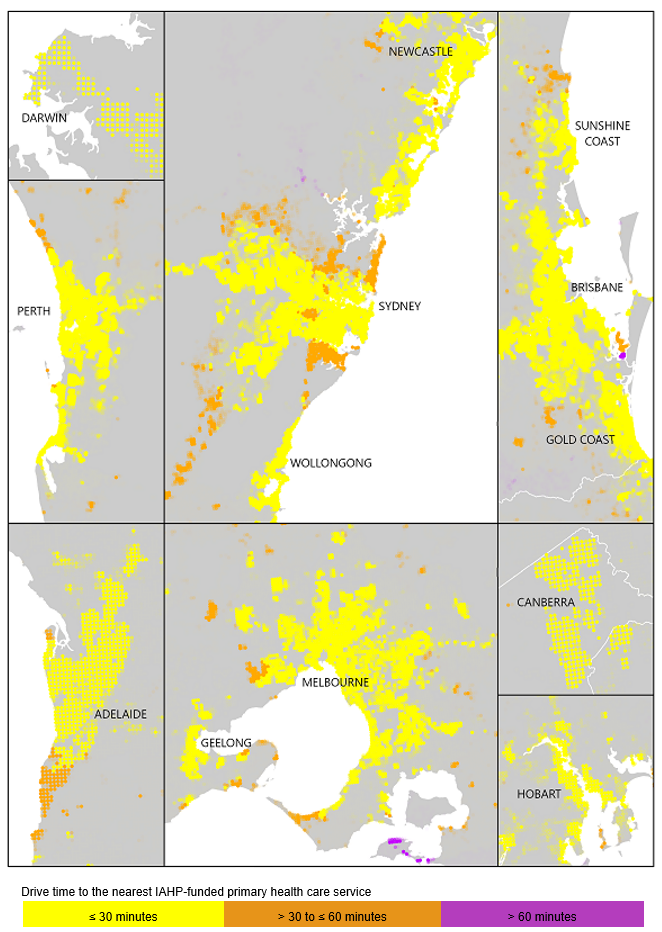
Notes
- Points represent locations with Aboriginal and Torres Strait Islander residents. Locations with very sparse populations (<10 people per sq km) are rendered transparent.
- Drive times reflect the service locations in the 2022–23 OSR data collection. Service locations include only those with declared primary health care function (excluding sites providing only maternal and child health services). No modifications, including additions of service locations or adjustments to existing entries, have been made to the data.
Sources: AIHW analysis of ABS population data (30 June 2021); Online Services Report 2022–23.
Figure 6.9: Drive times to mainstream GPs, small area breakouts
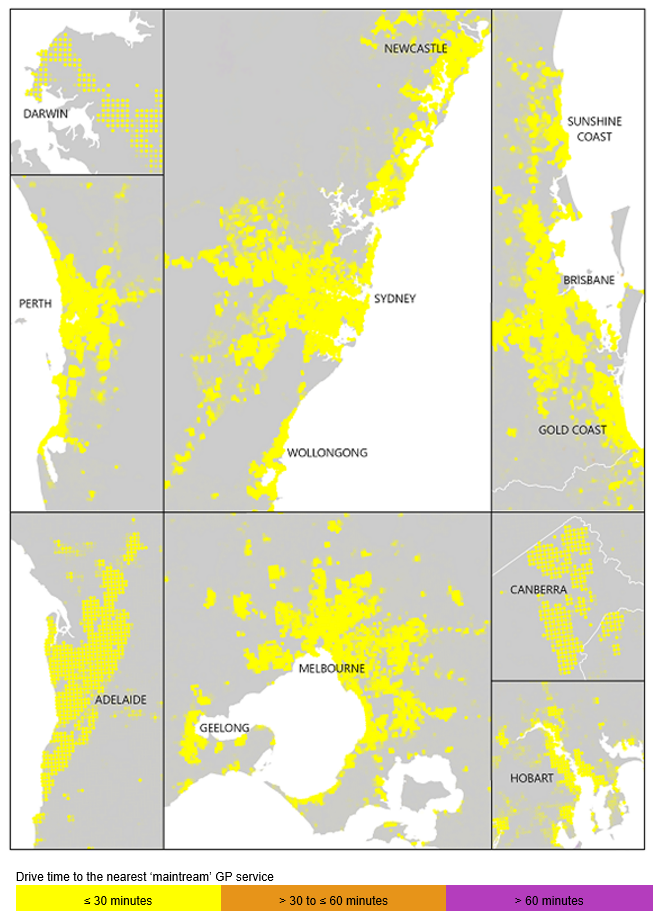
Notes
- Points represent locations with Aboriginal and Torres Strait Islander residents. Locations with very sparse populations (<10 people per sq km) are rendered transparent.
- Drive times reflect the service locations in the 2022–23 OSR data collection. Service locations include only those with declared primary health care function (excluding sites providing only maternal and child health services). No modifications, including additions of service locations or adjustments to existing entries, have been made to the data.
Sources: AIHW analysis of ABS population data (30 June 2021); NHSD (downloaded 2 April 2024);.