Perceived availability of health services in respondents’ local areas
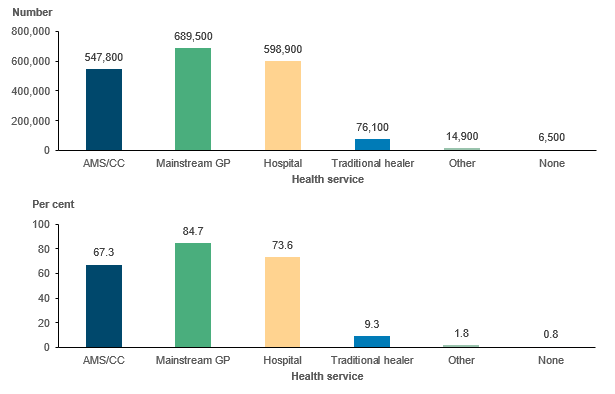
The responses to the 2018–19 National Aboriginal and Torres Strait Islander Health Survey (NATSIHS) suggested that of 814,000 Aboriginal and Torres Strait Islander people, nearly everyone (99%) would say that they have at least one type of health service in their local area (Figure 3.1). The most frequently cited types of services were mainstream general practitioners (GP), hospitals, and AMS/CCs.
Figure 3.1: Aboriginal and Torres Strait Islander people, services available in local area, 2018–19
Notes
- Estimate for those reporting none has a relative standard error between 25% and 50% and should be used with caution.
- Respondents were asked to tick all that were available.
- The numbers above the column bars are percentages.
Source: AIHW analysis of 2018–19 NATSIHS (ABS 2019) using TableBuilder.
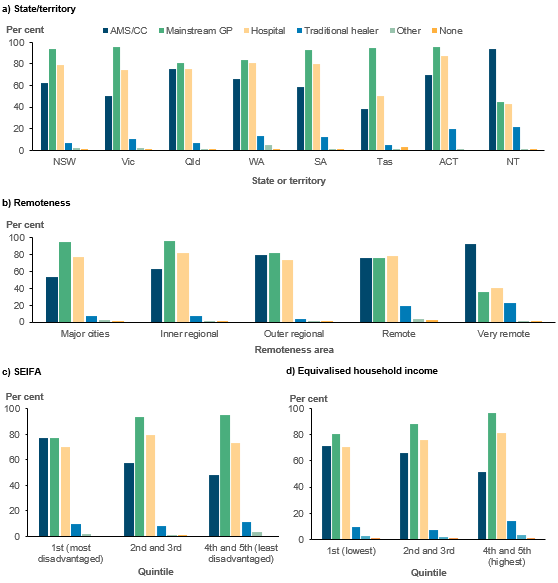
The different types of services were not universally distributed across Australia, however (Figure 3.2). Aboriginal and Torres Strait Islander people living in more remote areas, those who had lower incomes, and those who lived in more disadvantaged areas were more likely to report having an AMS/CC in their local area, while mainstream GPs were more concentrated in more urban and more advantaged areas. This pattern is expected as AMS/CC services are targeted towards areas and populations of greater need.[1]
Figure 3.2: Aboriginal and Torres Strait Islander people, services available in local area, by selected characteristics, 2018–19
Notes
- Estimate for those reporting none has a relative standard error between 25% and 50% and should be used with caution.
- Respondents were asked to tick all that were available.
Source: AIHW analysis of 2018–19 NATSIHS (ABS 2019) using TableBuilder.
Perceived availability also varies within remoteness categories across states and territories (Table 3.1). The largest variations in the proportions of those indicating the presence of an AMS/CC in their local area were for those Aboriginal and Torres Strait Islander people living in Inner regional areas (where it ranged from a low of 29% in Tasmania to a high of 73% in South Australia) and for those living in Major cities (where it ranged from a low of 33% in Victoria to a high of 70% in the Australian Capital Territory).
| State/ territory | Remoteness | Number saying available in local area (AMS/CC) | Number saying available in local area (Mainstream GP) | % saying available in local area (AMS/CC) | % saying available in local area (Mainstream GP) | Total number of Aboriginal and Torres Strait Islander people in area |
|---|---|---|---|---|---|---|
| NSW | Major cities | 67,400 | 119,500 | 53.4 | 94.7 | 126,200 |
| NSW | Inner regional | 63,300 | 90,000 | 67.7 | 96.3 | 93,500 |
| NSW | Outer regional | 34,500 | 37,200 | 81.2 | 87.5 | 42,500 |
| NSW | Remote | 2,900‡ | 6,300 | 37.7‡ | 81.8 | 7,700 |
| NSW | Very remote | 2,100‡ | 2,000‡ | 87.5‡ | 83.3‡ | 2,400 |
| Vic | Major cities | 10,200 | 30,700 | 32.7 | 98.4 | 31,200 |
| Vic | Inner regional | 13,300 | 19,500 | 62.7 | 92 | 21,200 |
| Vic | Outer regional | 6,800 | 7,400 | 87.2 | 94.9 | 7,800 |
| Qld | Major cities | 52,000 | 75,500 | 66.6 | 96.7 | 78,100 |
| Qld | Inner regional | 33,600 | 49,000 | 67.1 | 97.8 | 50,100 |
| Qld | Outer regional | 51,800 | 41,800† | 84.8 | 68.4† | 61,100 |
| Qld | Remote | 11,900 | 9,300 | 86.2 | 67.4 | 13,800 |
| Qld | Very remote | 21,700 | 10,400 | 90 | 43.2 | 24,100 |
| WA | Major cities | 18,100 | 39,700 | 43.8 | 96.1 | 41,300 |
| WA | Inner regional | 3,300‡ | 7,000 | 46.5‡ | 98.6 | 7,100 |
| WA | Outer regional | 12,300 | 12,500 | 86 | 87.4 | 14,300 |
| WA | Remote | 11,200 | 13,000 | 82.4 | 95.6 | 13,600 |
| WA | Very remote | 20,700 | 11,400 | 86.3 | 47.5 | 24,000 |
| SA | Major cities | 12,500 | 21,200 | 55.8 | 94.6 | 22,400 |
| SA | Inner regional | 3,500 | 4,700 | 72.9 | 97.9 | 4,800 |
| SA | Outer regional | 3,900† | 9,400 | 40.2† | 96.9 | 9,700 |
| SA | Remote | 1,000† | 1,700 | 58.8† | 100 | 1,700 |
| SA | Very remote | 4,200 | 2,800 | 93.3 | 62.2 | 4,500 |
| Tas | Inner regional | 4,900 | 15,800 | 29.3 | 94.6 | 16,700 |
| Tas | Outer regional | 6,600 | 11,400 | 54.5 | 94.2 | 12,100 |
| Tas | Remote | — | 900 | — | 100 | 900 |
| ACT | Major cities | 5,400 | 7,400 | 70.1 | 96.1 | 7,700 |
| NT | Outer regional | 14,800 | 15,300 | 90.8 | 93.9 | 16,300 |
| NT | Remote | 13,500 | 9,300 | 86 | 59.2 | 15,700 |
| NT | Very remote | 40,200 | 7,700 | 99 | 19 | 40,600 |
| Total | – | 547,800 | 689,500 | 67.3 | 84.7 | 814,000 |
† Estimate has a relative standard error between 25% and 50% and should be used with caution.
‡ Estimate has a relative standard error greater than 50% and is considered too unreliable for general use.
Note: Cells in this table have been randomly adjusted to avoid the release of confidential data. Discrepancies may occur between sums of the component items and totals.
Source: AIHW analysis of 2018–19 NATSIHS (ABS 2019) using TableBuilder.
How many people had multiple services in their area?
While figures 3.1 and 3.2 highlight the distribution of each individual type of health service provider, it is also important to know how many people have access to only one or more than one type of primary health care provider in their local area (Table 3.2).
In 2018–19, an estimated 439,700 Aboriginal and Torres Strait Islander people had both an AMS/CC and a mainstream GP in their local area (54%), 249,500 had a mainstream GP only (31%), 107,900 people had only an AMS/CC in their area (13%), and 17,100 had neither an AMS/CC nor a mainstream GP (2.1%).
Type of primary care service | Number | % |
|---|---|---|
| AMS/CC only | 107,860 | 13.2 |
| AMS/CC and mainstream GP | 439,704 | 54.0 |
| Mainstream GP only | 249,533 | 30.6 |
| Neither | 17,147 | 2.1 |
| Total | 814,244 | 100.0 |
Source: AIHW analysis of 2018–19 NATSIHS (ABS 2019) using Datalab.
There are clear geographic differences in where people have access to multiple services or where they have access only to a single service (and whether that is an AMS/CC or a mainstream GP) (Figure 3.3).[2]
Those in Very remote areas and those in Major cities were the least likely to report having both an AMS/CC and a mainstream GP in their local area (33% and 51%, respectively). Sixty per cent of those in Very remote areas had access only to an AMS/CC, and 45% of those in Major cities reported only mainstream GPs in their local areas.
Those living in the Northern Territory were the most likely to report an AMS/CC as the only primary care service in their area, followed by Queensland and Western Australia (53%, 17% and 14%, respectively).[3]
The effect of availability of services on preferred and usual source of care is explored further in Preferred and usual source of care.
Figure 3.3: Aboriginal and Torres Strait Islander people, distribution of multiple service types in local area, by selected characteristics, 2018–19
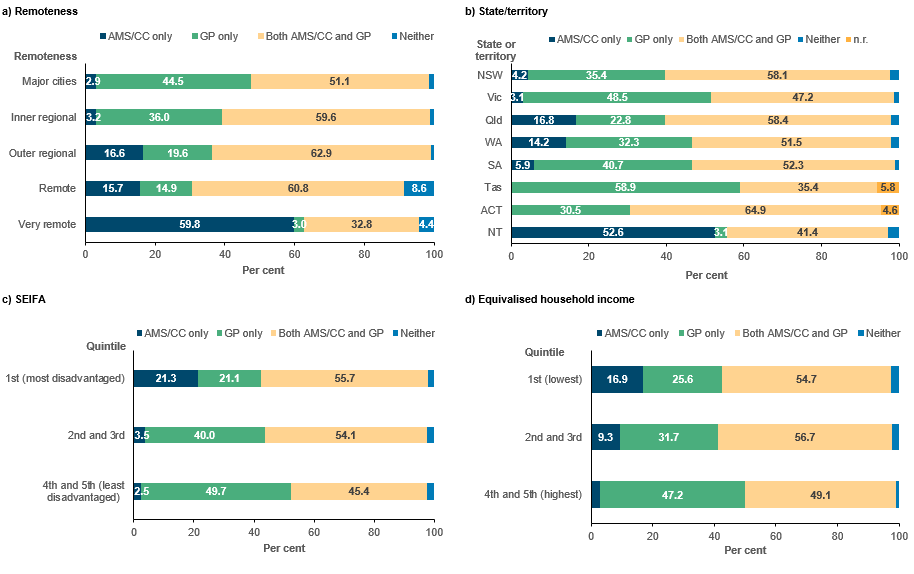
Note: n.r. = not reported due to confidentiality issues. See Appendix 2, Table A2.6.
Source: AIHW analysis of 2018–19 NATSIHS (ABS 2019) using DataLab.