Dental care
Timing of most recent visit
Oral health is an important component of overall health and quality of life. Poor oral health can affect adults and children alike, causing pain, embarrassment, and even social marginalisation. For children, the effects can be long term, and carry through to adulthood.
Many Aboriginal and Torres Strait Islander people experience poor oral health, such as multiple caries and untreated dental disease, and are less likely to have received preventive dental care (AHMAC 2017). Several factors contribute towards the poorer oral health of Aboriginal and Torres Strait Islander people, including social disadvantage and lack of access to appropriate diet and dental services.
Dental visits can be for preventive dental care, to maintain existing oral health, to reverse disease or to rehabilitate teeth and gums after damage has occurred. It is recommended that Aboriginal and Torres Strait Islander people visit the dentist at least once a year and have a usual dental provider (AIHW 2023c).
According to the 2018–19 NATSIHS, for 25% of Aboriginal and Torres Strait Islander people over the age of 2, it had been 2 years or more since their last visit to the dentist, with another 12% saying they had never been to a dentist (Figure 5.7)
Figure 5.7: Aboriginal and Torres Strait Islander people (aged 2 and over), timing of most recent visit to a dentist, 2018–19
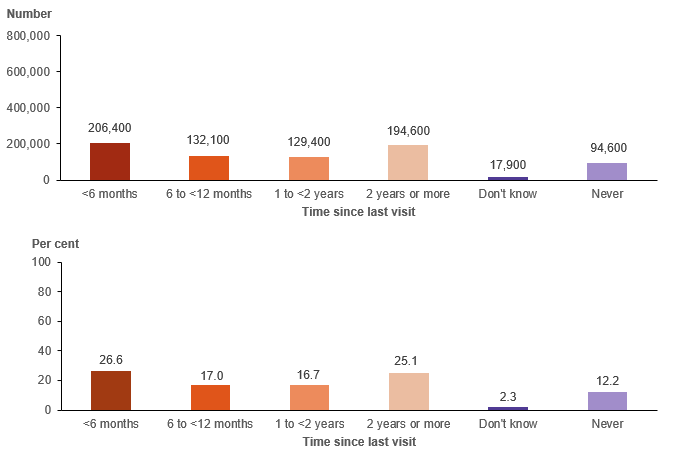
Source: AIHW analysis of 2018–19 NATSIHS (ABS 2019) using TableBuilder.
The proportion seeing a dentist within the past 2 years was highest among those in Major cities (65%) and lowest in Remote areas (54%), while those in Very remote areas were most likely to say they had never seen a dentist (18%) (Figure 5.8).
Young children were both most likely to have seen a dentist in the past 6 months (35%) and most likely to have never seen one (23%). Nearly 50% of those with fair or poor self‑assessed health had either never seen a dentist or not seen one in the past 2 years, signifying considerable unmet need (noting that a lack of dental care can contribute to poor overall health as well).
Figure 5.8: Aboriginal and Torres Strait Islander people (aged 2 and over), timing of most recent visit to a dentist, by selected characteristics, 2018–19
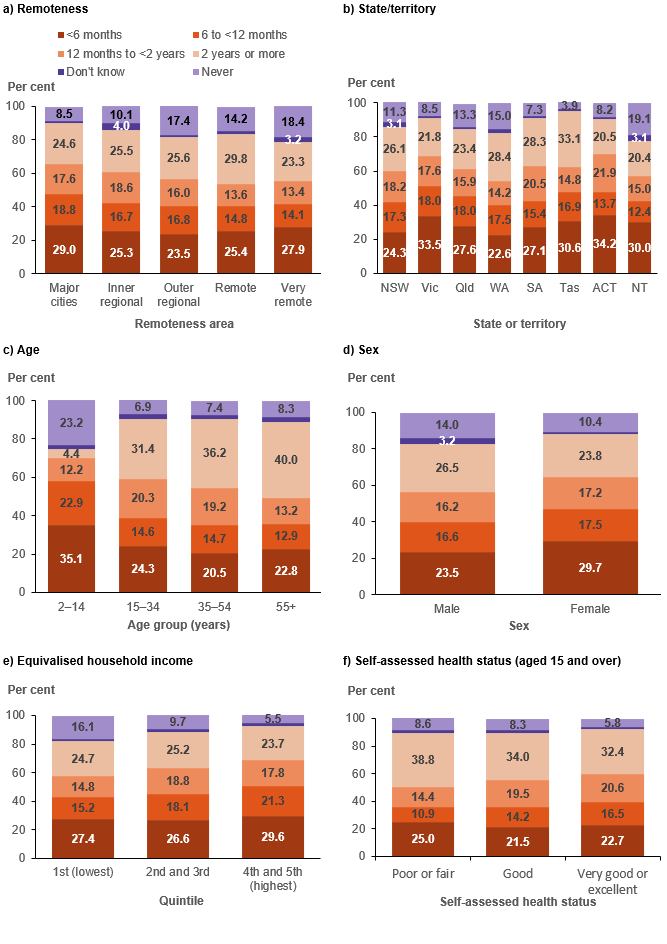
Source: AIHW analysis of 2018–19 NATSIHS using TableBuilder (ABS 2019)
Unmet needs
NATSIHS respondents were asked whether there was ever a time during the past 12 months where they (or their child) needed dental care but did not get it. If they said there had been an occasion of unmet need, they were given a list of 13 potential reasons why they did not go and were asked to tick as many as applied.
The findings suggest that, of 774,600 Aboriginal and Torres Strait Islander people aged 2 and over:
- 627,000 (81%) had no unmet need for dental services
- 146,800 (19%) had at least one instance in the past 12 months when they needed dental care but did not get it.
Unmet need for dental care was slightly higher among those whose usual source of care was a mainstream GP (18%) than among those whose usual source of care was an AMS/CC (16%).[1]
Although the levels of unmet need for dental care were higher than those for GP care, the patterns are generally similar (Figure 5.9):
- Those in Major cities had both the highest proportion (21%) and the highest number of people with unmet need (62,600), compared with all other remoteness areas. However, there was less variation between remoteness areas than for unmet need for GPs – unmet need ranged from 14% in Very remote areas to 21% in Major cities.
- Again the Australian Capital Territory had the highest proportion of people with unmet need (25%), and the lowest number of people (1,800 people). In absolute terms, New South Wales and Queensland had the highest number of people with unmet needs (45,300 and 42,400, respectively).
- Young children had low rates of unmet need for dental care (which may be related to targeted children’s dental programs). The highest number of people with an unmet need were in the 15–34 age group (71,300).
- There were 76,400 people living in the most disadvantaged areas with unmet need.
- The proportion of adults who had experienced unfair treatment in the past year with unmet need was 39%, which is higher than the proportion of those who had not experienced unfair treatment (24%).
Unmet need differed from that for GPs with regard to disability. While the pattern for those with long-term health conditions was similar (higher proportions and higher numbers than those without), those with disability had lower rates of unmet need for dental services than those without (14% versus 26%). However, there are still considerable numbers of Aboriginal and Torres Strait Islander people with disability who had unmet need (67,600).
Figure 5.9: Aboriginal and Torres Strait Islander people (aged 2 and over), unmet need for dental care in the past 12 months, by selected characteristics, 2018–19
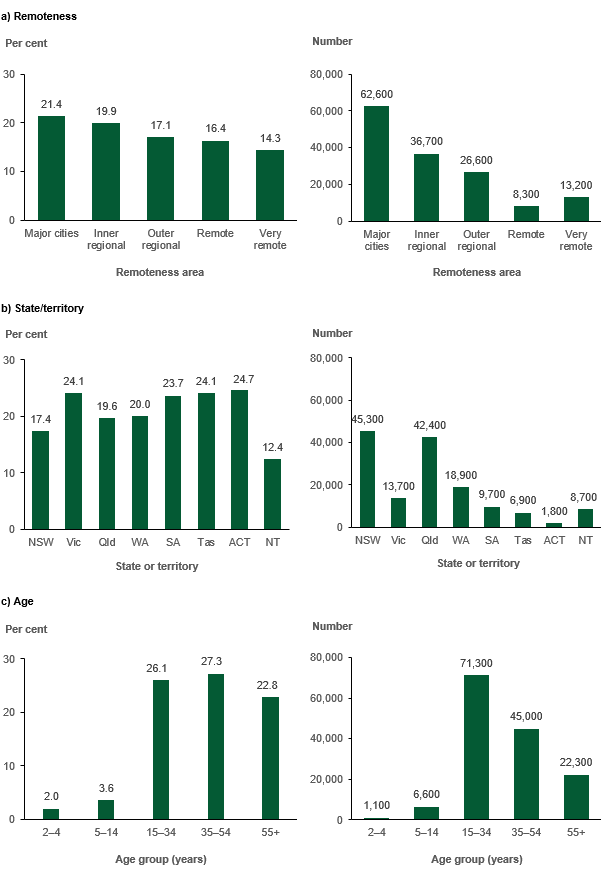
Figure 5.9 (continued): Aboriginal and Torres Strait Islander people (aged 2 and over), unmet need for dental care in the past 12 months, by selected characteristics, 2018–19
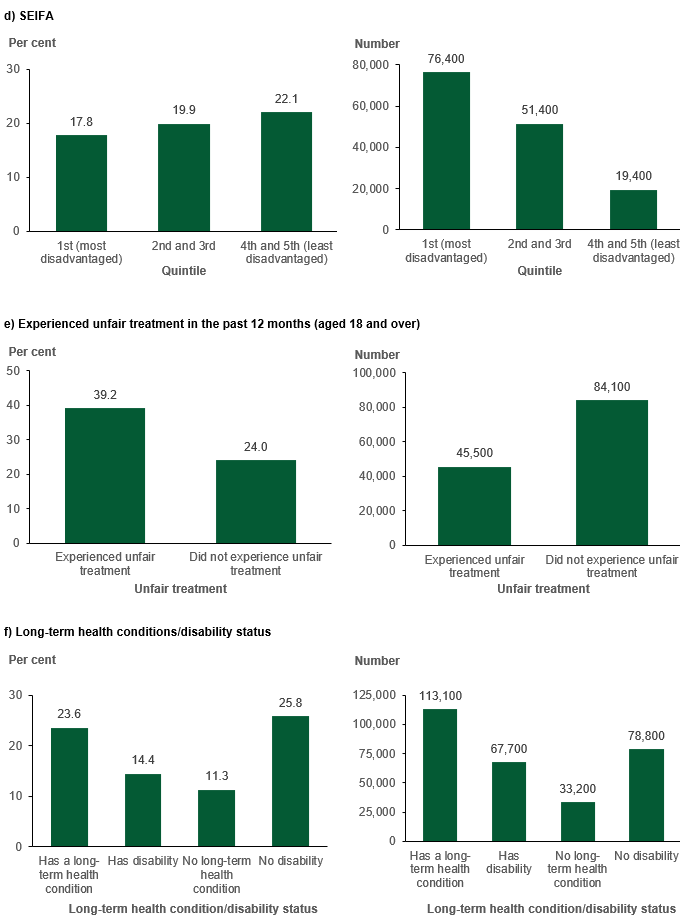
Source: AIHW analysis of 2018–19 NATSIHS (ABS 2019) using TableBuilder.
Reasons for unmet need
By far the most frequently cited reason for unmet need for dental care was cost, with 42% selecting it as an explanation for why they were unable to obtain care (Figure 5.10). As with the unmet need for GPs, ‘too busy’ was also a frequently cited explanation.
Figure 5.10: Aboriginal and Torres Strait Islander people (aged 2 and over), reasons for unmet need for dental care, 2018–19
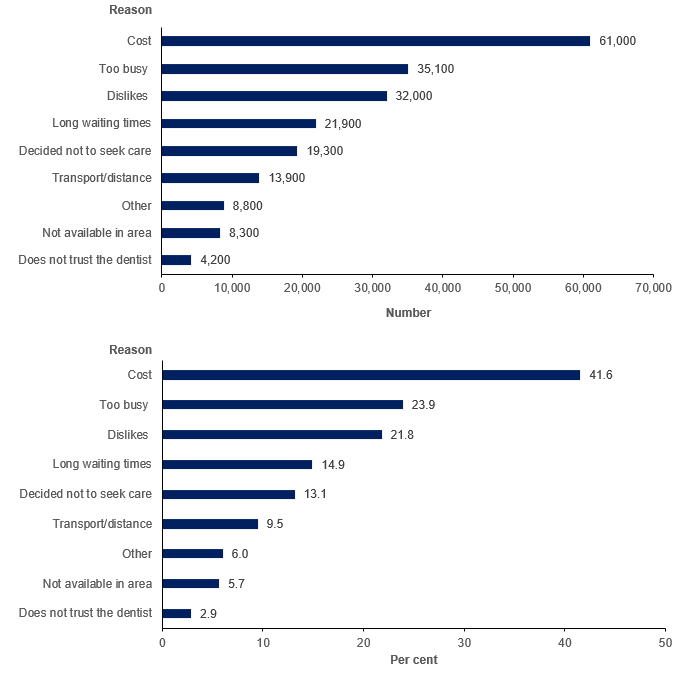
Notes
- The percentage distribution is calculated only on those who said they had at least one occasion of unmet need in the past 12 months.
- Only reasons with an acceptable standard error were included.
- The full wording of the y-axis label ‘Dislikes’ is ‘Dislikes (service/professional, afraid, embarrassed)’.
- Respondents were allowed to select multiple responses.
Source: AIHW analysis of 2018–19 NATSIHS (ABS 2019) using TableBuilder.