Comparison of findings from NATSIHS and spatial analysis
While the NATSIHS captures Aboriginal and Torres Strait Islander people’s own experiences and their perceived availability of what services are available in their local area, the spatial analysis provides a distance/drive time-based measure of service availability and service gaps.
One of the other differences between the 2 data sources is in how services that are specific to Aboriginal and Torres Strait Islander people are defined. NATSIHS respondents were asked whether there was an AMS/CC in their area and whether there was a GP other than in an AMS. The spatial analysis included IAHP-funded services (disaggregated by ACCHO/non-ACCHO governance) and mainstream GP service locations.
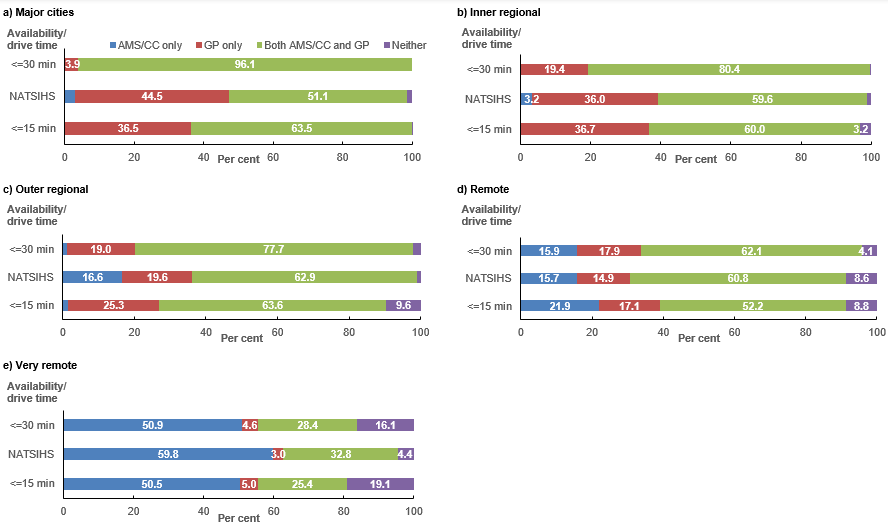
Figure 6.10 sets the results side by side to see how they compare, and provides an overview of the congruence in the perceived availability of services with the drive time results.[1]
Because there is no set definition of what people would consider their ‘local area’ (and it may differ across remoteness areas), 2 drive times were included – 15 minutes and 30 minutes. ‘All IAHP-funded services’ was selected as the closest representation of AMS/CC because it captures the ‘community clinic’ side.
For those in Major cities and Inner regional areas, the 15-minute drive time matches closely with people’s perceived availability of services in local areas (it is important to note that service locations themselves may have changed between 2018–19 and 2022–2024). However, when the longer drive time of 30 minutes or less is considered, there is little to no alignment between them.[2]
The results for those in Outer regional areas are not as clear cut. The survey respondents were more likely to indicate that the only source of primary care in their local area was an AMS/CC (17%), while the results from the spatial analysis indicate that it was less than 2%.
For those in Remote and Very remote areas, the 30-minute drive time limit seems to match more closely with the NATSIHS results. It is also interesting that in Very remote areas, 4.4% of Aboriginal and Torres Strait Islander people indicated that there was no primary care service in their local area, while the drive time results showed that for 16% of people there was no service within a 30-minute drive time. This may be due either to data gaps or that people in more remote areas consider a much larger area/larger drive time boundary to be their local area.
Figure 6.10: Percentage distribution of availability of service types in local area, NATSIHS and drive time results, by remoteness and drive time
Sources: AIHW analysis of 2018–19 NATSIHS (ABS 2019) using DataLab; Service locations for the IAHP-funded services are from the 2022–23 OSR data collection and include only those with declared primary health functions (excluding sites providing only maternal and child health services). Mainstream GP locations are from the NHSD, excluding sites that are also in the OSR. For more details see Appendix 2.