Types of follow-up
On this page:
Explore the data in the visualisation below.
Notes
- This section reflects follow-up activity by year of delivery, independently of health checks.
- Some records from a small number of service providers have been excluded due to data quality concerns.
Latest data
In 2021–22:
- 256,000 services (or 82% of total follow-up services) were delivered by an Aboriginal and Torres Strait Islander Health Practitioner or Practice Nurse to 129,000 patients on behalf of a GP.
- 57,800 services (or 18% of total follow-up services) were delivered by an allied health professional to 28,100 patients (with referral from a GP).
Among the allied health items relating to separate health professions, the follow-up services most frequently provided in 2020–21 were:
- 13,700 services delivered by Physiotherapists to 6,200 patients.
- 11,300 services delivered by Podiatrists to 6,300 patients.
- 9,000 services delivered by an Aboriginal and Torres Strait Islander Health Practitioner or Health Worker to 7,400 patients (with referral from a GP).
Trends over time
Between 2016–17 and 2021–22:
- The number of follow-up services delivered by an Aboriginal and Torres Strait Islander Health Practitioner or Practice Nurse on behalf of a GP increased from 232,000 in 2016–17 to 325,000 in 2019–20, then fell to 256,000 by 2021–22.
- Similarly, the number of follow-up services delivered by an allied health professional (with referral from a GP) increased from 55,100 in 2016–17 to 67,800 in 2020–21, then fell to 57,800 by 2021–22.
Figure 18: Use of First Nations follow-up services, by practitioner type, 2016–17 to 2021–22
A set of interactive graphs over 2 tabs. Refer to table FS02 in data tables. A long description is available below.
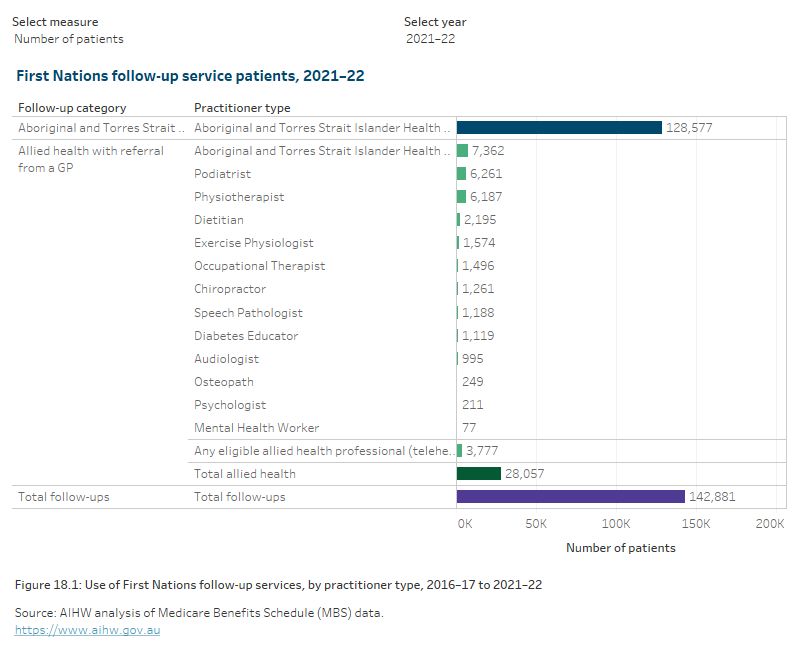
A set of interactive graphs over 2 tabs. The first is a bar graph showing follow-up services used by practitioner type, showing that Aboriginal and Torres Strait Islander Health Practitioner or Practice Nurse was by far the most common practitioner type in 2021–22. The second is a line graph showing use of follow-up services trending up between 2016–17 and 2019–20, then trending down to 2021–22. Refer to table FS02 in data tables.