Greater Capital City Statistical Area (GCCSA) comparisons
On this page:
Explore the data in the visualisation below.
Notes
- This section reflects the number and proportion of health check patients who received a First Nations follow-up service in the 12 months following their health check, by the year that their health check was delivered.
- Some records from a small number of service providers have been excluded due to data quality concerns.
Geographic information
This analysis is based on the postcode of the patient’s given mailing address. As a result, the data may not always reflect where the person actually lived – particularly for people who use PO boxes. This is likely to impact some areas more than others and will also have a generally greater impact on the accuracy of smaller geographic areas.
Latest data
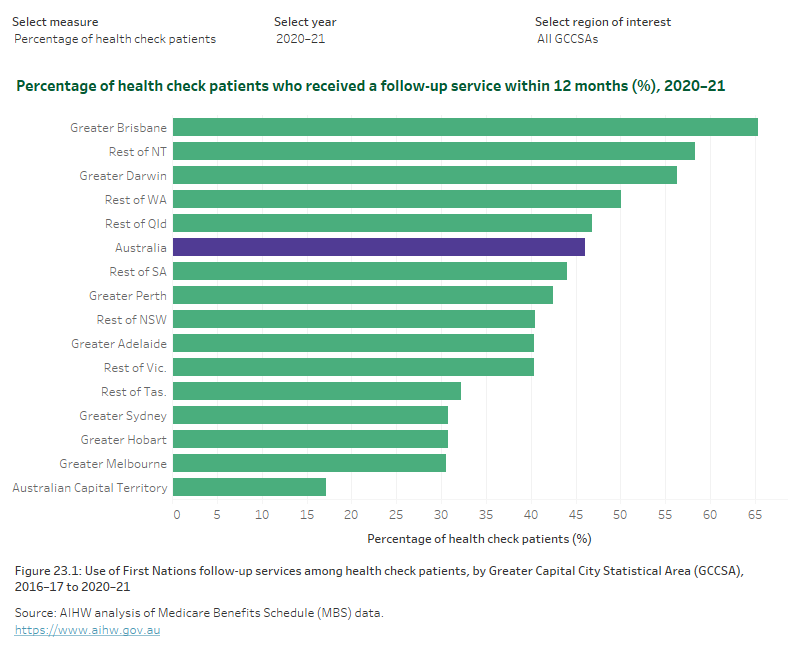
Among health check patients in 2020–21:
- Greater Brisbane had the highest proportion of health check patients going on to receive a follow-up within 12 months, at 65% (16,900 patients with a follow-up).
- Australian Capital Territory had the lowest follow-up percentage, at 17% (256 patients with a follow-up).
Trends over time
Among health check patients from 2016–17 to 2020–21:
- Nearly every GCCSA (14 out of 15) had a higher follow-up percentage for 2020–21 compared with 2016–17.
- Rest of WA had the largest percentage-point increase in follow-up use, rising from 32% for 2016–17 to 50% for 2020–21 (5,300 patients to 7,700 for respective years).
- Rest of SA had the only percentage-point decrease in follow-up use, falling from 47% for 2016–17 to 44% for 2020–21 (2,300 patients to 2,200 for respective years).
Figure 23: Use of First Nations follow-up services among health check patients, by Greater Capital City Statistical Area (GCCSA), 2016–17 to 2020–21
A set of interactive graphs over 2 tabs. Refer to table FS07 in data tables. A long description is available below.
A set of interactive graphs over 2 tabs. The first is a bar graph showing the proportion of health check patients who had a follow-up within 12 months of their health check, by GCCSA, showing Greater Brisbane was the GCCSA with the highest follow-up percentage for 2020–21's patients. The second is a line graph showing follow-up percentage between 2016–17 to 2020–21, varying by GCCSA. Refer to table FS07 in data tables.