Comparison of areas grouped by socioeconomic similarity
On this page:
Explore the data in the visualisation below.
Notes
- This section reflects the number and proportion of health check patients who received a First Nations follow-up service in the 12 months following their health check, by the year that their health check was delivered.
- Some records from a small number of service providers have been excluded due to data quality concerns.
Exploratory analysis: Areas grouped by socioeconomic similarity
- Statistical Areas Level 3 (SA3s) were grouped into 5 clusters, based on the proportion of Aboriginal and/or Torres Strait Islander people counted in each decile from the ABS’ 2016 Census-based Index of Household Advantage and Disadvantage (IHAD) analysis (ABS 2019a). All clusters contain some people from each of the 10 IHAD deciles, but the proportions vary considerably. Note that socioeconomic characteristics may have changed over time.
- The 5 socioeconomic clusters in this section contain different numbers of SA3s and different numbers of First Nations people.
- Clusters were designed to capture targeted population proportions. Population apportionment was based on the Aboriginal and/or Torres Strait Islander estimated resident population in 2016 by SA3 (ABS 2018). The first cluster contains approximately 10% of the First Nations population; the second, 20%; the third, 40%; the fourth, 20%; and the fifth, 10%.
Geographic information
This analysis is based on the postcode of the patient’s given mailing address. As a result, the data may not always reflect where the person actually lived – particularly for people who use PO boxes. This is likely to impact some areas more than others and will also have a generally greater impact on the accuracy of smaller geographic areas.
Latest data
Among health check patients in 2020–21:
- There was a weak association between the socioeconomic cluster position and the proportion of health check patients who received a follow-up service within 12 months.
- People living in the most disadvantaged (first) cluster had the highest follow-up percentage, at 53% (12,300 patients with a follow-up).
- The most advantaged (fifth) cluster had the lowest follow-up percentage, at 42% (6,300 patients with a follow-up).
- The fourth cluster had the second-highest follow-up percentage, at 48%, bucking the trend (22,100 patients with a follow-up).
Trends over time
Among health check patients from 2016–17 to 2020–21:
- The only cluster of SA3s in which the follow-up percentage decreased over the time-series was the most disadvantaged (first) cluster. The percentage dropped in the most recent years from 59% for 2018–19 to 53% for 2020–21.
- The other 4 clusters had a higher follow-up percentage for 2020–21 than for 2016–17.
Figure 26: Use of First Nations follow-up services among health check patients, by socioeconomic cluster, 2016–17 to 2020–21
A set of interactive graphs over 2 tabs. Refer to table FS10 in data tables. A long description is available below.
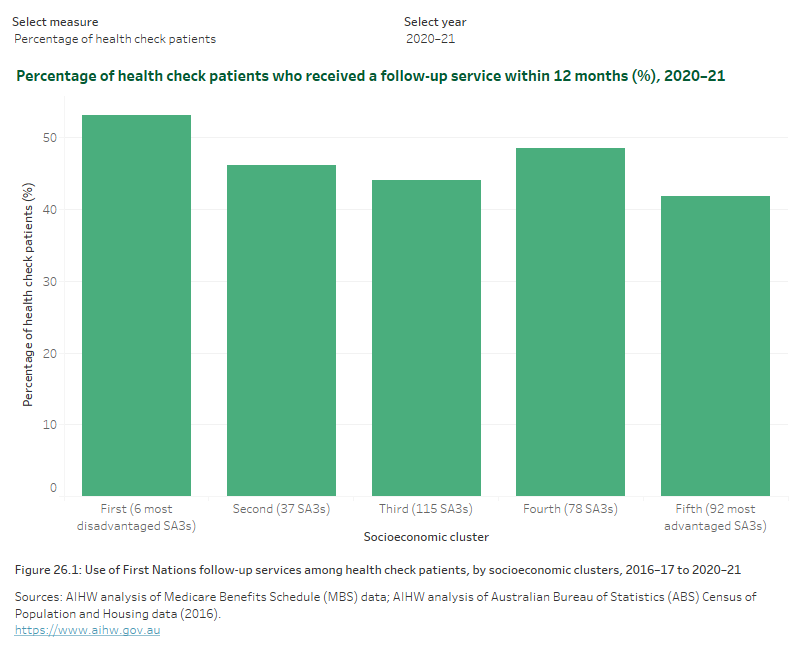
A set of interactive graphs over 2 tabs. The first is a column graph showing the proportion of health check patients who had a follow-up within 12 months of their health check, by socioeconomic cluster, showing follow-up percentage was highest in the most disadvantaged socioeconomic cluster for 2020–21's patients. The second is a line graph showing follow-up percentage between 2016–17 to 2020–21, varying by socioeconomic cluster. Refer to table FS10 in data tables.
References
ABS (2018) Estimates of Aboriginal and Torres Strait Islander Australians, June 2016, ABS website, Australian Government, accessed 10 August 2023.
ABS (Australian Bureau of Statistics) (2019a) Experimental Index of Household Advantage and Disadvantage, 2016, ABS, Australian Government, accessed 10 August 2023.