Comparison of areas grouped by socioeconomic similarity
On this page:
Explore the data in the visualisation below.
Exploratory analysis: Areas grouped by socioeconomic similarity
- Statistical Areas Level 3 (SA3s) were grouped into 5 clusters, based on the proportion of Aboriginal and/or Torres Strait Islander people counted in each decile from the ABS’ 2016 Census-based Index of Household Advantage and Disadvantage (IHAD) analysis (ABS 2019a). All clusters contain some people from each of the 10 IHAD deciles, but the proportions vary considerably. Note that socioeconomic characteristics may have changed over time.
- The 5 socioeconomic clusters in this section contain different numbers of SA3s and different numbers of First Nations people.
- Clusters were designed to capture targeted population proportions. Population apportionment was based on the Aboriginal and/or Torres Strait Islander estimated resident population in 2016 by SA3 (ABS 2018). The first cluster contains approximately 10% of the First Nations population; the second, 20%; the third, 40%; the fourth, 20%; and the fifth, 10%.
Geographic information
This analysis is based on the postcode of the patient’s given mailing address. As a result, the data may not always reflect where the person actually lived – particularly for people who use PO boxes. This is likely to impact some areas more than others and will also have a generally greater impact on the accuracy of smaller geographic areas.
Latest data
In 2021–22:
- The proportion of the population that received a health check decreased somewhat with increasing socioeconomic advantage.
- People living in the most advantaged (fifth) cluster of SA3s had the lowest health check uptake, at 14% (13,500 patients).
- The second cluster had the highest health check uptake, at 27% (44,800 patients).
- The most disadvantaged (first) cluster had health check uptake of 23% (18,100 patients).
By age
In 2021–22:
- Among young children (ages 0–4), those from the most disadvantaged cluster of SA3s had the highest uptake of health checks, at 30%, with uptake dropping in increasingly advantaged clusters.
- People in all other age groups had lower uptake of health checks in the most disadvantaged (first) cluster, relative to the second cluster.
Trends over time
Between 2016–17 and 2021–22:
- In earlier years, the most disadvantaged clusters tended to have comparatively high uptake of health checks.
- Between 2020–21 and 2021–22, health check uptake in the most disadvantaged (first) cluster fell from 30% to 23% (23,200 patients to 18,100).
- The decrease was particularly sharp among 0–4-year-olds, whose uptake of health checks dropped from 43% in 2020–21 to 30% in 2021–22 (3,000 patients to 2,000).
Figure 8: Use of First Nations health checks, by socioeconomic cluster, by age group, 2016–17 to 2021–22
A set of interactive graphs over 3 tabs. Refer to table HC08 in data tables. A long description is available below.
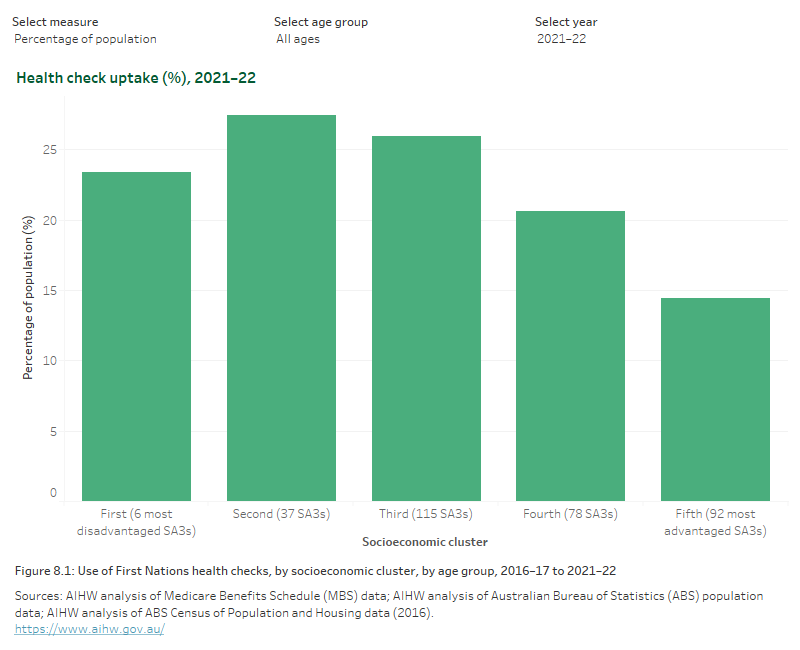
A set of interactive graphs over 3 tabs. The first is a column graph showing uptake of health checks by socioeconomic cluster, showing health check uptake generally decreasing with increasing socioeconomic advantage in 2021–22. The second is a line graph showing uptake of health checks by socioeconomic cluster between 2016–17 and 2021–22, showing that between 2020–21 and 2021–22 the health check uptake dropped the most among people living in the most disadvantaged socioeconomic cluster. The third is a line graph showing age-specific uptake of health checks in the various socioeconomic clusters between 2016–17 and 2021–22, showing health check uptake has been trending down in every age group in the most disadvantaged socioeconomic cluster since 2017–18. Refer to table HC08 in data tables.
References
ABS (2018) Estimates of Aboriginal and Torres Strait Islander Australians, June 2016, ABS website, Australian Government, accessed 10 August 2023.
ABS (Australian Bureau of Statistics) (2019a) Experimental Index of Household Advantage and Disadvantage, 2016, ABS, Australian Government, accessed 10 August 2023.