Comparison of areas by socioeconomic ranking
Notes
- This section reflects the number and proportion of health check patients who received a First Nations follow-up service in the 12 months following their health check, by the year that their health check was delivered.
- Some records from a small number of service providers have been excluded due to data quality concerns.
Exploratory analysis: Areas ranked by socioeconomic profile
- Relative socioeconomic scores were calculated for PHNs, IREGs and SA4s based on the number of Aboriginal and/or Torres Strait Islander people counted in each decile from the ABS’ 2016 Census-based Index of Household Advantage and Disadvantage (IHAD) analysis (ABS 2019a).
- Effectively, the socioeconomic scores for each area give the average IHAD decile number for the First Nations population (living in private dwellings). Note that socioeconomic characteristics may have changed over time.
Geographic information
This analysis is based on the postcode of the patient’s given mailing address. As a result, the data may not always reflect where the person actually lived – particularly for people who use PO boxes. This is likely to impact some areas more than others and will also have a generally greater impact on the accuracy of smaller geographic areas.
Among health check patients from 2016–17 to 2020–21:
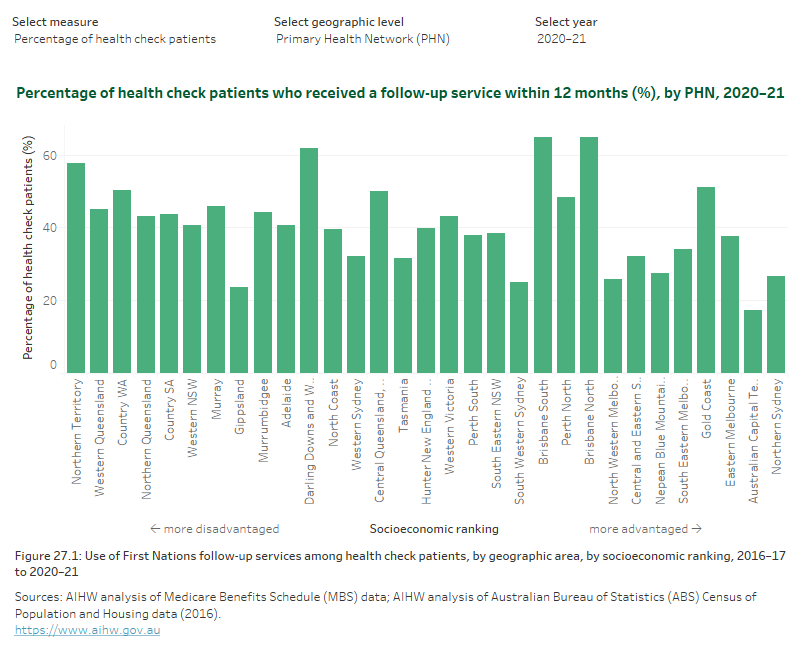
- There was little consistency in the follow-up percentage for areas with similar socioeconomic profiles, however, First Nations people living in the most disadvantaged PHNs, IREGs and SA4s tended to have higher follow-up percentages than those living in the most advantaged areas.
- Some SA4 populations had relatively high follow-up percentages – compared with SA4s with similar socioeconomic profiles – many of which were in Queensland.
Figure 27: Use of First Nations follow-up services among health check patients, by geographic area, by socioeconomic ranking, 2016–17 to 2020–21
An interactive graph. Refer to table FS11 in data tables. A long description is available below.

An interactive column graph showing the proportion of health check patients who had a follow-up within 12 months of their health check, by geographic area, showing possible indication that follow-up percentage decreases as socioeconomic status increases. Refer to table FS11 in data tables.
References
ABS (Australian Bureau of Statistics) (2019a) Experimental Index of Household Advantage and Disadvantage, 2016, ABS, Australian Government, accessed 10 August 2023.


