Greater Capital City Statistical Area (GCCSA) comparisons
On this page:
Explore the data in the visualisation below.
Geographic information
This analysis is based on the postcode of the patient’s given mailing address. As a result, the data may not always reflect where the person actually lived – particularly for people who use PO boxes. This is likely to impact some areas more than others and will also have a generally greater impact on the accuracy of smaller geographic areas.
Latest data
In 2021–22:
- Greater Darwin had the highest uptake of health checks, at 31% (5,900 patients).
- Greater Melbourne had the lowest uptake of health checks, at 7.7% (2,600 patients).
Trends over time
Between 2016–17 and 2021–22:
- In about three-quarters of GCCSAs (11 out of 15), the proportion of people receiving a health check was lower in 2021–22 compared with 2016–17, after an initial rise in uptake.
- Greater Hobart had the largest percentage-point increase in health check uptake, rising from 9.8% in 2016–17 to 16% by 2021–22 (1,000 patients to 1,800 in respective years).
- Rest of NT had the largest percentage-point decrease in health check uptake, falling from 37% in 2017–18 to 24% in 2021–22 (21,800 patients to 14,000 in respective years).
Figure 5: Use of First Nations health checks, by Greater Capital City Statistical Area (GCCSA), 2016–17 to 2021–22
A set of interactive graphs over 2 tabs. Refer to table HC05 in data tables. A long description is available below.
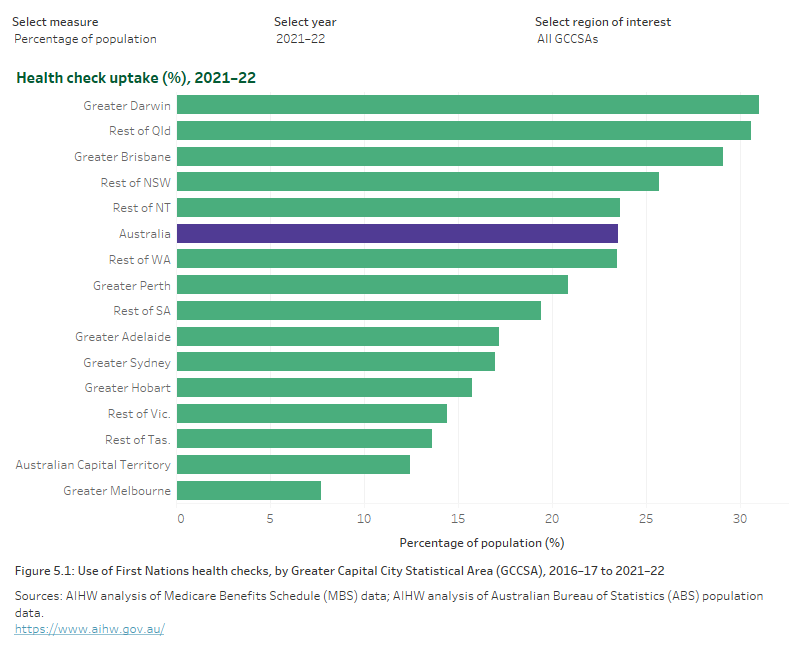
A set of interactive graphs over 2 tabs. The first is a bar graph showing uptake of health checks by GCCSA, showing Greater Darwin was the GCCSA with the highest health check uptake in 2021–22. The second is a line graph showing the varying uptake in health checks by GCCSA from 2016–17 to 2021–22, decreasing across all GCCSA from 2020–21 to 2021–22. Refer to table HC05 in data tables.