Birthweight (PI01 and PI02)
Indicators related to birthweight in the national Key Performance Indicators (nKPI) collection are:
- birthweight recorded (PI01): the proportion of First Nations babies born within the previous 12 months who attended the organisation more than once and whose birthweight was recorded
- birthweight result (PI02): the proportion of First Nations babies born within the previous 12 months who attended the organisation more than once and whose birthweight result was low, normal or high.
There have been changes to the specifications of these indicators over time. For more information see Interpreting nKPI data.
Why birthweight is important
Birthweight is a key indicator of a baby’s immediate health and a determinant of their future health. Low birthweight babies (less than 2,500 grams), for example, are more likely to die in infancy or to be at increased risk of illness in infancy. Measuring birthweight allows infants to be given early and suitable intervention, which can mitigate adverse outcomes.
The targets in the National Agreement on Closing the Gap include several aimed at children, including a target to increase the proportion of First Nations babies with a healthy birthweight to 91% by 2031.
Data from the National Perinatal Data Collection show that the majority of First Nations babies have a normal birthweight, however, they are less likely to do so than non-Indigenous babies (AIHW 2023). There has been little change in this in recent years.
Birthweight recorded (PI01)
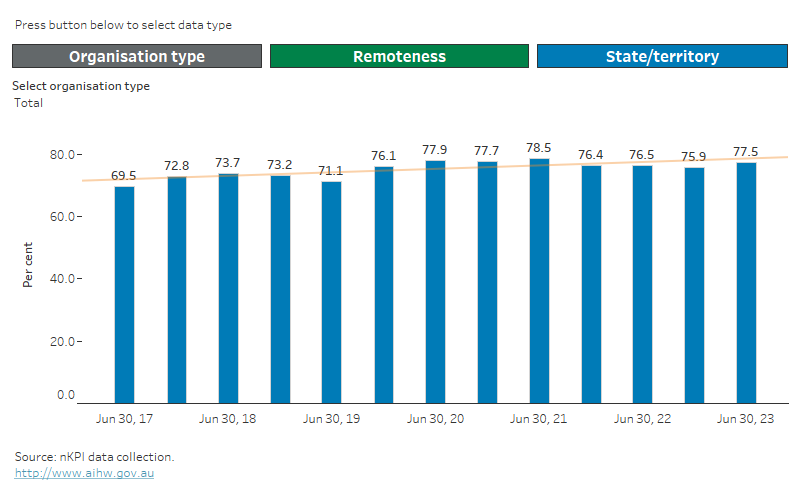
At June 2023, 77% (or around 5,900) of First Nations babies born within the previous 12 months had their birthweight recorded (Figure 1).
Figure 1: Birthweight recorded by reporting period
Birthweight recorded by reporting period
This Tableau visualisation shows the percentage of First Nations babies born in the last year whose birthweight was recorded by reporting period June 2017 to June 2023 for either:
- organisation type (ACCHO, non-ACCHO, Total)
- remoteness area (Major cities, Inner regional, Outer regional, Remote, Very remote, Total)
- state/territory (NSW/ACT, Vic, Qld, WA, SA, Tas, NT, Total).
Data supporting this visualisation are available in Excel supplementary data tables at Data.

Notes
- In June 2021, specifications changed for this indicator. For more information see Interpreting nKPI data.
- For more information, including on interpreting changes over time, see Technical notes.
Birthweight result (PI02)
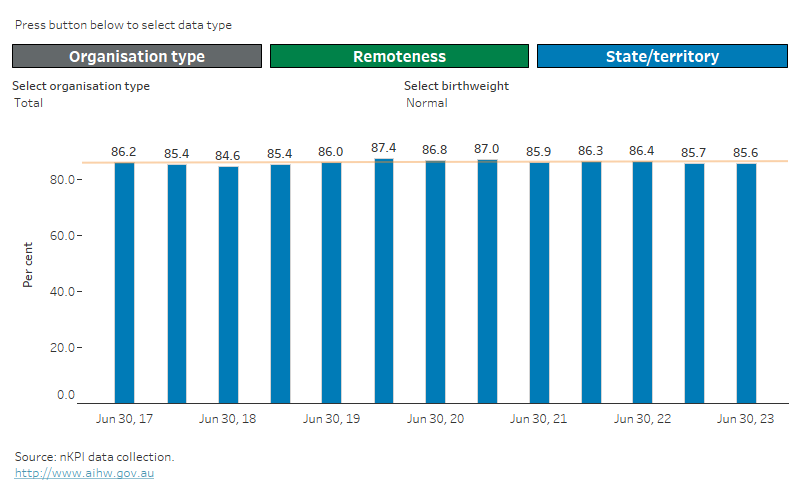
At June 2023, 86% (or around 5,000) of First Nations babies born within the previous year had a healthy (normal) birthweight (Figure 2).
Figure 2: Birthweight result by reporting period
Birthweight result by reporting period
This Tableau visualisation shows the percentage of First Nations babies born in the last year by birthweight result (select for low, normal, or high) and reporting period June 2017 to June 2023 for either:
- organisation type (ACCHO, non-ACCHO, Total)
- remoteness area (Major cities, Inner regional, Outer regional, Remote, Very remote, Total)
- state/territory (NSW/ACT, Vic, Qld, WA, SA, Tas, NT, Total).
Reporting periods of either June 2017, December 2017, June 2018, December 2018, June 2019, December 2019, June 2020, December 2020, or June 2021, December 2021, or June 2022 can be selected.
Data supporting this visualisation are available in Excel supplementary data tables at Data.

Notes
- In June 2021, specifications changed for this indicator. For more information see Interpreting nKPI data.
- For more information, including on interpreting changes over time, see Technical notes.
For more information on birthweight recording and results see Data.
Reference
AIHW (Australian Institute of Health and Welfare) (2023) Aboriginal and Torres Strait Islander Health Performance Framework: birthweight, AIHW, Australian Government, accessed 11 December 2023.


