OSR – staff (FTE)
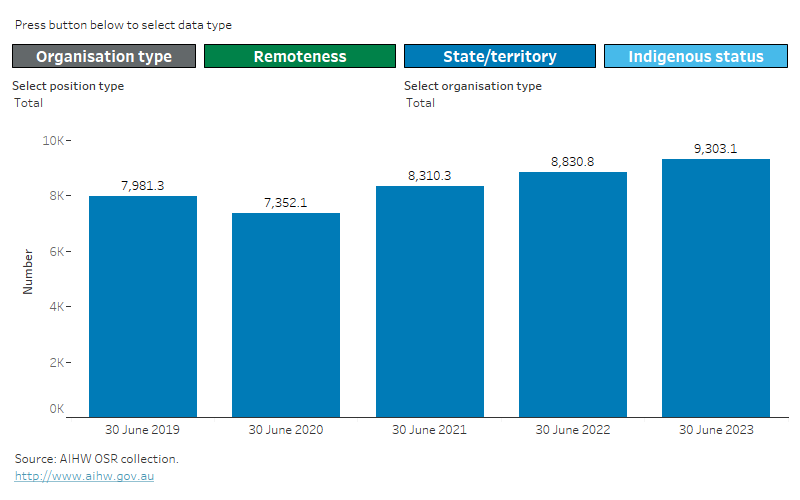
At 30 June 2023, organisations employed around 9,300 full-time equivalent (FTE) staff (Figure 1). During 2022–23, they also had around 270 visiting FTE staff not paid for by the organisations themselves.
Full-time equivalent staff
Full-time equivalent (FTE) is a standard measure of the size of a workforce that takes into account both the number of workers and the hours that each works. For example, if a workforce comprises 2 people working full-time 40 hours a week and 2 working half-time, this is the same as 3 working full-time (an FTE of 3).
In the OSR total FTE staff consists of:
- employed staff, that is, how many FTE positions an organisation paid the wages or salary for at 30 June
- visiting staff, that is, how many staff worked for but were not paid for by an organisation during the collection period.
Of the employed FTE staff:
- 93% (or around 8,700 FTE) were in Aboriginal Community Controlled Health Organisations (ACCHOs)
- 23% (or around 2,100 FTE) were in Major cities, 23% (2,100) in Inner regional areas, 19% (1,800) in Outer regional areas, 19% (1,700) in Remote areas and 17% (1,500) in Very remote areas
- 51% (or around 4,800 FTE) were First Nations people
- 54% (or around 5,100 FTE) were health staff.
Figure 1: Employed FTE staff by reporting period and position type
Employed FTE staff by reporting period
This Tableau visualisation shows the number of employed FTE staff at 30th of June for reporting periods 2018–19 to 2022–23 by position type (Administrative and clerical staff, Aboriginal health worker/practitioner, CEO/manager/supervisor, dental care, doctor, driver/field officer, health promotion, medical specialist, nurse, midwife, other health, other support staff, outreach worker, social and emotional wellbeing, substance misuse/DoA worker, total) and either:
- type of organisation (ACCHO, non-ACCHO)
- remoteness area (Major cities, Inner regional, Outer regional, Remote, Very remote)
- state/territory (NSW/ACT, Vic, Qld, WA, SA, Tas, NT)
- First Nations status (First Nations, non-Indigenous).
Data supporting this visualisation are available in Excel supplementary data tables at Data.

Notes
- ‘Other health’ positions include sexual health workers, traditional healers, environmental health workers, trainee positions and ‘other’ health workers.
- For more information, including on interpreting changes over time, see Technical notes.
Compared with non-ACCHOS, ACCHOs employed a higher proportion of First Nations staff (52% compared with 40%).
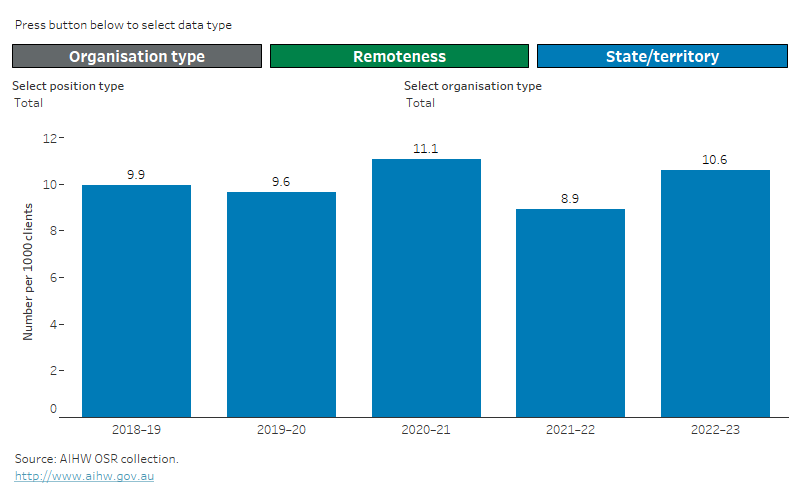
There were around 10.6 total (employed and visiting) health FTE staff per 1,000 clients (Figure 2). ACCHOs had a higher number of total health staff per 1,000 clients than non-ACCHOs (11.6 compared with 6.9).
Figure 2: Total health FTE staff per 1,000 clients by reporting period and position type
Employed FTE staff per 1,000 clients by reporting period
This Tableau visualisation shows the number of employed FTE staff per 1,000 clients at 30th of June for reporting periods 2018–19 to 2022–23 by position type (Aboriginal health worker/practitioner, allied health professional, dental care, doctor, health promotion, medical specialist, nurse, midwife, other health, outreach worker, social and emotional wellbeing, substance misuse/DoA worker, total) and either:
- type of organisation (ACCHO, non-ACCHO)
- remoteness area (Major cities, Inner regional, Outer regional, Remote, Very remote)
- state/territory (NSW/ACT, Vic, Qld, WA, SA, Tas, NT)
Data supporting this visualisation are available in Excel supplementary data tables at Data.

Notes
- Includes employed and visiting FTE staff. Employed staff FTE are as at 30 June each period. Visiting staff FTE and number of clients are for a 12 month period from 1 July to 30 June each period.
- For more information, including on interpreting changes over time, see Technical notes.
For more information on FTE staff see Data.


