OSR – client contacts
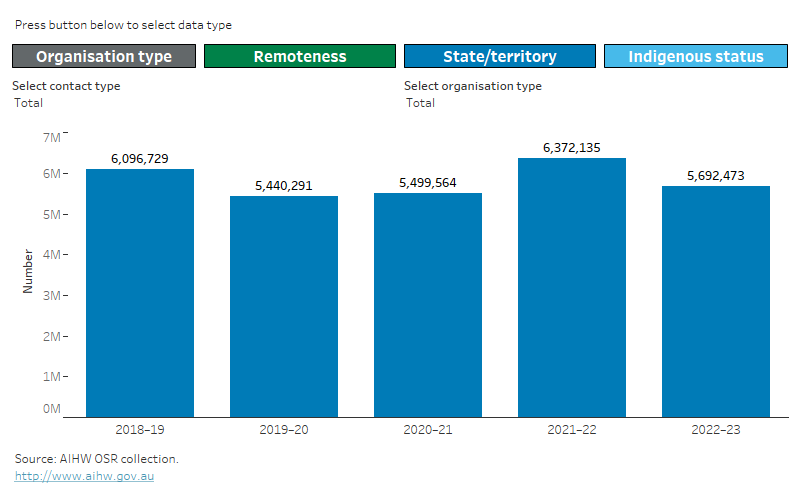
In 2022–23, organisations had around 5.7 million client contacts (Figure 1). The number of client contacts decreased by 12% between 2021–22 and 2022–23. This was mostly a result of the large (37%) decrease in episodes of care for non-Indigenous clients and likely reflects the jump in non-Indigenous clients seeking COVID-related services in 2021–22 followed by a return to a more ‘normal’ service provision the following year.
Client contact
Client contacts are a count of the contacts made by each type of health worker in an organisation (both employed and visiting health staff) and include those made by drivers and field officers (transport contacts). Client contacts do not include administrative contacts or those relating to groups and residential care.
Figure 1: Client contacts by reporting period and contact type
Client contacts by reporting period
This Tableau visualisation shows the number of client contacts for reporting periods 2018–19 to 2022–23 by contact type (Aboriginal health worker/practitioner, allied health, medical specialists, general practitioner, nurse, midwife, social emotional and wellbeing staff, transport, other health or total and either:
- type of organisation (ACCHO, non-ACCHO)
- remoteness area (Major cities, Inner regional, Outer regional, Remote, Very remote)
- state/territory (NSW/ACT, Vic, Qld, WA, SA, Tas, NT)
- First Nations status (First Nations, non-Indigenous, unknown).
Data supporting this visualisation are available in Excel supplementary data tables at Data.

Note: For more information, including on interpreting changes over time, see Technical notes.
Of client contacts:
- 91% (or around 5.2 million) were provided by Aboriginal Community Controlled Health Organisations (ACCHOs)
- 23% (or around 1.3 million) were provided in Inner regional areas, 22% (1.2 million) in Major cities, 21% (1.2 million) in Outer regional areas, 18% (1.0 million) in Remote areas and 17% in Very remote areas
- 87% (5.0 million) were with First Nations clients
- 32% (or around 1.8 million) were made by a general practitioner (GP)
- 30% (or around 1.7 million) were made by nurses
11% (or around 625,000) were made by Aboriginal and Torres Strait Islander health workers and practitioners.
There were an average of 11.2 contacts per client.
For more information on client contacts see Data.


