nKPI – organisations

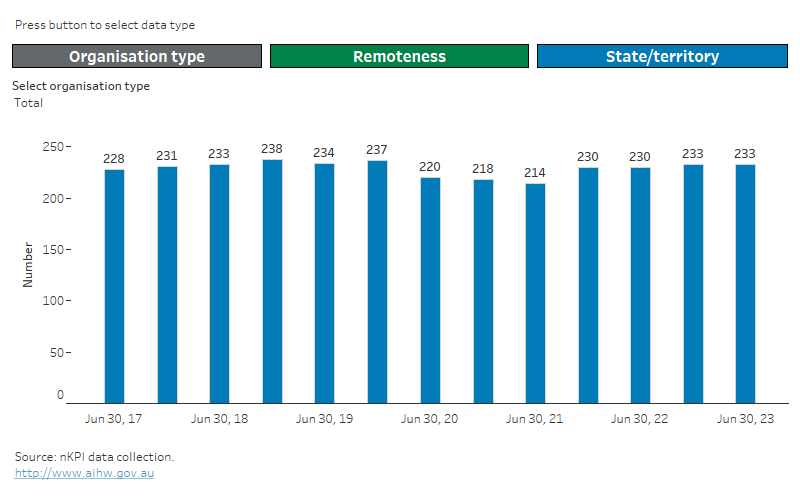
At June 2022, 230 organisations reported to the national Key Performance Indicators (nKPI) collection. Of these:

  • 29% (or 67) were in the Northern Territory
  • 33% (or 77) were in Very remote areas
  • 64% (or 148) were Aboriginal Community Controlled Health Organisations (ACCHOs), of which:
    • 26% (38) were in Queensland, 26% (38) were in New South Wales/the Australian Capital Territory (combined), 18% (27) were in Victoria/Tasmania (combined), 12% (18) were in the Northern Territory, 11% (16) were in Western Australia and 7% (11) were in South Australia
    • 26% (39) were in Inner regional areas, 24% (36) were in Outer regional areas, 22% (32) were in Very remote areas, 16% (23) were in Remote areas and 12% (18) were in Major cities
  • 36% (or 82) were organisations other than Aboriginal Community Controlled Health Organisations (non-ACCHOs), of which:
    • 60% (49) were in the Northern Territory, 18% (15) were in New South Wales/the Australian Capital Territory (combined), 9% (7) were in South Australia, 7% (6) were in Queensland, 5% (4) were in Victoria/Tasmania (combined) and 1% (1) were in Western Australia
    • 55% (45) were in Very remote areas, 13% (11) were in Inner regional areas, 12% (10) were in Major cities, 10% (8) were in Outer regional areas and 10% (8) were in Remote areas.

First Nations-specific primary health care organisations by reporting period, state/territory or remoteness, and organisation type

Reporting organisations, by select reporting period, select state/territory or remoteness and select organisation type

This Tableau visualisation shows the number of organisations reporting to the nKPI collection by organisation type (All, ACCHO, non-ACCHO) for either:

  • state/territory (NSW/ACT, Vic, Qld, WA, SA, Tas, NT)
  • remoteness area (Major cities, Inner regional, Outer regional, Remote, Very remote).

Reporting periods of either June 2017, December 2017, June 2018, December 2018, June 2019, December 2019, June 2020, December 2020, June 2021, December 2021, or June 2022 can be selected.

Data supporting this visualisation are available in Excel supplementary data tables at Archived content.

Note: See Technical notes for more information, including on interpreting changes over time.