OSR – vacancies (FTE)
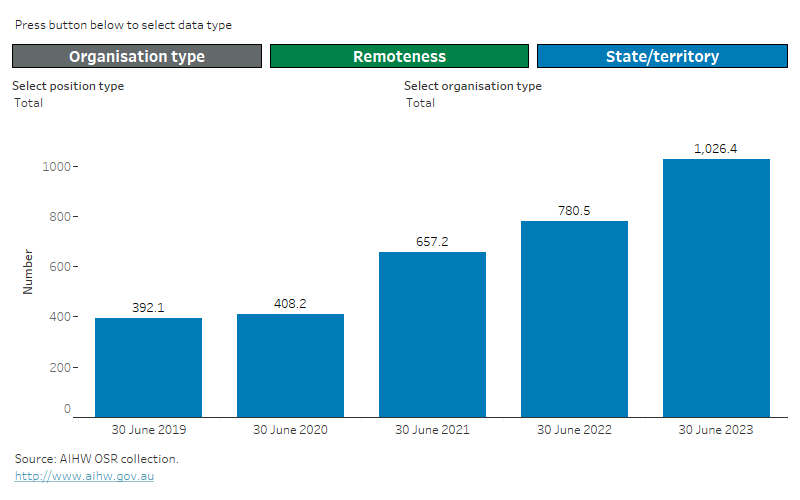
At 30 June 2023, organisations had over 1,000 vacant full-time equivalent (FTE) positions (Figure 1).
Full-time equivalent vacant positions
Full-time equivalent (FTE) is a standard measure of the size of a workforce that takes into account both the number of workers and the hours that each works. For example, if a workforce comprises 2 people working full-time 40 hours a week and 2 working half-time, this is the same as 3 working full-time (an FTE of 3).
In the OSR, full-time equivalent vacant positions are how many vacant positions an organisation had at 30 June.
Of the vacant full-time equivalent (FTE) positions:
- 86% (or around 880 FTE) were at Aboriginal Community Controlled Health Organisations (ACCHOs)
- 32% (or around 330 FTE) were in Remote areas, 21% (210) in Major cities, 20% (210) in Very remote areas, 14% (145) in Outer regional areas and 13% (135) in Inner regional areas
- 72% (or around 730 FTE) were for health positions.
Figure 1: Vacant FTE positions by reporting period and position type
Vacant FTE positions by reporting period
This Tableau visualisation shows the number of vacant FTE positions at 30th of June for reporting periods 2018–19 to 2022–23 by position type (Administrative and clerical staff, Aboriginal health worker/practitioner, allied health professional, CEO/manager/supervisor, doctor, driver/field officer, medical specialist, nurse, midwife, other health, other support staff, social and emotional wellbeing, total) and either:
- type of organisation (ACCHO, non-ACCHO)
- remoteness area (Major cities, Inner regional, Outer regional, Remote, Very remote)
- state/territory (NSW/ACT, Vic, Qld, WA, SA, Tas, NT).
Data supporting this visualisation are available in Excel supplementary data tables at Data.

Note: For more information, including on interpreting changes over time, see Technical notes.
There has been an increase in the number of vacant FTE positions reported in the most recent OSR collection periods (that is, in the number of vacant FTE as at 30 June 2021, 30 June 2022 and 30 June 2023 compared with those reported for previous periods). While it is difficult to be definitive about the reasons for this, as many of the organisations with increased vacancies also had an increase in employed FTE, it is likely that at least some of these vacancies relate to the delivery of new services rather than an increase in delivery of existing services. Some of this change, especially in 2021 and 2022, may have been a result (direct or indirect) of the COVID-19 pandemic. However, not all comments organisations provided for variations in these numbers (reported for organisations with a 20% or more increase or decrease) clearly linked the increase in vacancies to COVID-19. These increases may also be the result of other unrelated factors, for example, general changes in funding, direction, structure or size resulting in more or different services being delivered. For more information on the impact of COVID-19 see Related material.
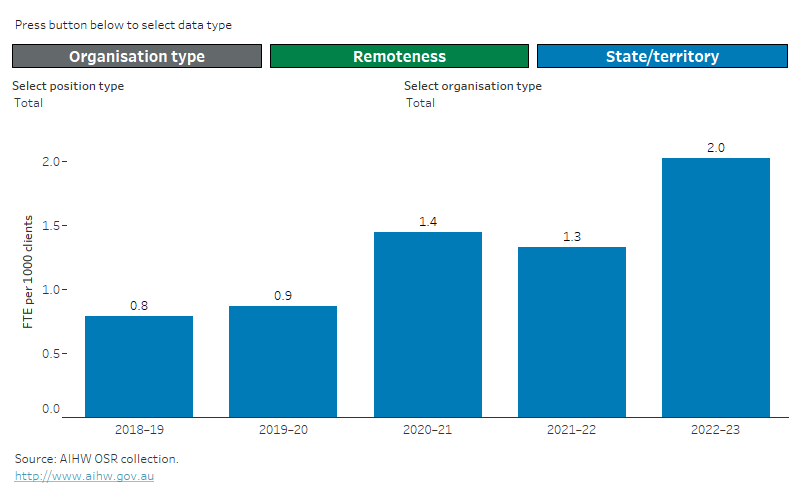
There were around 2.0 vacant FTE positions per 1,000 clients (Figure 2).
Figure 2: Vacant FTE positions per 1,000 clients by reporting period and position type
Vacant FTE positions per 1,000 clients by reporting period
This Tableau visualisation shows the number of vacant FTE positions per 1,000 clients at 30th of June for reporting periods 2018–19 to 2022–23 by position type (health staff, other staff, total) and either:
- type of organisation (ACCHO, non-ACCHO)
- remoteness area (Major cities, Inner regional, Outer regional, Remote, Very remote)
- state/territory (NSW/ACT, Vic, Qld, WA, SA, Tas, NT).
Data supporting this visualisation are available in Excel supplementary data tables at Data.

Notes:
- Vacant FTE are as at 30 June each period. Visiting staff FTE and number of clients are for a 12 month period from 1 July to 30 June each period.
- For more information, including on interpreting changes over time, see Technical notes.
For more information on vacant FTE positions see Data.


