All diabetes
Page highlights:
How many people are living with diabetes in Australia?
- More than 1.3 million (1 in 20) Australians were living with diabetes in 2021.
- Diabetes was more common among older Australians with almost 1 in 5 aged 80–84 living with diabetes.
- Males were 1.3 times as likely to be living with diabetes compared with females.
- 7.9% of Aboriginal and Torres Strait Islander people were living with diabetes in 2018–19.
How many people are newly diagnosed with diabetes in Australia?
- 49,900 people were newly diagnosed (incidence) with diabetes in 2021.
- The incidence of diabetes increased with increasing age, peaking in the 65–69 age group for both males and females.
- Since 2000, there has been a 43% decline in the age-standardised incidence rate for diabetes.
- There were around 2,200 new cases of diabetes among Aboriginal and Torres Strait Islander people in 2021.
How many people are living with diabetes in Australia?
More than 1.3 million (1 in 20) Australians were living with diabetes and currently registered with the linked National Diabetes Services Scheme (NDSS) and Australasian Paediatric Endocrine Group (APEG) state-based registers in 2021. This includes people with type 1 diabetes, type 2 diabetes and other diabetes, but excludes gestational diabetes.
Variation by age and sex
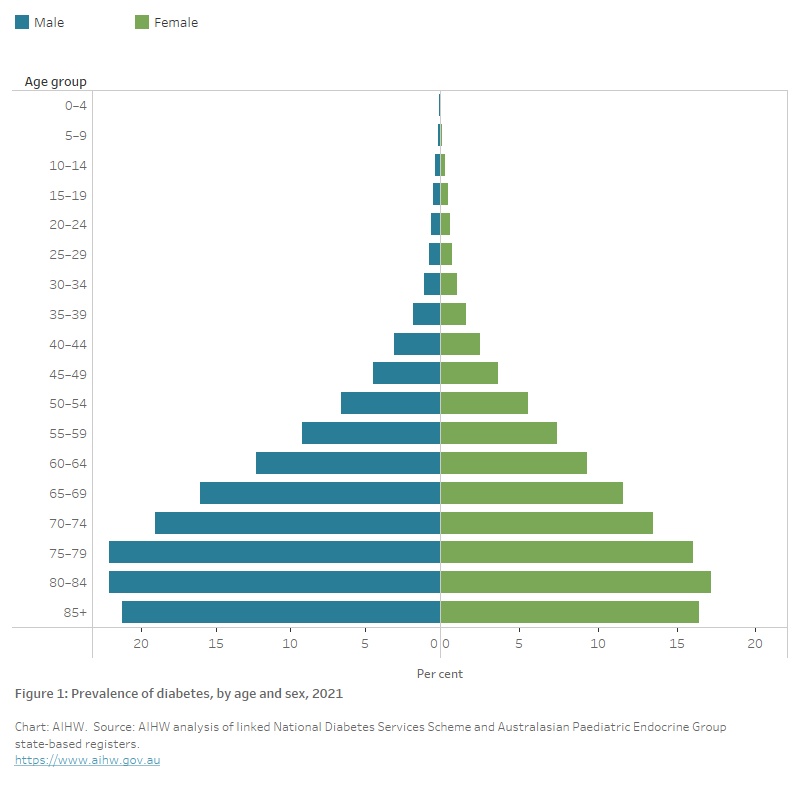
In 2021, the prevalence of diabetes, according to linked NDSS and APEG data, increased with increasing age:
- Almost 1 in 5 (19.5%) Australians aged 80–84 (22.1% males and 17.2% of females) (Figure 1) were living with diabetes in 2021, which was almost 30 times as high as those aged under 40 (0.7%).
- Diabetes was 1.3 times as common among males as females, after controlling for age.
Figure 1: Prevalence of diabetes, by age and sex, 2021
The chart shows the increasing prevalence of diabetes in 2021 by 5-year age groups, peaking in the 80–84 age group for both males and females (22.1% and 17.2%, respectively). The prevalence of diabetes is consistently higher among males than females from age 35 and over.
Trends over time
The number of people living with diabetes in Australia increased almost 2.8-fold between 2000 and 2021, from 460,000 to 1.3 million.
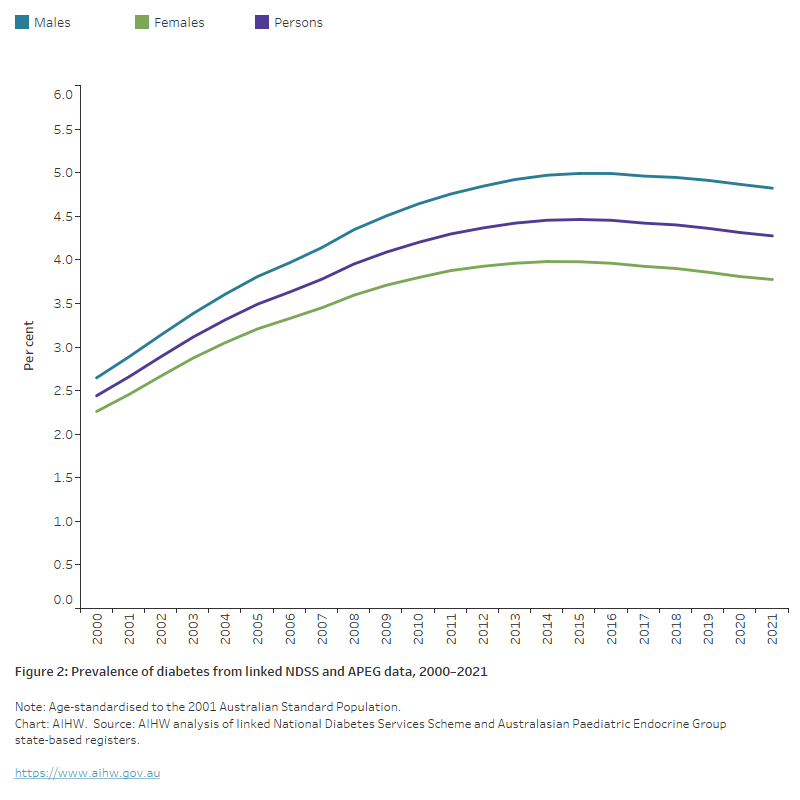
Based on linked NDSS and APEG data, the age-standardised prevalence rate increased by almost 80% between 2000 and 2021, however, rates have remained relatively stable since 2011 for both males and females (Figure 2).
Figure 2: Prevalence of diabetes from linked NDSS and APEG data, by sex, 2000–2021
This chart shows the estimated age–standardised proportion of people with diabetes based on data from the linked National Diabetes Services Scheme and Australasian Paediatric Endocrine Group between 2000 and 2021. The proportion increased from 2.4% in 2000 to 4.3% in 2021 and has remained relatively stable since 2014.
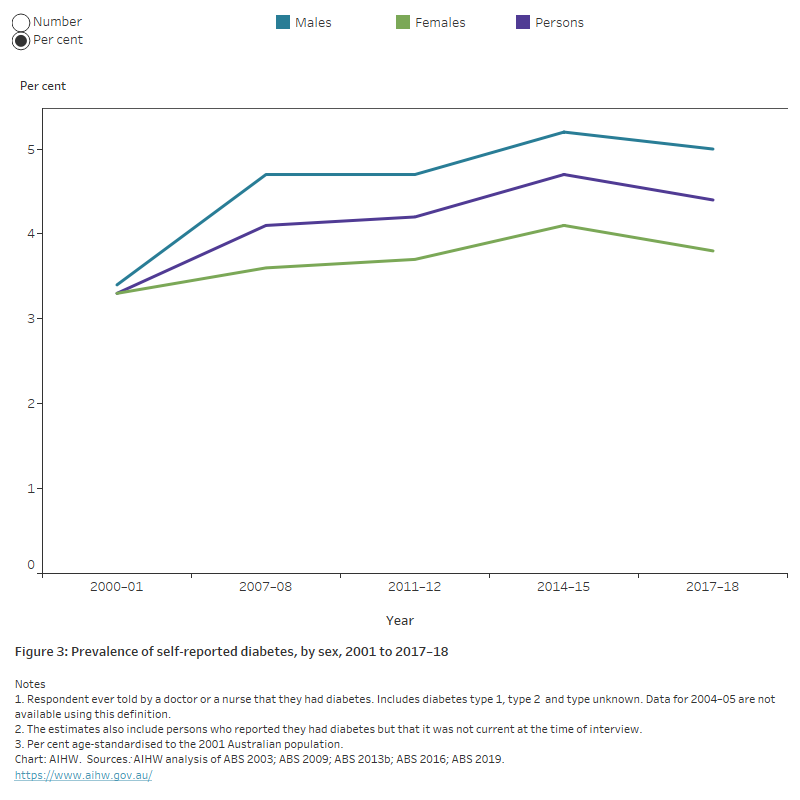
Similar patterns were found in the ABS NHS. The age-standardised prevalence rate of diabetes increased by 33% between 2001 and 2017–18. The rate of self-reported diabetes remained stable between 2014–15 and 2017–18 (Figure 3).
Note: Although the most recent NHS was conducted in 2020–21, the survey was collected during the COVID-19 pandemic, via an online, self-report format, which significantly changed the data collection and survey estimates. It is advised that the 2020–21 NHS data are considered a break in time series from previous NHS collections and should be used for point-in-time national analysis only.
Figure 3: Prevalence of self-reported diabetes from the National Health Survey, by sex, 2001 to 2017–18
The chart shows the prevalence of self-reported diabetes, by sex from 2001 to 2017–18 based on data from the ABS National Health Surveys. After adjusting for differences in the age structure of the populations, the prevalence of diabetes increased from 3.3% in 2001 to 4.7% in 2014–15 while dropping slightly to 4.4% in 2017–18. While the overall trend is similar among males and females, the prevalence of diabetes is consistently around 1.3 times higher among males than females.
Limitations of estimating diabetes prevalence
Data presented from the linked National Diabetes Services Scheme (NDSS) and Australasian Paediatric Endocrine Group (APEG) data (Figure 2) and Australian Bureau of Statistics (ABS) National Health Survey (NHS) (Figure 3) are likely to underestimate the true prevalence of diabetes in the Australian population. This is because:
- Both data sources are based on people who have received a formal medical diagnosis of diabetes. However, Australian studies have shown that many people are living with undiagnosed type 2 diabetes. For example, in the 1999–2000 AusDiab Study, half of all diabetes were undiagnosed (Dunstan et al. 2001). In the 2011–12 Australian Bureau of Statistics (ABS) Australian Health Survey (AHS), which collected blood glucose data, 20% of participating adults aged 18 and over had undiagnosed type 2 diabetes prior to the survey (ABS 2013a).
- Registration with the NDSS is voluntary and eligible people with type 2 diabetes are more likely to register if they access subsidised diabetes consumables to monitor their diabetes at home or require insulin. Some people may be diagnosed with diabetes and choose not to register with the scheme.
- Indigenous Australians are under-represented on the NDSS (see Using the NDSS for reporting on Indigenous Australians).
Despite these limitations, these data sources provide the best picture into the number of people living with diabetes in Australia to monitor changes in populations at risk, and trends over time. Further research is required to examine whether the proportion of people with undiagnosed type 2 diabetes in Australia has changed over time and the impact of this on the prevalence of disease in Australia.
Variation between population groups
Aboriginal and Torres Strait Islander people
Around 7.9% of Aboriginal and Torres Strait Islander people (64,100) were living with diabetes according to self-reported data from the ABS 2018–19 National Aboriginal and Torres Strait Islander Health Survey (NATSIHS) (ABS 2019b). This is similar to the 7.7% reported in the equivalent survey in 2012–13 (ABS 2014).
After controlling for differences in the age structure of the populations, based on self-reported and measured results, Indigenous Australians were almost 3 times as likely to be living with diabetes as their non-Indigenous counterparts.
Using the NDSS for reporting on Indigenous Australians
The representation and accuracy of data relating to Aboriginal and Torres Strait Islander people on the NDSS is influenced by a range of factors, which may reduce the accuracy of reporting on these communities and prevent the use of the NDSS for reporting on prevalence by Indigenous status.
- Before 2005, data entry for the NDSS registration form for Indigenous status coded all ‘unknown’ or ‘not stated’ responses to the Indigenous status question as ‘non-Indigenous’. In 2005, the NDSS database was amended to add an extra value to the Indigenous status variable to indicate ‘inadequate/not stated’ where Indigenous status was not known. As a result of this issue, Indigenous status cannot be determined for 98% of people registered on the NDSS prior to 2005.
- Indigenous Australians may not register with the NDSS at all. Where Indigenous people live in rural, remote and very remote locations, NDSS Access Points may be limited, or consumables may be obtained through bulk supplies provided to health services through the NDSS. Diabetes-related products can also be accessed through other programs. These issues may result in lower registration rates for the NDSS among Aboriginal and Torres Strait Islander people. For example, programs operating under Section 100 of the National Health Act 1953 – such as Aboriginal Medical Services and the National Aboriginal Community Controlled Health Organisation – provide Indigenous Australians access to free and subsidised products that people with insulin-treated diabetes need.
Remoteness area
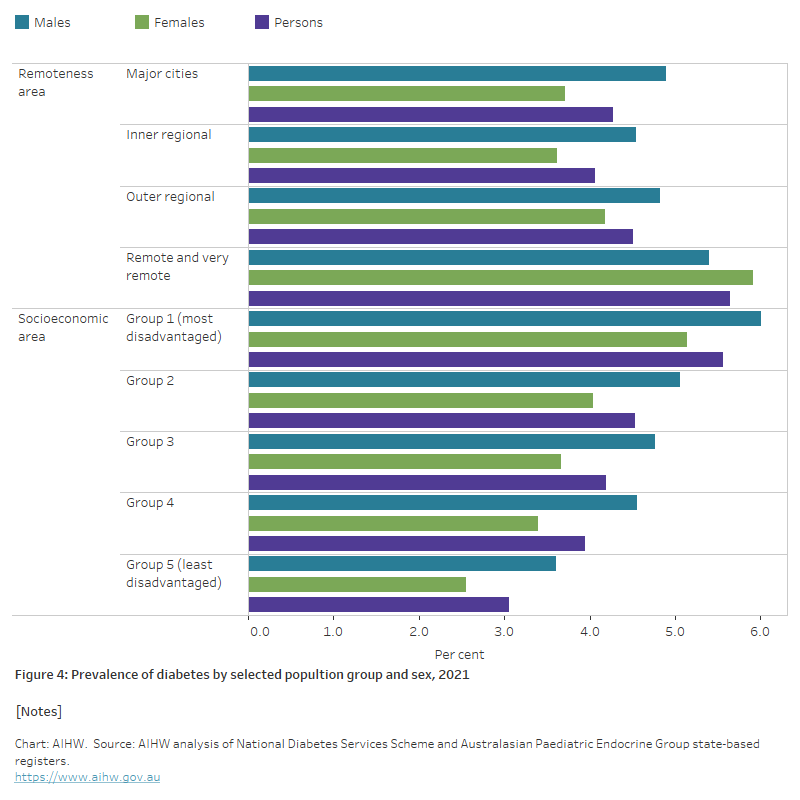
In 2021, the age-standardised prevalence rate of diabetes was highest in Remote and very remote areas where people were 1.3 times as likely to be living with diabetes as those in Major cities. The disparity in Remote and very remote areas was more pronounced among females than males (1.6 and 1.1 times as high, respectively) (Figure 4).
Socioeconomic area
In 2021, the age-standardised prevalence rate of diabetes was around 1.8 times as high among those living in the lowest socioeconomic areas as in the highest socioeconomic areas. The variation in prevalence rates between the lowest and highest socioeconomic areas was slightly higher among females than males (2.0 and 1.7 times as high, respectively) (Figure 4).
Figure 4: Prevalence of diabetes, by selected population groups and sex, 2021
The chart shows the prevalence of diabetes by selected population groups and sex in 2021. After controlling for differences in the age structures of the population, diabetes prevalence increased with increasing remoteness and socioeconomic disadvantage. Those living in Remote and very remote areas were 1.3 times as likely to have diabetes than those living in Major cities. People living in the most disadvantaged areas were 1.8 times as likely to have diabetes as those living in the least disadvantaged areas.
How many people are newly diagnosed with diabetes in Australia?
Between 2000 and 2021, over 1.4 million people newly diagnosed with diabetes (incidence) were registered on the NDSS and APEG state-based registries, including type 1 diabetes, type 2 diabetes and other diabetes but excluding gestational diabetes. This is about 64,000 people each year – an average of about 175 diagnosed individuals per day. In 2021, 49,900 people were newly diagnosed with diabetes in Australia (137 per day), equating to 194 per 100,000 population.
Variation by age and sex
In 2021, the incidence of diabetes:
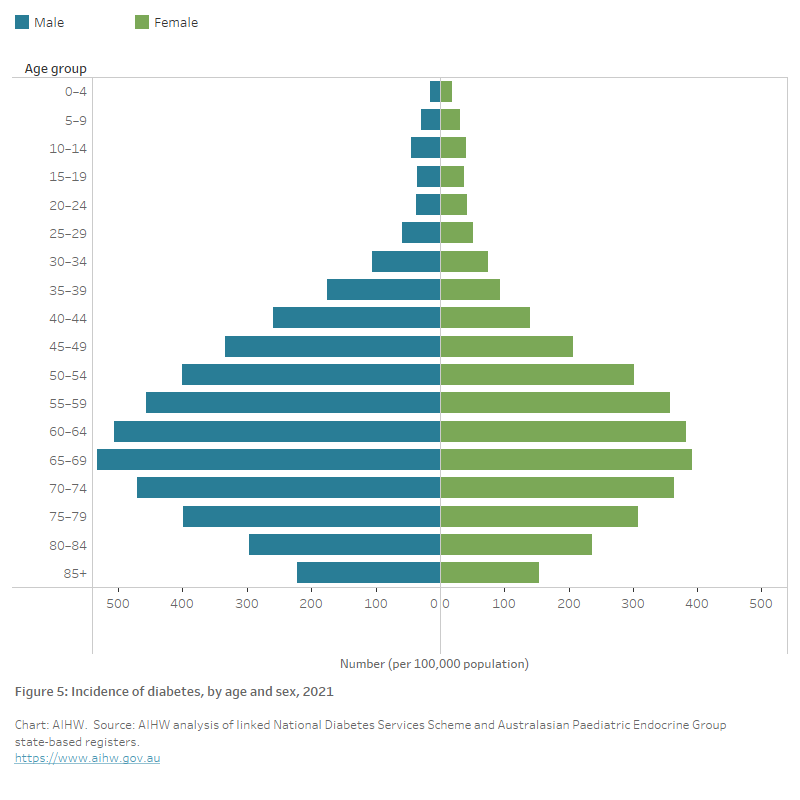
- increased with increasing age, peaking in the 65–69 age group for both males and females (532 and 392 per 100,000 population, respectively) (Figure 5)
- was 1.4 times as common among males as females overall, after controlling for age.
Figure 5: Incidence of diabetes, by age and sex, 2021
The chart shows the number of new diabetes cases (per 100,000 population) (incidence) of diabetes by 5-year age group and sex in 2021. The incidence of diabetes increased with increasing age, peaking in the 65–69 age group among both males and females (532 and 392 per 100,000 population, respectively).
Trends over time
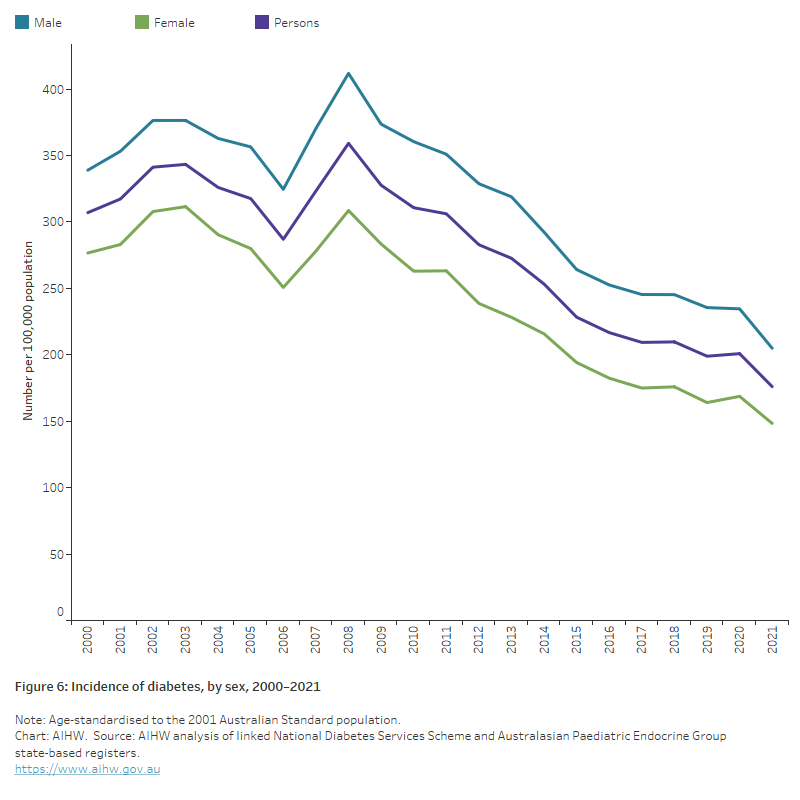
There has been a steady decline in the age-standardised diabetes incidence rate in Australia (largely driven by type 2 diabetes) between 2000 and 2021, with an overall drop of 43% (Figure 6). Although evidence from the 2019 Global Burden of Disease study as reported in The Lancet (2020) shows an overall increase in diabetes incidence globally, the observed declining trend has also been reported in several other countries (Magliano et al. 2019; Magliano et al. 2021). The fall in incidence may be due to improved preventive measures such as screening, increased awareness and educational programs leading to behavioural changes and risk factor modification (Magliano et al. 2019; Shrapnel and Butcher 2020).
Note: Some caution should be used when interpreting these trends. The NDSS is estimated to capture 80–90% of all people with diagnosed diabetes in Australia (AIHW 2009). It is uncertain how many people with diagnosed diabetes are not registering with the NDSS and how many people are living with undiagnosed diabetes. Indigenous Australians are also known to be under-represented on the NDSS.
Figure 6: Incidence of diabetes, by sex, 2000–2021
The chart shows the decreasing trend in the incidence of diabetes between 2000 and 2021, for both males and females. Overall, incidence rates fell from 307 to 176 per 100,000 population between 2000 and 2021.
Variation between population groups
Aboriginal and Torres Strait Islander people
In 2021:
- there were around 2,200 new cases of diabetes among Aboriginal and Torres Strait Islander people – a rate of 256 per 100,000 population.
- incidence rates increased with increasing age and peaked among those aged 65–69 (788 per 100,000 population).
- incidence rates were 1.2 times as high among Indigenous males compared with Indigenous females, after controlling for age.
- incidence rates were highest in the 65–69 age group in Indigenous males but in the 60–64 age group among Indigenous females (925 and 712 per 100,000 population, respectively) (Figure 7).
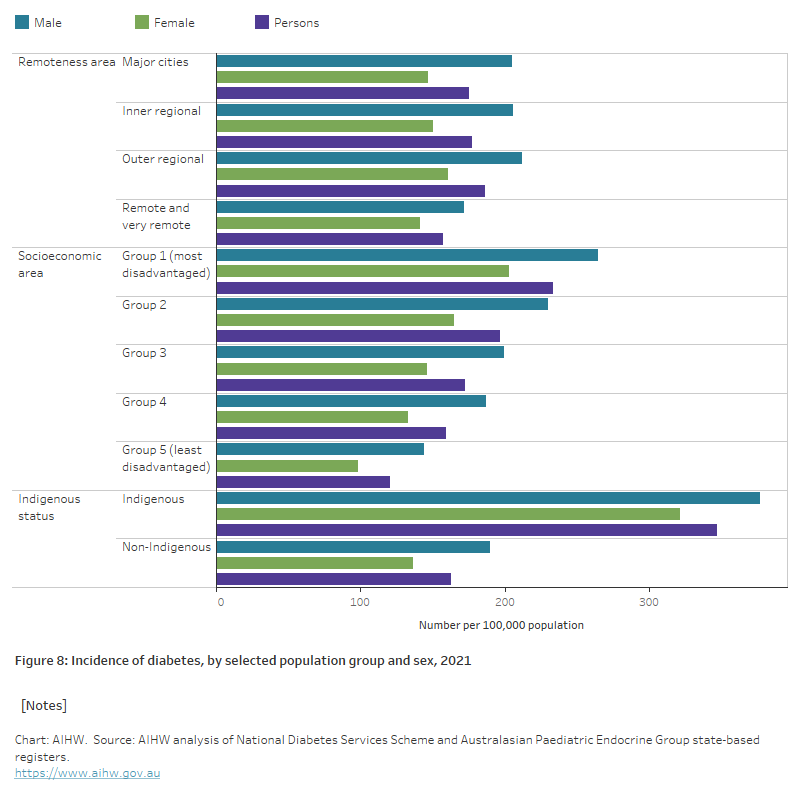
- after adjusting for differences in the age structure of the populations, the incidence of diabetes was 2.0 times as high among Indigenous males and 2.4 times as high among Indigenous females compared with their non-Indigenous counterparts (Figure 8).
Figure 7: Incidence of diabetes for Aboriginal and Torres Strait Islander people, by age and sex, 2021
The chart shows the incidence of diabetes for Aboriginal and Torres Strait Islander people by 5-year age group and sex in 2021. The number of new diabetes diagnoses (incidence) per 100,000 population was highest among males aged 65–69 and females aged 60–64 (1,416 and 1,069 per 100,000 population, respectively).

Remoteness area
In 2021, age-standardised diabetes incidence rates were around 1.1 times as high in Outer regional areas compared with Major cities and Inner regional areas and 1.2 times as high as Remote and very remote areas (Figure 8).
Socioeconomic area
In 2021, age-standardised diabetes incidence rates increased with increasing levels of socioeconomic disadvantage. People living in the lowest socioeconomic areas were 1.9 times as likely to be diagnosed with diabetes as those living in the highest socioeconomic areas (Figure 8).
Figure 8: Incidence of diabetes, by selected population group and sex, 2021
The chart shows the incidence of diabetes by selected population group and sex in 2021. Age-standardised diabetes incidence rates were 1.9 as high among those living in the most disadvantaged areas as those living in the most advantaged areas and were slightly higher among people living in Outer regional areas compared with Major cities, Inner regional and Remote and very remote areas. Incidence rates were 2.1 times higher among Indigenous Australians compared with non-Indigenous Australians.
ABS (Australian Bureau of Statistics) (2003) Microdata: National Health Survey, 2001, AIHW analysis of detailed microdata.
ABS (2009) Microdata: National Health Survey, 2007–08, AIHW analysis of detailed microdata, accessed 1 December 2021.
ABS (2013a). Australian Health Survey: biomedical results for chronic diseases, 2011–12, ABS website, accessed 1 December 2021.
ABS (2013b) Microdata: Australian Health Survey—National Health Survey, 2011–12, AIHW analysis of detailed microdata, accessed 1 December 2021.
ABS (2014) Australian Aboriginal and Torres Strait Islander Health Survey: First results, Australia, 2012–13, ABS website, accessed 4 March 2022.
ABS (2016) Microdata: National Health Survey, 2014–15, AIHW analysis of detailed microdata, accessed 4 March 2022.
ABS (2019) Microdata: National Health Survey, 2017–18. AIHW analysis of detailed microdata, accessed 4 March 2022.
AIHW (Australian Institute of Health and Welfare) (2009) Diabetes prevalence in Australia: an assessment of national data sources, AIHW, Australian Government, accessed 06 June 2022.
Dunstan D, Zimmet P, Welborn T, Sicree R, Armstrong T, Atkins R et al. (2001), Diabesity & associated disorders in Australia—2000: The accelerating epidemic, The Australian Diabetes, Obesity and Lifestyle Study (AusDiab), International Diabetes Institute, accessed 6 December 2021.
Magliano DJ, Islam RM, Barr EL, Gregg EW, Pavkov ME, Harding JL, Tabesh M, Koye DN, Shaw JE (2019), Trends in incidence of total or type 2 diabetes: systematic review. BMJ, 366:I5003, doi: 10.1136/bmj.l5003
Magliano DJ, Chen L, Islam R, Carstensen B, Gregg E, Pavkov M, Andes L, Balicer R, Baviera M et al. (2021), Trends in the incidence of diagnosed diabetes: a multicountry analysis of aggregate data from 22 million diagnoses in high-income and middle-income settings, Lancet Diabetes Endocrinol., 9(4):203–211, doi: 10.1016/S2213-8587(20)30402-2.
Shrapnel WS and Butcher BE (2020), Sales of Sugar-Sweetened Beverages in Australia: A Trend Analysis from 1997 t 2018. Nutrients, 12(4): 1016, doi: 10.3390/nu12041016.
The Lancet (2020), GBD cause and risk summaries: Diabetes mellitus–Level 3 cause, The Lancet website, accessed 24 May 2023.


