Emergency department presentations
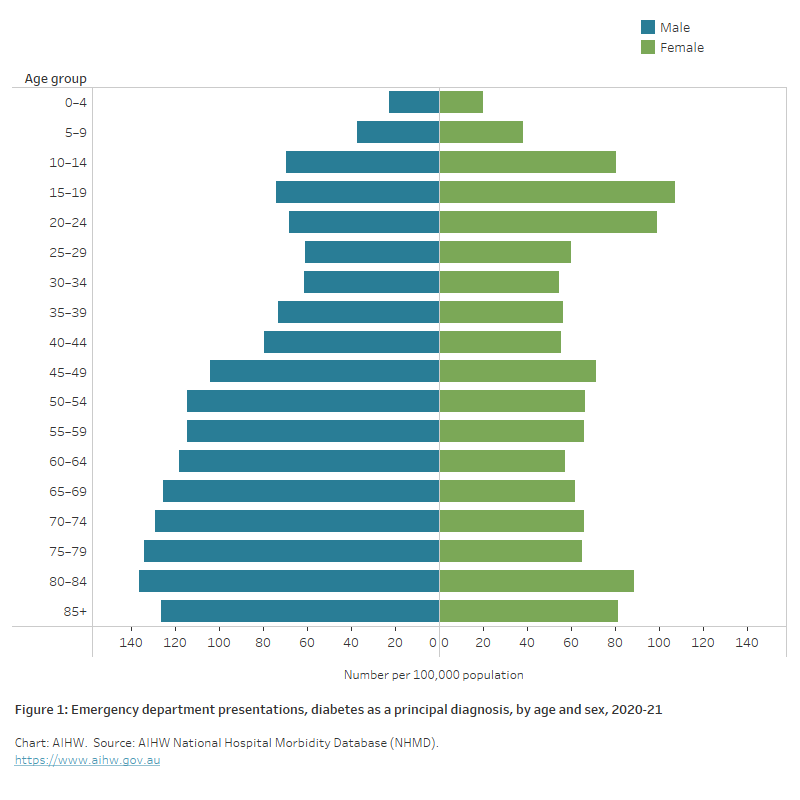
The chart shows the number of emergency department presentations with a principal diagnosis of diabetes per 100,000 population, by age group and sex in 2020–21. Between the ages of 5 and 24, females had a higher rate of presentation but in all other age groups, the rate for males was higher.
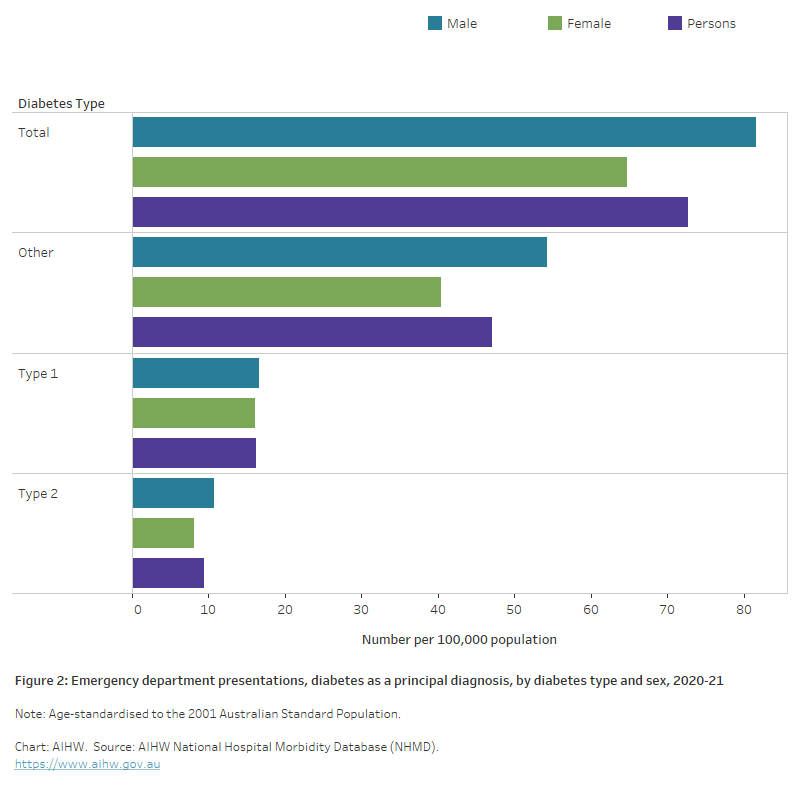
The chart shows the number of emergency department presentations with a principal diagnosis of diabetes per 100,000 population by sex and diabetes type in 2020–21. Presentations were similar by sex for type 1 diabetes and 1.4 times higher among males than females for both other diabetes and type 2 diabetes.
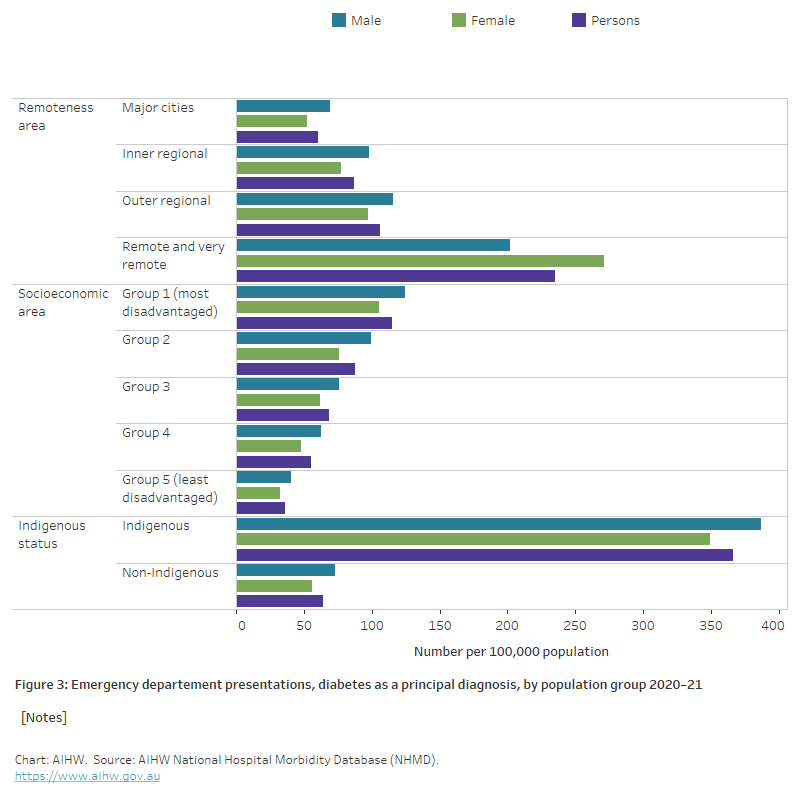
The chart shows the number of emergency department presentations with a principal diagnosis of diabetes per 100,000 population by selected population group and sex in 2020–21. Presentation rates increased both with increasing levels of socioeconomic disadvantage and remoteness while rates among Indigenous Australians were almost 6 times higher than non-Indigenous Australians.
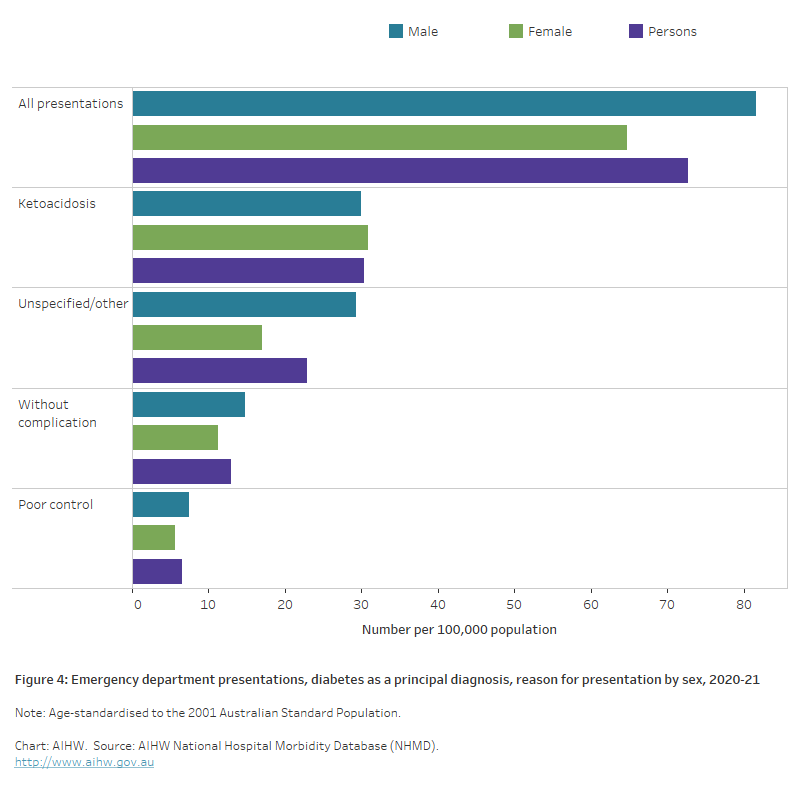
The chart shows the number of emergency department presentations with a principal diagnosis of diabetes per 100,000 population by reason for presentation and sex in 2020–21. Ketoacidosis was the main reason for presentation among both males and females while Poor (glucose) control was the least provided reason (30 and 7 per 100,000 population, respectively).