Impact of COVID-19
Page highlights:
- Results from the Australian Bureau of Statistics Household Impacts of COVID-19 Survey, suggest a varied effect on health behaviours during the early pandemic period.
- The National Diabetes Services Scheme registrations for the 12 months to December 2021 and December 2022 were 18% and 14% higher than the equivalent period prior to the pandemic in 2019.
Comorbidity with diabetes is associated with more severe outcomes for people hospitalised with COVID-19.
- The use of telehealth services rose rapidly at the start of the pandemic, with patterns of use later corresponding to new outbreaks.
- According to ABS Provisional Mortality Statistics, the age standardised diabetes death rate for 2022 (doctor-certified deaths) was 10.5% higher than the baseline average.
- Temporary guidelines likely influenced a sharp decline in the number of women receiving an oral glucose tolerance test or oral glucose challenge test for the screening of gestational diabetes throughout April to June 2020 with an overall 11% drop between 2019 and 2020.
- An unusually high volume of diabetes scripts was dispensed in March 2020 (1.6 million), coinciding with the introduction of national restrictions, followed by a decrease in April 2020 (1.2 million).
The COVID-19 pandemic has affected Australia’s population and health-care system in many ways, including economic expenditure, mortality, disability, the health workforce and disease surveillance.
Diabetes is one of many conditions correlated with greater health consequences throughout the COVID-19 pandemic including increased risk of complication and mortality (Peric and Stulnig 2020). Further, there is growing evidence that COVID-19 increases the risk of new-onset diabetes (Xie and Al-Aly 2022). This section explores the impact of COVID-19 in Australia on diabetes risk factors, new onset diabetes and people living with diabetes.
Continued monitoring will assess the evolving impact of the COVID-19 pandemic on diabetes in Australia with updates made to this report as new data become available.
Risk factors
Maintaining a healthy lifestyle, including healthy dietary patterns and being physically active, is important for reducing type 2 diabetes risk and improving outcomes for people living with diabetes. Many aspects of the COVID-19 pandemic and Australia’s response to it, including household lockdowns, had the potential to affect these lifestyle factors.
Results from the Australian Bureau of Statistics (ABS) Household Impacts of COVID-19 Survey, suggest a varied effect on health behaviours during the early pandemic period. Overall, compared with before the pandemic, slightly more people reported an increase in the consumption of snack foods, personal screen time, consumption of alcohol and the smoking of tobacco products than those who reported a decrease in these health behaviours. Similar proportions of people reported increasing exercise and other physical activity as those who reported decreasing this activity (AIHW 2021b).
Diabetes incidence
There is growing evidence indicating a link between COVID-19, hyperglycaemia and new onset diabetes (Sathish et al 2021; Xie and Al-Aly 2022). A recent systematic review and meta-analysis found a 1.8-fold increased risk of developing diabetes in the post-acute phase of COVID-19 compared to the general population (Zhang et al. 2022).
In Australia, over the 12-month periods to December 2021 and December 2022, the National Diabetes Services Scheme (NDSS) recorded 121,070 and 116,864 new registrants, respectively. Registrations were higher in both periods than any previous 12 months recorded and were 18% and 14% higher than the equivalent period prior to the pandemic in December 2019. The largest increase in registration was found among women with gestational diabetes, with registrations up 18% between December 2019 and December 2022 (Diabetes Australia 2022).
However, these new registrations may be, at least in part, people who were previously diagnosed with diabetes and only registering with the NDSS during the pandemic. The increase in registrations also may be influenced by changes to the NDSS to simplify the usual processes to register (Andrikopoulos and Johnson 2020). Further monitoring is required to assess increases in diabetes diagnosis during the COVID-19 pandemic.
Hospitalisations
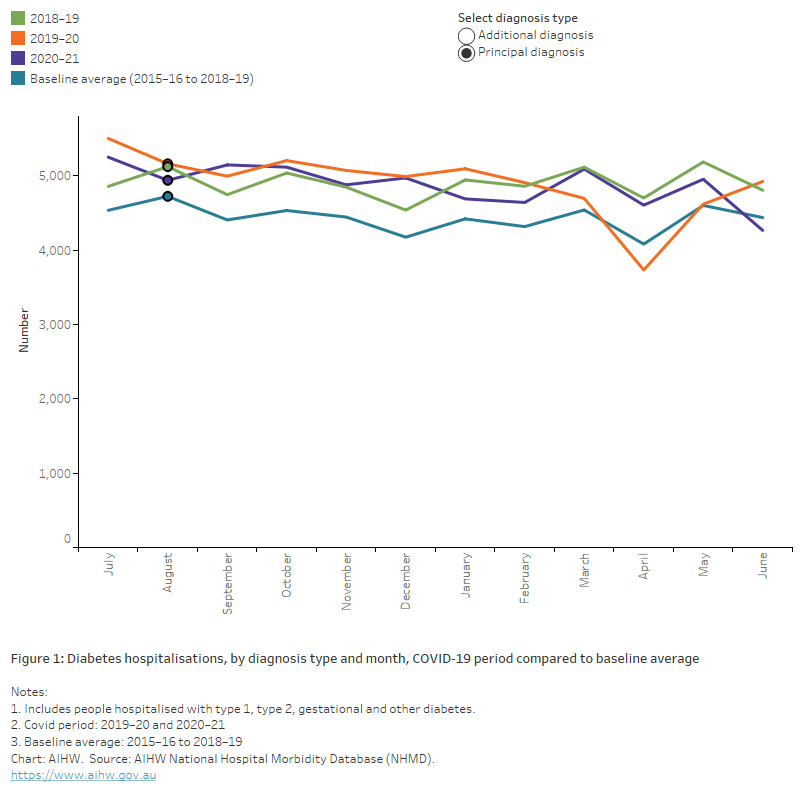
According to the National Hospital Morbidity Database (NHMD), the number of diabetes hospitalisations fell in April 2020 (both as a principal and/or additional diagnosis), which may be associated with aspects of the early COVID-19 period and Australia’s response to it, which had an impact on the provision of healthcare services and hospital activity generally (AIHW 2022b).
Compared with the pre-pandemic baseline (average monthly hospitalisations between 2015–16 and 2018–19), the number of hospitalisations in April 2020 with a principal diagnosis of diabetes was down 8.6% while the number with an additional diagnosis was down 27%. Similar results were found across type 1, type 2 and other diabetes. The corresponding period in 2020-2021 showed the number of diabetes hospitalisations had returned to the pre-pandemic level recorded in 2018–19 with increases of 12.8% and 9.2% in hospitalisations for diabetes as a principal and additional diagnosis, respectively, compared to the baseline average (Figure 1).
Figure 1: Diabetes hospitalisations by diagnosis type and month, COVID-19 period compared to baseline average
The chart shows the number of diabetes hospitalisations by diagnosis type and month between 2015–16 and 2019–20. Hospital separations fell in March–April 2020 for both principal and additional diagnosis of diabetes, with a more notable drop in hospitalisations with an additional diagnosis of diabetes.
COVID-19 hospitalisations
Comorbidity with diabetes is associated with more severe outcomes for people hospitalised with COVID-19. Of the more than 4,700 hospitalisations in Australia that involved a COVID-19 diagnosis in 2020–21:
- Around 42% had one or more diagnosed comorbid conditions, an increase from 25% in 2019–20.
- The most common comorbid conditions were type 2 diabetes (20%) and cardiovascular disease (which includes coronary heart disease and a range of other heart, stroke and vascular diseases) (20%) (AIHW 2022a).
- 12% of hospitalisations involved time spent in an intensive care unit, compared with 7.0% of all COVID-19 hospitalisations.
- 7.1% involved continuous ventilatory support, compared with 3.8% of all COVID-19 hospitalisations.
- 19% had a separation mode indicating the patient died in hospital, compared with 10.3% of all COVID-19 hospitalisations.
These results may be impacted by people with type 2 diabetes being more likely to be older and therefore more likely to have severe COVID-19.
Emergency department presentations
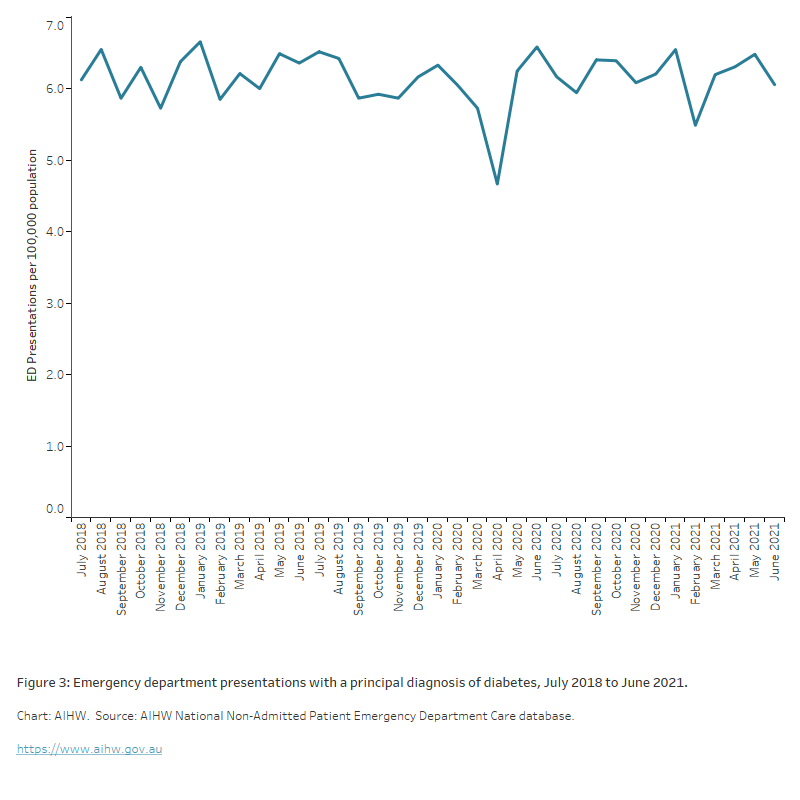
The average number of monthly diabetes-related ED presentations remained largely unchanged between 2018–19 and 2020–21 at around 1,500. The rate of monthly diabetes-related ED presentations:
- ranged between 4.7 and 6.6 presentations per 100,000 population between July 2019 and June 2020. This rate was lowest in April 2020 (4.7 per 100,000 population) and highest in June 2020 (6.6 per 100,000 population).
- was relatively stable throughout 2019–20, with the exception of April 2020 when there was a decline in presentations of almost one fifth (20%) when compared to the previous month (March 2020) (Figure 2).
Figure 2: Emergency department (ED) presentations with a principal diagnosis of diabetes, July 2019 to June 2021
The chart shows emergency department (ED) presentations per 100,000 population by month between July 2018 and June 2021. The rate of presentations per 100,000 population ranged from a low of 4.7 in April 2020 to a high of 6.6 in June 2020.
Other health service use
People living with diabetes require regular contact with GPs, endocrinologists and allied health services including dietitians and podiatrists to optimise glucose control and reduce risk of diabetes complications. To limit the spread of COVID-19, restrictions were put in place to contain its impact in the community. By the end of March 2020, non-essential businesses and activities had shut down, with people urged to stay at home. As part of these restrictions, many health services were suspended or required to operate in new or different ways. While this may have limited people’s access to and use of these services, in some cases, new or additional services were made available through changes to health service delivery models, policies and programs (AIHW 2021b).
The initial temporary changes to telehealth items in the Medicare Benefits Schedule (MBS) and bulk billing criteria have bridged these issues, but these services were less suitable for complex care which often require face-to-face consultations. The scope of telehealth services was refined over time to make them more suitable for complex care, however, the scope of telephone services has been reduced since July 2021 to focus on more straightforward services.
People avoiding and/or delaying medical care for diabetes during the COVID-19 pandemic has been an emerging global issue. Research has already shown a significant increase in the frequency of severe diabetic ketoacidosis (DKA) at presentation of type 1 diabetes during the initial period of COVID-19 restrictions in Australia. Comparing the initial period of COVID-19 restrictions (March to May 2020) with the equivalent period of the previous 5 years, the proportion of type 1 diabetes presentations with severe DKA increased from 5% to 45% in an Australian tertiary centre (Lawrence et al. 2021).
Primary health care
MedicineInsight is a longitudinal general practice dataset managed by NPS MedicineWise which was established in 2011. NPS MedicineWise undertook a study looking at the 6 months period from March to August 2020 (COVID period) compared with the same period in 2019 (pre-COVID period) to assess changes to general practice attendance.
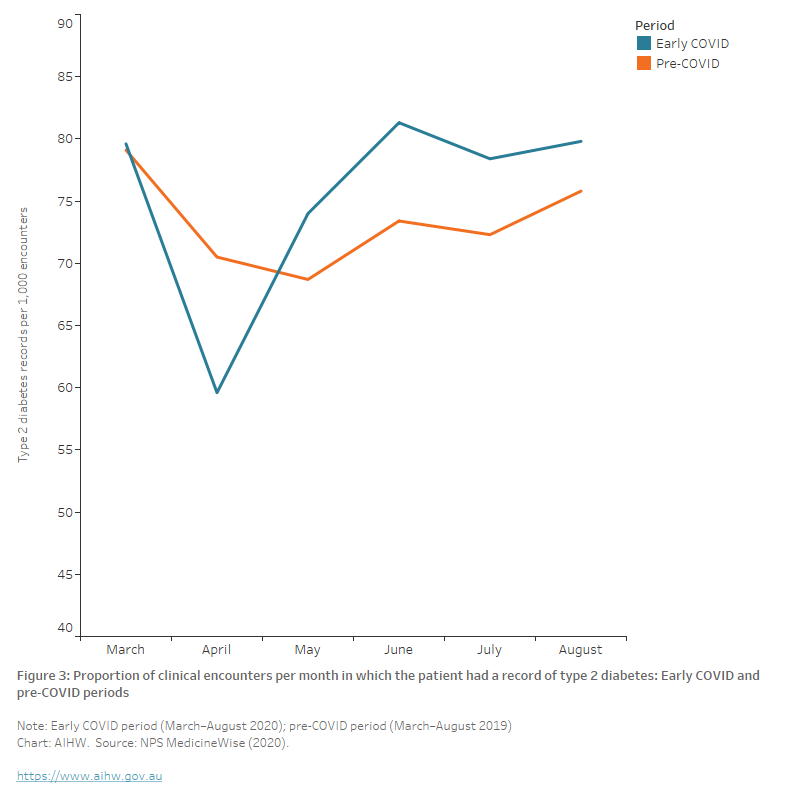
Over the 6-month early COVID-19 period, the mean number of clinical encounters among patients without a record of diabetes increased when compared with the pre-COVID-19 period. However, there was no significant change in the mean number of clinical encounters among patients with a record of type 2 diabetes when comparing the 6-month early pandemic period to the corresponding 6-month period in 2019. Although the monthly rate of encounters where the patient had a record of type 2 diabetes initially decreased by around 25% between March and April 2020 (from 80 to 60), the rate increased to over 80 per 1000 encounters in subsequent months – higher than the equivalent pre-COVID-19 period (Figure 1) (NPS MedicineWise 2020).
Figure 3: Proportion of clinical encounters per month in which the patient had a record of type 2 diabetes: Early COVID and pre-COVID periods
The chart shows the proportion of clinical encounters per month in which the patient had a record of type 2 diabetes during the early COVID and pre-COVID periods. The monthly rate of encounters where the patient had a record of type 2 diabetes fell from 79 to 60 per 1000 encounters in April 2020 before increasing to approximately 80 per 1000 encounters by June 2020, above the levels recorded in the equivalent pre-COVID period in 2019.
Telehealth service use
The Australian Government introduced new Medicare Benefits Schedule (MBS) telehealth items on 13 March 2020 enabling patients to consult with their health professional by telephone or video. The use of telehealth services rose rapidly at the start of the pandemic, with patterns of use later corresponding to new outbreaks.
Overall rates of telehealth use were higher in the major cities than in remote areas with no evidence of variation by socioeconomic status. Of a list of selected chronic conditions (‘ever recorded’ for each patient), diabetes (excluding gestational diabetes) had the third-highest rate of telehealth consultations behind chronic kidney disease and cardiovascular disease (Figure 4) (NPS MedicineWise 2022).
Figure 4: Rate of telehealth billed items per 1,000 patients by recorded chronic condition (total telehealth), by quarter 2020–2021
The chart shows the rates of telehealth use between January 2020 and December 2021. diabetes (excluding gestational diabetes) had the third-highest rate of telehealth consultations behind chronic kidney disease and cardiovascular disease
Allied health use
No data are available on the use of allied health services for people living with diabetes, but total attendance for the Australian population are available. According to the MBS:
- Overall allied health attendance increased during the early pandemic period, resulting in a 19% increase between 2019 and 2020.
- Optometry services decreased in April 2020 but had returned to the usual level of service provision by the end of August 2020 (though had not yet compensated for services not conducted in the earlier months). This led to an overall 8.1% fall in the number of services in 2020 compared with 2019 (AIHW 2021b).
Deaths
Australia recorded substantially lower-than-expected mortality during the first year of the COVID-19 pandemic in 2020 with decreases across key causes and most notably, deaths from respiratory disease. The mortality rate remained low during 2021 with the top 5 leading causes of death unchanged and coronary heart disease at the top of the list (ABS 2022).
However, well into the third year of the pandemic, to February 2023, ABS Provisional Mortality Statistics show that Australia had recorded a 15.3% increase in the total number of deaths (registered by 28 February 2023), compared to the baseline average (2017–2019 and 2021) (ABS 2023b).
Since the start of the pandemic, a total of 16,810 people have died with or from COVID-19 (registered by 31 March 2023). Of these, COVID-19 was the underlying cause of death for 80% (13,456 people) (ABS 2023a).
Diabetes deaths during COVID-19
There is international evidence that diabetes mortality has increased during the COVID-19 pandemic for other countries (Barron et al. 2020; Lv et al. 2022) and a growing number of studies showing that diabetes is an important risk factor in determining the clinical severity of COVID-19 due to weakened immune response and other factors (Erener 2020).
According to ABS Provisional Mortality Statistics, in 2022, doctor-certified deaths due to diabetes (registered by 28 February 2023) 19.2% above the baseline average (comprising the years 2017–2019 and 2021). The age-standardised diabetes death rate for 2022 was 10.5% higher than the baseline average (ABS 2023b).
Most COVID-19 deaths (96%) have other conditions listed on the death certificate (either pre-existing or conditions caused by COVID-19 and its complications). According to ABS COVID-19 Mortality in Australia, pre-existing chronic conditions were reported on death certificates for 10,850 (80.6%) of the 13,456 deaths due to COVID-19. Diabetes was a pre-existing condition in 15.7% of deaths that had a chronic condition listed on the death certificate (ABS 2023a).
Diabetes monitoring
Glycated haemoglobin, haemoglobin A1c or HbA1c, is the main biomarker used to assess long-term glucose control in people living with diabetes. Haemoglobin is a protein in red blood cells which can bind with sugar to form HbA1c. It is directly related to blood glucose levels and strongly related with the development of long-term diabetes complications.
Rate of HbA1c testing
According to NPS MedicineWise analysis of MedicineInsight, the rate of HbA1c tests among all regularly attending patients over the 6-months from 1 March 2020 to 31 August 2020 was not significantly different from the pre-COVID period (Table 1). However, the rate of HbA1c testing did fall significantly among regularly attending patients with a record of type 2 diabetes despite the rate of type 2 diabetes encounters remaining similar in both time periods. In the pre-COVID period, the average monthly rate of HbA1c testing among patients with a record of type 2 diabetes was 126.1 per 1000 clinical encounters, which fell to 109.0 tests per 1,000 clinical encounters in the COVID period (NPS MedicineWise 2020).
In April 2020, there was a significant decline in the rate of HbA1c tests performed. The rate of tests for all patients fell from 32 tests per 1,000 clinical encounters in April 2019 to 21 tests per 1,000 clinical encounters. The rate of testing for patients with a record of type 2 diabetes fell from 120 tests per 1,000 clinical encounters in April 2019 to 77 tests per 1,000 clinical encounters in April 2020 (NPS MedicineWise 2020).
1 March–31 Aug 2019 | 1 March–31 Aug 2020 | p-value | |
|---|---|---|---|
| Rate of HbA1c testing (all patients) | 32.3 (29.8, 34.8) | 30.4 (5.0, 35.8) | 0.43 |
| Median all patients | 31.5 (Q1 30.6, Q3 33.1) | 32.1 (Q1 29.6, Q3 33.1) | - |
| Rate of HbA1c testing (type 2 diabetes patients) | 126.1 (118.6, 133.7) | 109.0 (92.1, 125.9) | 0.04 |
| Median (type 2 diabetes patients) | 123.7 (Q1 120.8, Q3 129.9) | 113.4 (Q1 111.3, Q3 115.4) | - |
| Rate of type 2 diabetes encounters | 73.3 (69.4, 77.2) | 75.4 (66.9, 84.0) | 0.57 |
| Median | 72.9 (Q1 70.5, Q3 75.8) | 79.0 (Q1 74.0, Q3 79.8) | - |
*Reported as the mean (per 1000 encounters) (95% CI); or median (quartiles)
Source: NPS MedicineWise (2020).
HbA1c testing frequency
Imai et al. (2020) studied the impact of COVID-19 on HbA1c monitoring using data from over 800 general practices (456 from Victoria and 347 from New South Wales) from January 2018 to December 2020. The volume of HbA1c monitoring in 2020 during the weeks of the first wave of COVID-19 (approximately March–May) decreased by 19.1% in New South Wales and 25.6% in Victoria, compared to the average volume of 2018–2019. Although it was not as large as the first wave, there was another fall in the total HbA1c testing volume in 2020 during the weeks of the second wave (approximately June–September).
The study also examined the number of patients living with type 2 diabetes who had records of HbA1c testing in both 2018 and 2019 (n=22,804 in Victoria, n = 15,399 in New South Wales) and their HbA1c testing frequencies. Approximately 14%–15% of these patients did not have HbA1c testing in 2020 (15.3% in Victoria, 14.1% in New South Wales). The number of patients who had multiple HbA1c tests also decreased in 2020 in both states (Figure 4).
Figure 5: Number of subgroup patients by HbA1c testing frequency. The subgroup patients were those who had records of HbA1c tests in both 2018 and 2019
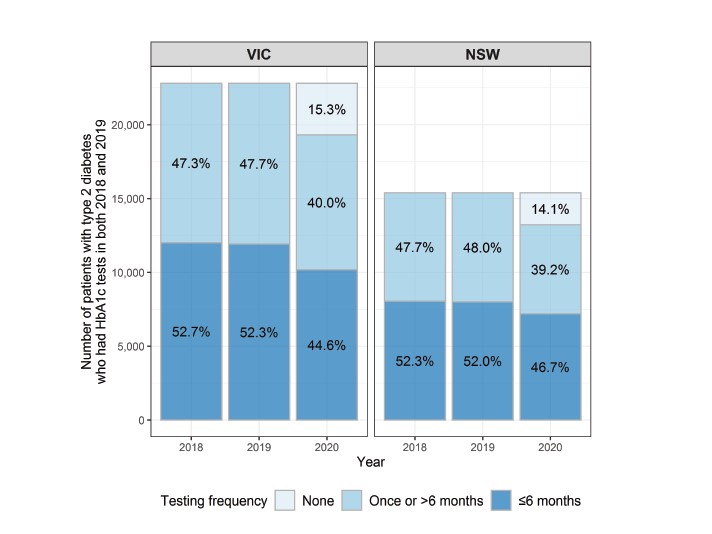
Source: Imai et al. 2020.
Gestational diabetes screening
In 2020, the Australasian Diabetes in Pregnancy Society, the Australian Diabetes Society, the Australian Diabetes Educators Association and Diabetes Australia, jointly provided temporarily revised guidelines for gestational diabetes screening in response to the COVID-19 pandemic. The guidelines aim to reduce both the number of women attending and the amount of time spent at pathology collection centres during times of elevated contagion risk.
The revised guidelines replace the oral glucose tolerance test (OGTT) with HbA1c testing in the first trimester and Fasting Blood Glucose (FBG) between 24 and 28 weeks for those not diagnosed with gestational diabetes from the initial HbA1c result. For those with a resulting FBG of 4.7–5.0 mmol/L, an OGTT is recommended while an FBG ≥5.1mmol/L is diagnostic of gestational diabetes (Diabetes Australia 2020).
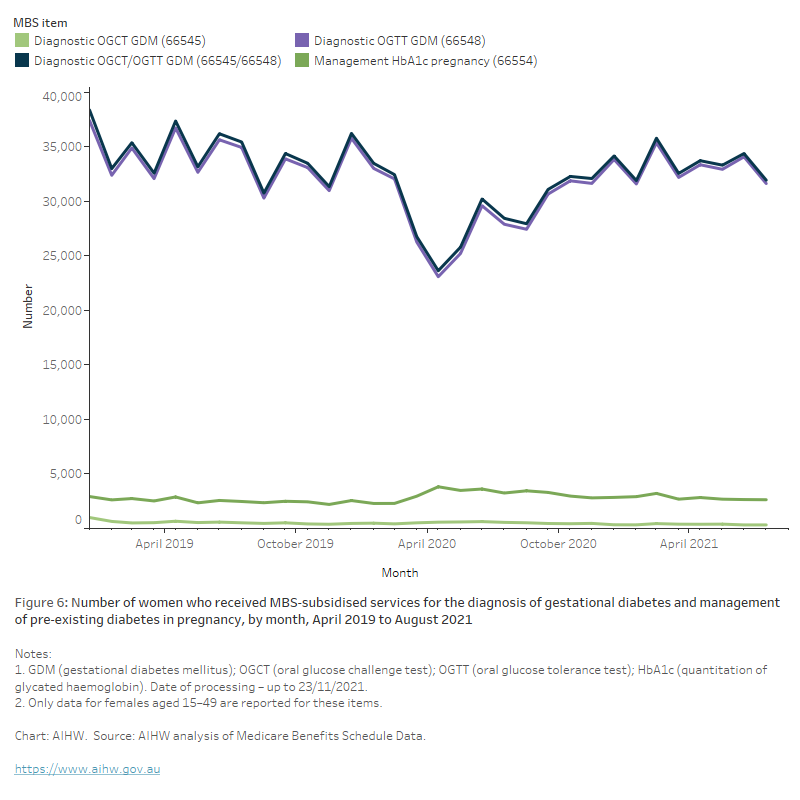
These guidelines (and other COVID-related factors) likely influenced a sharp decline in the number of women receiving an OGTT or oral glucose challenge test (OGCT) for the screening of gestational diabetes throughout April to June 2020 with an overall 11% drop in the annual numbers between 2019 and 2020 (from 184,000 to 163,000, respectively) (Figure 5). This drop coincided with a 25% increase in HbA1c testing for the management of pre-existing diabetes where the patient is pregnant and a 2% increase in claims for HbA1c testing for the diagnosis of diabetes – both MBS items likely used as a substitute for the use of the OGTT for the detection of gestational diabetes during COVID.
While recent retrospective studies have suggested the temporarily revised guidelines could lead to an under detection of gestational diabetes of between 25%–29% (van Gemert et al. 2020; Zhu et al. 2021), the latest 2020–21 incidence numbers (from the NHMD) indicate a continued rise in gestational diabetes incidence in Australia (see Gestational diabetes). While MBS data processed to 1 August 2021 indicates the number of women receiving the OGTT and OGCT had returned to pre-COVID levels, further monitoring will determine the impact of successive waves of the COVID-19 pandemic on gestational diabetes screening and subsequent incidence numbers.
Figure 6: Number of women who received MBS-subsidised services for the diagnosis of gestational diabetes and management of pre-existing diabetes in pregnancy, by month, April 2019 to August 2021
The chart shows the number women who received MBS-subsidised services for the diagnosis of gestational diabetes and management of pre-existing diabetes in pregnancy, by month, April 2019 to August 2021. There was a sharp decline in the number of women receiving the oral glucose tolerance test for the screening of gestational diabetes throughout April to June 2020 with an overall 11% drop in the annual numbers between 2019 and 2020 (from 184,000 to 163,000, respectively). By January 2021, the numbers had returned to pre-COVID levels.
Diabetes medicine use
The COVID-19 pandemic has affected both patients and health practitioners in terms of the number of medical services, type of services and the way in which services are delivered (Sutherland et al. 2020). Medication access and supply has also been affected.
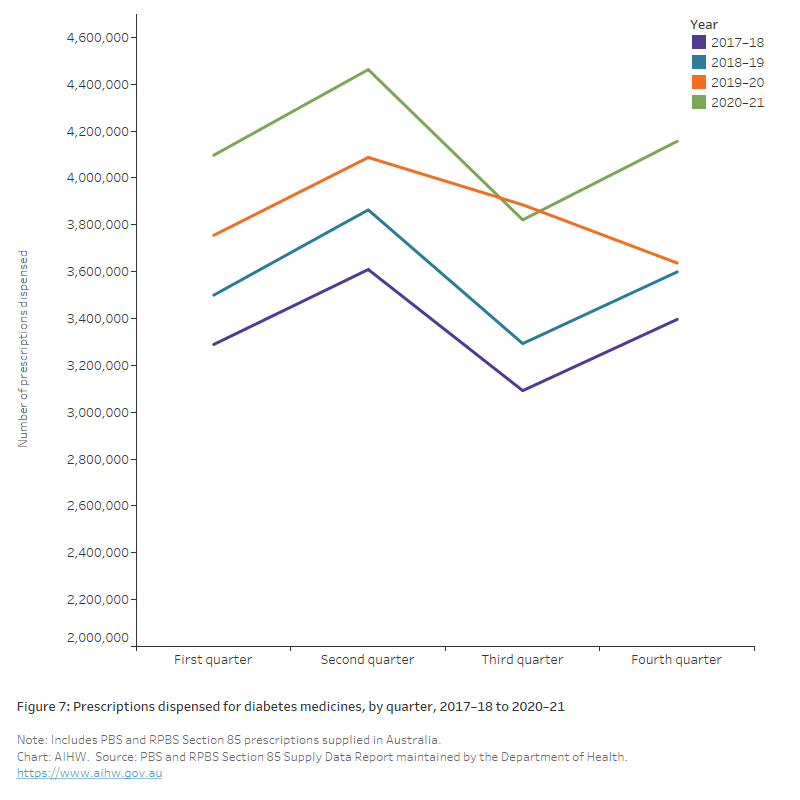
Analysis of the total volume of Pharmaceutical Benefits Scheme (PBS) prescriptions dispensed for ATC group A10, Drugs used in diabetes dispensed during 2019–20 and 2020–21 shows little change from 2018–19 when accounting for the expected increase in prescriptions dispensed over time. During 2019–20 and 2020–21, 15.4 and 16.5 million scripts for group A10 were dispensed, compared with 14.3 million for 2018–19 (Figure 6), a 7.8% increase from 2018–19 to 2019–20, and a 7.6% increase from 2019–20 to 2020–21.
Figure 7: Prescriptions dispensed for diabetes medicines, by quarter, 2017–18 to 2020–21
The chart shows the number of prescriptions dispensed for diabetes medicines by quarter between 2017–18 and 2020–21. During 2019–20 and 2020–21, 16.5 and 15.4 million scripts for group A10 were dispensed, compared with 14.3 million for 2018–19, a 7.8% increase from 2018–19 to 2019–20, and a 7.6% increase from 2019–20 to 2020–21.
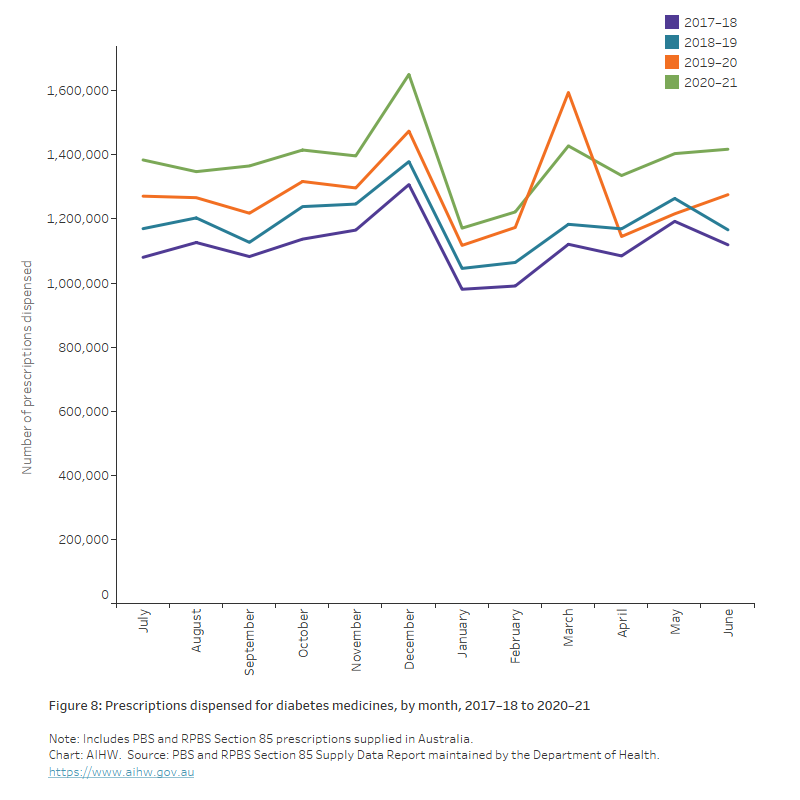
There were, however, changes in consumer behaviour. An unusually high volume of diabetes scripts was dispensed in March 2020 (1.6 million), coinciding with the introduction of national restrictions, followed by a decrease in April 2020 (1.2 million) (Figure 7).
In March 2020, the Australian Government implemented temporary changes to medicines regulation to support Australians’ continued access to PBS medicines during the COVID-19 pandemic. Some of these changes were in response to the dramatic increase in demand for medicines during early March, which resulted in pharmacies and wholesalers reporting medicine shortages.
The measures included a restriction on the quantity of medicines purchased to discourage unnecessary medicine stockpiling, continued dispensing emergency measures to allow one month supply of a patient’s usual medicines without a prescription, a home delivery service for eligible patients, digital image-based prescriptions to support telehealth medical services, and arrangements for medicine substitution by pharmacists without prior approval from the prescribing doctor (AIHW 2020).
Figure 8: Prescriptions dispensed for diabetes medicines, by month, 2017–18 to 2020–21
The chart shows the number of prescriptions dispensed for diabetes medicines by month between 2017–18 and 2020–2021. An unusually high volume of diabetes scripts was dispensed in March 2020 (1.6 million), coinciding with the introduction of national restrictions, followed by a decrease in April 2020 (1.2 million).
ABS (Australian Bureau of Statistics) (2022) Causes of death, Australia, ABS, Australian Government, accessed 25 October 2022.
ABS (2023a) COVID-19 Mortality in Australia: Deaths registered until 31 March 2023, ABS, Australian Government, accessed 25 October 2022.
ABS (2023b) Provisional Mortality Statistics, ABS Website, accessed 3 January 2023.
Australian Institute of Health and Welfare (AIHW) (2020) Impacts of COVID-19 on Medicare Benefits Scheme and Pharmaceutical Benefits Scheme service use, AIHW, Australian Government, accessed 01 June 2022.
AIHW (2021a) Impacts of COVID-19 on Medicare Benefits Scheme and Pharmaceutical Benefits Scheme: quarterly data, AIHW Australian Government, accessed 15 November 2021.
AIHW (2021b) The first year of COVID-19 in Australia: direct and indirect health effects, AIHW, Australian Government, accessed 1 December, 2021.
AIHW (2022a) Admitted patients, AIHW, Australian Government, accessed 3 June 2022.
AIHW (2022b) Australia's hospitals at a glance, AIHW, Australian Government, accessed 14 December 2022.
Andrikopoulos S and Johnson G (2020), 'The Australian response to the COVID-19 pandemic and diabetes – Lessons learned’, Diabetes research and clinical practice, 165:108246, doi:10.1016/j.diabres.2020.108246
Barron E, Bakhai C, Kar P, Weaver A, Bradley D, Ismail H, Knighton P, Holman N, Khunit K, Sattar N, Wareham N, Young B and Valabhji J (2020), ‘Associations of type 1 and type 2 diabetes with COVID-19-related mortality in England: a whole population study, Lancet Diabetes Endocrinology, 8(10): 813–822. doi: 10.1016/S2213-8587(20)30272-2.
Diabetes Australia (2020) Diagnostic Testing for Gestational diabetes mellitus (GDM) during the COVID 19 pandemic: Antenatal and postnatal testing advice, Diabetes Australia, accessed 1 December 2021.
Diabetes Australia (2022) Diabetes data snapshots (December 2021 and December 2022), National Diabetes Services Scheme website, accessed 3 May 2023.
Erener S (2020) ‘Diabetes, infection risk and COVID-19’, Molecular Metabolism, 39, https://doi.org/10.1016/j.molmet.2020.101044
Imai C, Hardie RA, Thomas J, Wabe N and Georgiou A (2020) The impact of the COVID-19 pandemic on general practice-based HbA1c monitoring in type 2 diabetes, Macquarie University website, accessed 15 November, 2021.
Lawrence C, Seckold R, Smart C, King BR, Howley P, Feltrin R, Smith TA, Roy R and Lopez P (2021), 'Increased paediatric presentations of severe diabetic ketoacidosis in an Australian tertiary Centre during the COVID‐19 pandemic', Diabetic Medicine, 38(1):e14417, doi:10.1111/dme.14417.
Lv F, Gao X, Huang A, Zu J, He X, Sun X et al. (2022) ‘Excess diabetes mellitus-related deaths during the COVID-19 pandemic in the United States’, The Lancet Discovery Science, 54 (101671), https://doi.org/10.1016/j.eclinm.2022.101671.
NPS MedicineWise (2020) MedicineInsight report: HbA1c testing in MedicineInsight patients newly diagnosed, or with a history of diabetes in 2018–2019, Sydney, NPS MedicineWise.
Peric S and Stulnig TM (2020), 'Diabetes and COVID-19', Wiener Klinische Wochenschrift, 132(13):356–61, doi:10.1007/s00508-020-01672-3.
Sathish T, Kapoor N, Cao Y, Tapp RJ and Zimmet P (2021), 'Proportion of newly diagnosed diabetes in COVID-19 patients: A systematic review and meta-analysis', Diabetes, Obesity and Metabolism. 1;23(3):870-4, doi:10.1111/dom.14269.
Sutherland et al. (2020), 'Impact of COVID-19 on healthcare activity in NSW, Australia', Public health Research and Practice, 30(4), doi:10.17061/phrp3042030.
Van Gemert TE, Moses RG, Paper AV and Morris GJ (2020), 'Gestational diabetes mellitus testing in the COVID-19 pandemic: The problems with simplifying the diagnostic process', The Australian & New Zealand Journal of Obstetrics & Gynaecology, 60(5):671-674, doi:10.1111/ajo.13203.
Xie Yan and Al-Aly Ziyad (2022), ‘Risks and burdens of incident diabetes in long COVID: a cohort study’, The Lancet Diabetes and Endocrinology, 10(5):311–321, doi:10.1016/S2213-8587(22)00044-4.
Zhang T, Mei Q, Zhang Z, Walline J, Liu Y, Zhu H and Zhang S (2022), ‘Risk for newly diagnosed diabetes after COVID-19: a systematic review and meta-analysis’, BMC Medicine, 20(444), doi:10.1186/s12916-022-02656-y.
Zhu S, Meehan T, Veerasingham M and Sivanesan K (2021), 'COVID-19 pandemic gestational diabetes screening guidelines: A retrospective study in Australian women', Diabetes and Metabolic Syndrome, 15(1):391-395, doi:10.1016/j.dsx.2021.01.021.


