Type 1 diabetes
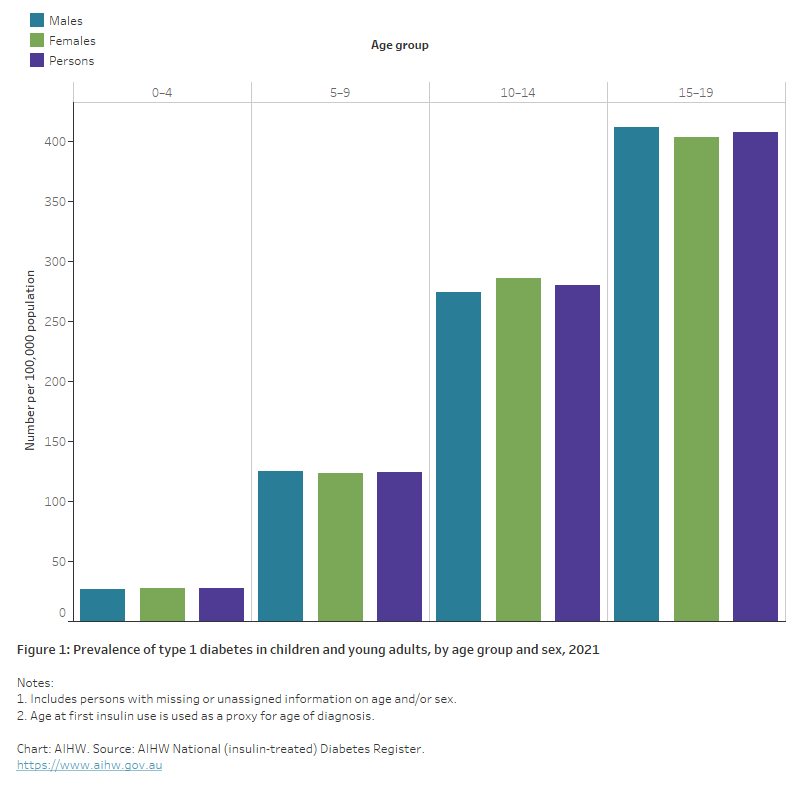
The bar chart shows the prevalence of type 1 diabetes in children and young adults by sex in 2021. Rates were highest among males and females aged 15–19 (412 and 404 per 100,000 population, respectively).
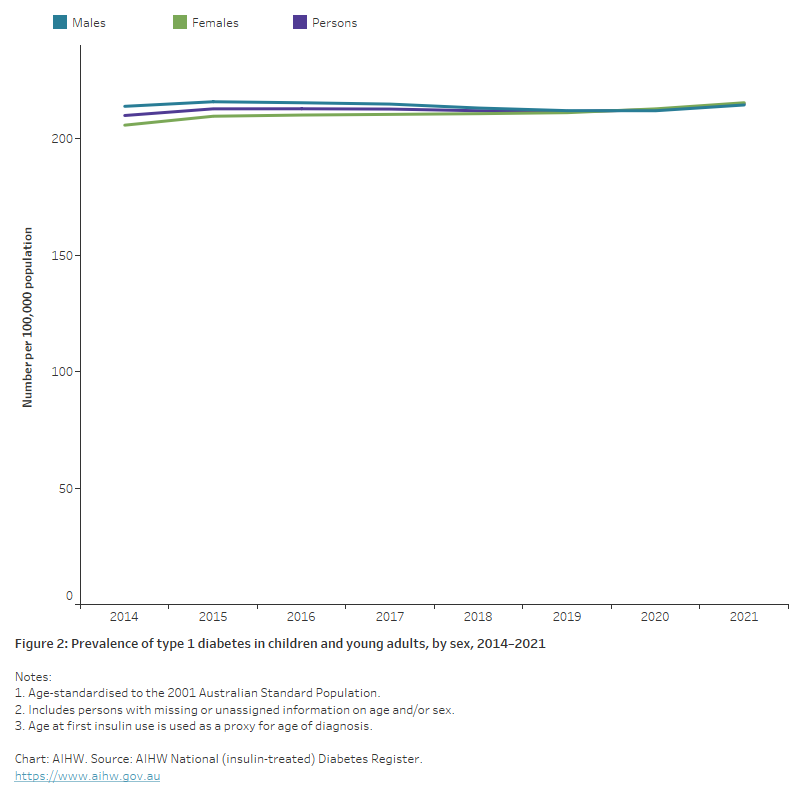
The chart shows the age-standardised rates of young males and females living with type 1 diabetes, which have remained largely unchanged between 2014 to 2021.
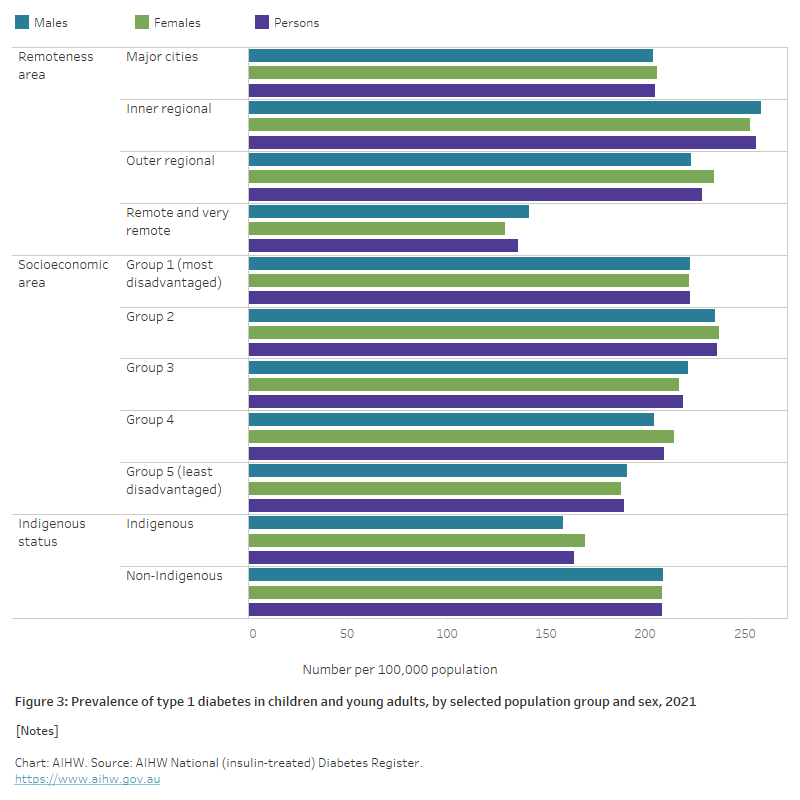
The horizontal bar chart shows that male and female type 1 diabetes prevalence rates in 2021, were lower among younger Indigenous Australians, younger people living in Remote and very remote areas, and younger people living in the least disadvantaged socioeconomic areas.
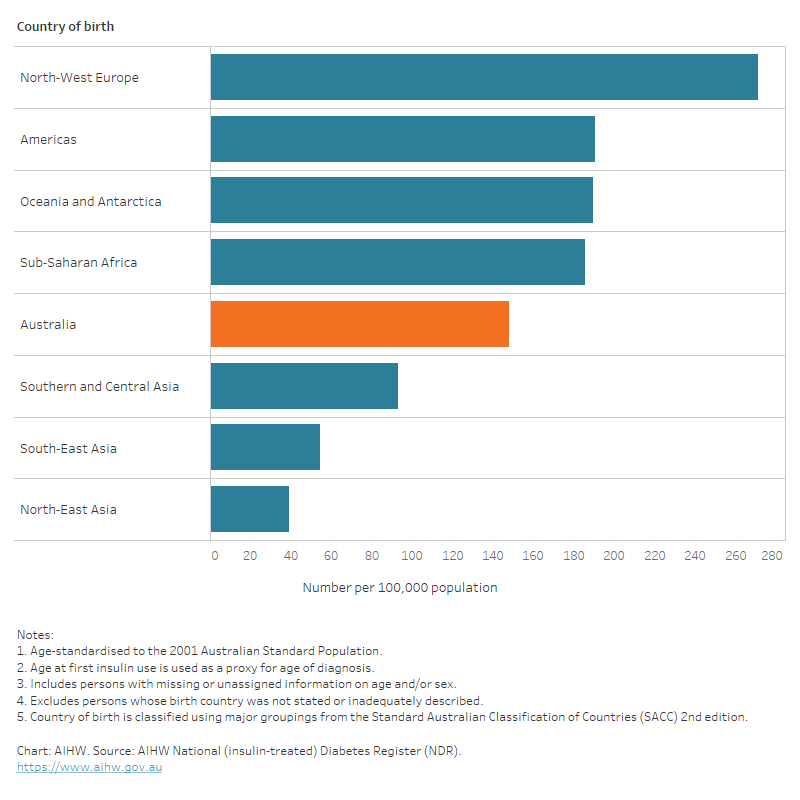
The horizontal bar chart shows type 1 diabetes prevalence rates were highest among children and young adults born in North-West Europe with prevalence rates 1.8 times as high as those among children and young people born in Australia (271 and 148 per 100,000 population).
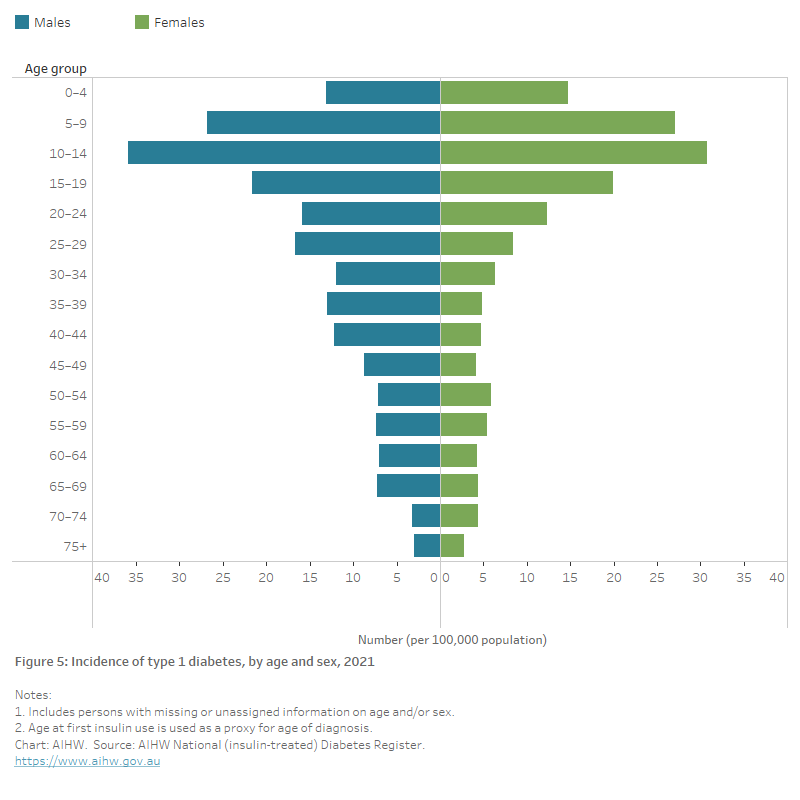
The butterfly chart shows the incidence rates of type 1 diabetes by age group in 2021. Rates were highest among males and females aged 10–14 years (36 and 31 per 100,000 population).
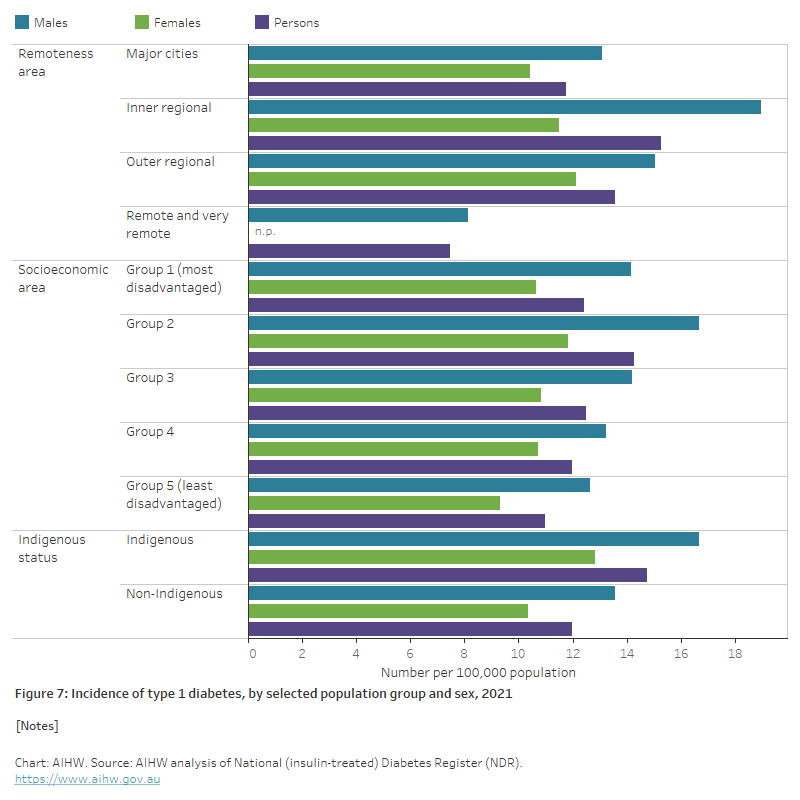
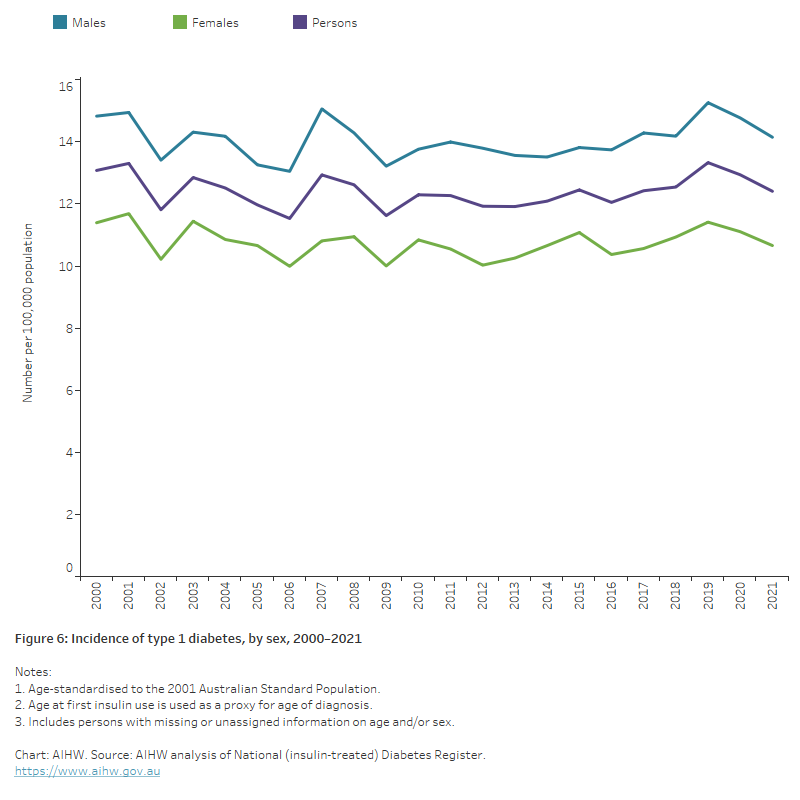
The chart shows the age-standardised incidence rates for males and females newly diagnosed with type 1 diabetes between 2000 to 2021. Over the last two decades, incidence rates have remained relatively stable, fluctuating between 13 and 15 new cases per 100,000 population for males and 10 to 12 new cases for females.
The chart shows that male and female type 1 diabetes prevalence rates in 2021, were higher among Indigenous Australians, people living in Inner and Outer regional areas, and people living in the lowest socioeconomic areas.