Burden of diabetes
Page highlights:
- In 2023, type 1 diabetes was responsible for around 19,000 years of healthy life lost in Australia – equating to 0.7 DALY per 1,000 population.
- The proportion attributed to premature death (fatal burden) was less than that attributed to living in poor health (the non-fatal burden) with 45% and 55%, respectively.
- In 2023, type 2 diabetes was responsible for 124,000 years of healthy life lost in Australia and accounted for 2.2% of the total burden of disease – the 11th highest specific cause of disease burden at 4.7 per 1,000 population.
- 62% of the burden attributed to type 2 diabetes was non-fatal.
Risk factors for diabetes burden
- In 2018, the 3 leading risk factors contributing to type 2 diabetes total burden were overweight and obesity, diet and physical inactivity.
What is burden of disease?
Burden of disease is a measure of the years of healthy life lost from living with or dying from disease and injury.
The measure used is the ‘disability-adjusted life year’ (DALY). This combines health loss from living with illness and injury (non-fatal burden, or YLD) and dying prematurely (fatal burden, or YLL) to estimate total health loss (total burden, or DALY).
Burden of disease estimates seek to capture both the quantity and health-related quality of life, and to reflect the magnitude, severity and impact of disease and injury within a population. Burden of disease does not quantify the social or financial consequences of disease and injury. Further information can be found in Australian Burden of Disease Study 2023 (ABDS).
Note: The ABDS 2023 does not include estimates by Remoteness areas, Socioeconomic groups or risk factors. The most recent estimates for these disaggregations are presented in the Australian Burden of Disease Study: Impact and causes of illness and death in Australia 2018 and Australian Burden of Disease Study 2018: Interactive data on risk factor burden reports.
Type 1 diabetes burden
In 2023, type 1 diabetes was responsible for around 19,000 years of healthy life lost in Australia – equating to 0.7 DALY per 1,000 population.
The proportion attributed to premature death (fatal burden) was less than that attributed to living in poor health (the non-fatal burden) with 45% (8,500 YLL) and 55% (10,500 YLD), respectively.
Variation by age and sex
In 2023:
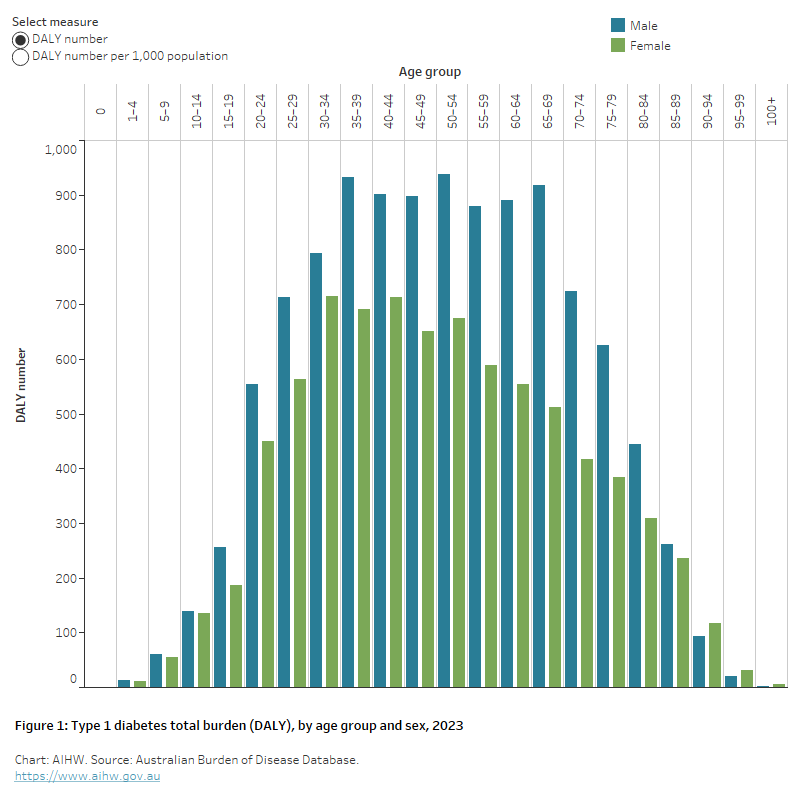
- the burden attributed to type 1 diabetes was highest among males and those aged 35–69 (Figure 1)
- after adjusting for age, DALY rates were 1.4 times as high among males as females.
Figure 1: Type 1 diabetes total burden (DALY), by age group and sex, 2023
The chart shows the burden of type 1 diabetes in 2023 was higher among males than females, peaking among those aged 35–69.
Trends over time
After adjusting for differences in the age structure of the populations, between 2003 and 2023, both the non-fatal (YLD) and fatal (YLL) burden attributed to type 1 diabetes remained stable (0.3 to 0.4 per 1,000 population and 0.4 to 0.3 per 1,000 population, respectively).
Variation between population groups
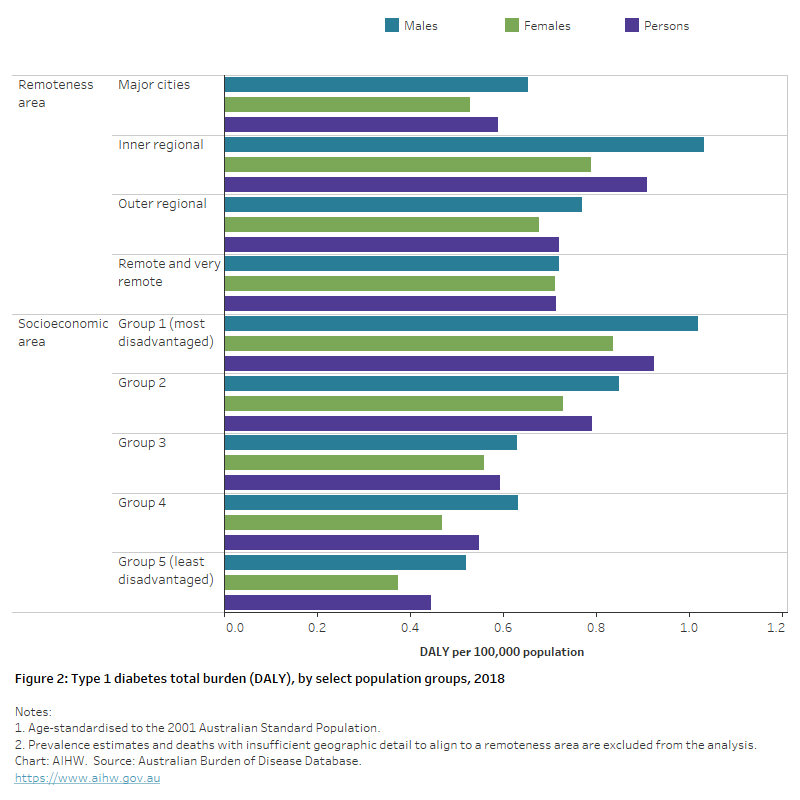
The overall burden of type 1 diabetes was higher among people living in lower socioeconomic areas and in Inner regional areas compared with other socioeconomic areas and remoteness areas. In 2018, after adjusting for different population age structures:
- rates were 1.5 times as high among those living in Inner regional areas compared with those living in Major cities.
- rates were over 2 times as high amongst those living in the lowest socioeconomic area (highest disadvantage) compared with those living in the highest socioeconomic area (Figure 2).
Figure 2: Type 1 diabetes total burden (DALY), by select population groups, 2018
The horizontal bar chart shows that the burden of type 1 diabetes for males and females were highest among people living in inner regional areas, and people living in the lowest socioeconomic areas.
First Nations people
In 2018, type 1 diabetes was responsible for 596 DALY among First Nations people – equating to 0.7 DALY per 1,000 population.
The proportion attributed to fatal burden was higher (58%, or 343 YLL) than that attributed to non-fatal burden (42% or 253 YLD).
Between 2003 and 2018, there was a 57% decrease in the age-standardised DALY per 1,000 population, attributed to type 1 diabetes among First Nations people (AIHW 2022).
Type 2 diabetes burden
In 2023, type 2 diabetes was responsible for an estimated 124,000 years of healthy life lost, accounting for 2.2% of the total burden of disease. Type 2 diabetes was the 11th leading specific cause of burden with 4.7 DALY per 1,000 population (AIHW 2023).
Sixty-two per cent (77,600 YLD) of burden attributed to type 2 diabetes was non-fatal. The remaining 38% (46,900 YLL) of burden was due to premature death.
Variation by age and sex
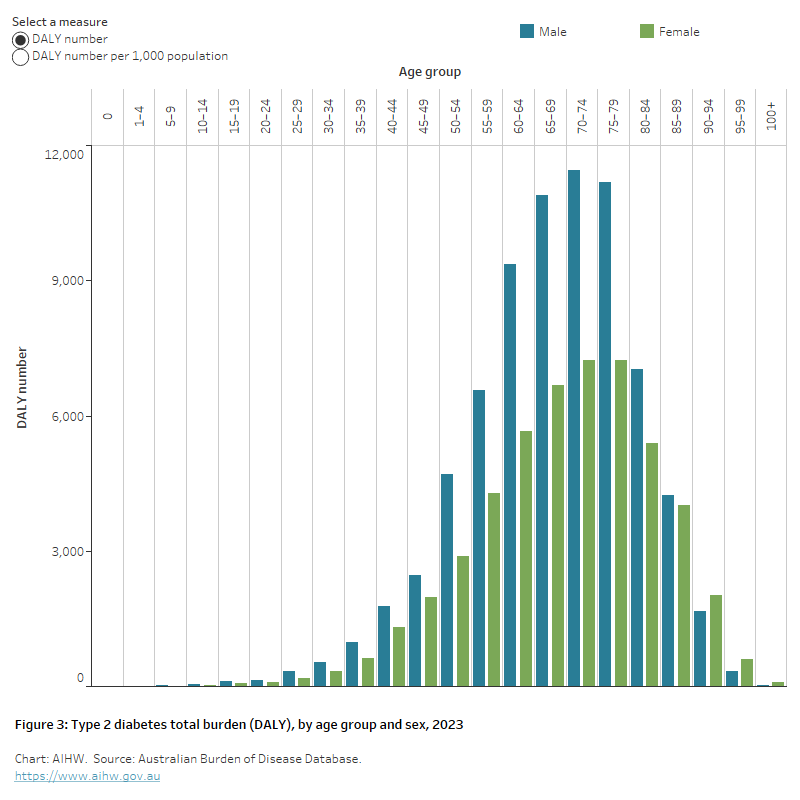
The overall burden attributed to type 2 diabetes was higher in males and older Australians. In 2023:
- The overall burden attributed to type 2 diabetes was 1.6 times as high among males as females.
- 54% of burden (67,000 DALY) attributed to type 2 diabetes occurred in persons aged 65–84
- in the 65–69 age group, the burden in males was over 1.6 times that in females (10,900 and 6,700 DALY respectively).
- in females aged 90–94, type 2 diabetes burden was 1.2 times as high as their male counterparts (2,000 and 1,700 DALY, respectively) (Figure 3).
Figure 3: Type 2 diabetes total burden (DALY), by age group and sex, 2023
The chart shows the burden of type 2 diabetes in 2023 was higher among males and older Australians aged 60–79.
Trends over time
After accounting for differences in the age structure of a population, the overall rate of burden attributed to type 2 diabetes remained stable between 2003 and 2023 (3.9 and 3.7 DALY per 1,000 population, respectively). Over the same period, there was a 22% increase in non-fatal burden (from 1.9 to 2.9 YLD per 1,000 population) and a 31% decrease in the rate of fatal burden (2.0 to 1.4 YLL per 1,000 population, respectively). In terms of the total DALY number attributed to type 2 diabetes, there was a 61% increase between 2003 and 2023 (+47,000 DALY) (AIHW 2023).
The change in the total DALY number attributed to type 2 diabetes between 2003 and 2018 (+45%) was driven by population growth (+29%) and population ageing (+17%) and less impacted by the prevalence of type 2 diabetes in the population (-1.0%) (AIHW 2021).
Variation between population groups
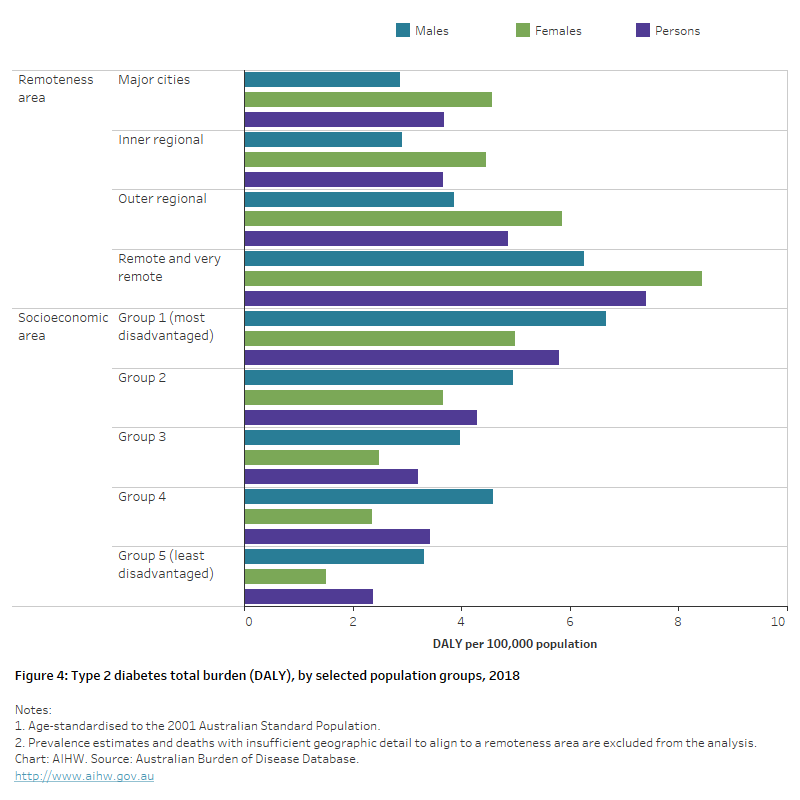
The overall burden of type 2 diabetes varied by socioeconomic areas and remoteness areas. In 2018, after adjusting for different population age structures:
- rates in Remote and very remote areas were 2 times as high as Major cities.
- rates were 2.4 times as high in those living in the lowest socioeconomic group compared with those living in the highest socioeconomic area (Figure 4).
First Nations people
In 2018, type 2 diabetes was responsible for around 7,000 DALY among First Nations people – equating to 8.4 per 1,000 population.
The proportion attributed to fatal burden (46% or 3,000 YLL) was slightly lower than that attributed to non-fatal burden (57% or 4,000 YLD).
Between 2003 and 2018, there was a 42% decrease in the age-standardised DALY per 1,000 attributed to type 2 diabetes among First Nations people (AIHW 2022).
Figure 4: Type 2 diabetes total burden (DALY), by selected population groups, 2018
The horizontal bar chart shows that the burden of type 1 diabetes for males and females were highest among people living in remote and very remote areas, and people living in the lowest socioeconomic areas.
Risk factors for type 2 diabetes burden
Behavioural, environmental and biomedical risk factors commonly impact an individual’s health and increase the risk of disability, injury or death. In 2018:
- Over one-third of type 2 diabetes total burden was attributable to overweight and obesity (37% in males and 35% in females).
- Around 19% of type 2 diabetes total burden was attributable to dietary risk factors for both males and females.
- Physical inactivity attributed a larger proportion of total burden for type 2 diabetes in females than males (14.8% and 12.8%, respectively).
- Tobacco use attributed a larger proportion of total burden for type 2 diabetes in males than females (3.7% and 1.0%, respectively) (AIHW 2021).
References
Australian Institute of Health and Welfare (AIHW) (2021) Australian Burden of Disease Study 2018: Interactive data on risk factor burden, AIHW, Australian Government, accessed 08 June 2022.
AIHW (2022) Australian Burden of Disease Study 2018: Interactive data on disease burden among Aboriginal and Torres Strait Islander people, AIHW, Australian Government, accessed 15 May 2022.
AIHW (2023) Australian Burden of Disease Study 2023, AIHW, Australian Government, accessed 14 December 2023.