Page highlights:
How much is spent on diabetes?
- In 2020–21, an estimated $3.4 billion of expenditure in the Australian health system was attributed to diabetes, representing 2.3% of total disease expenditure.
Where is the money spent?
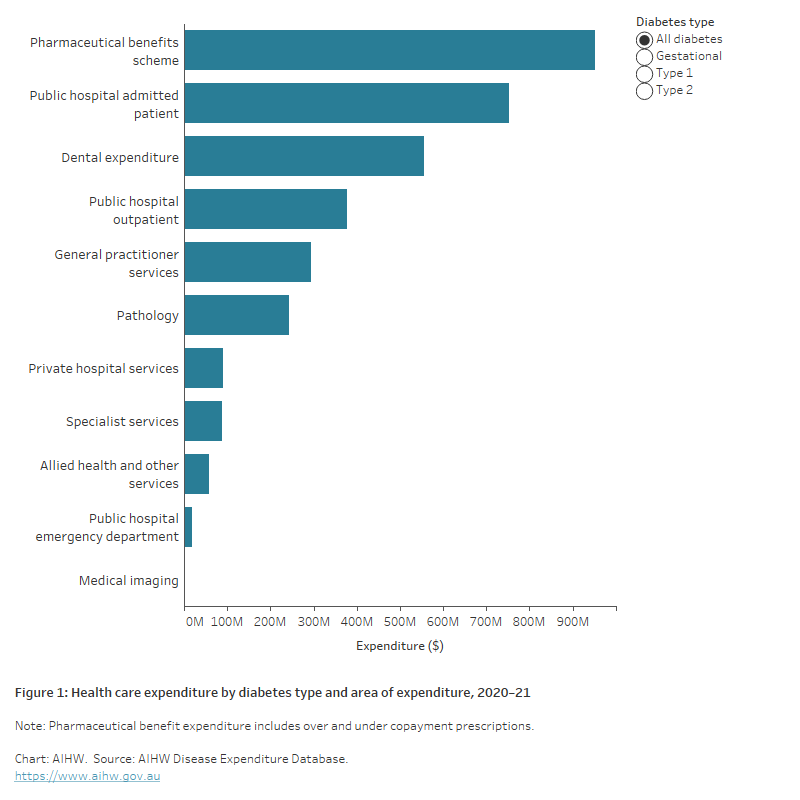
- Medications dispensed through the Pharmaceutical Benefits Scheme accounted for 28% of total diabetes expenditure and was the single highest area of health system spending with $952.7 million.
- The combined spending on hospital services accounted for 36% ($1.2 billion).
What is health system expenditure on diabetes?
This section provides recent data on health system expenditure on diabetes, with details by diabetes type, health-care service, age group, and sex. It includes expenditure by the Australian Government, state, territory and local governments and the non-government sector (including private health insurance and individual contributions). These estimates report direct, allocated and recurrent expenditure only. They do not account for the total amount spent on diabetes health.
Further information on how the estimates were derived is available from Health system spending on disease and injury in Australia 2020–21.
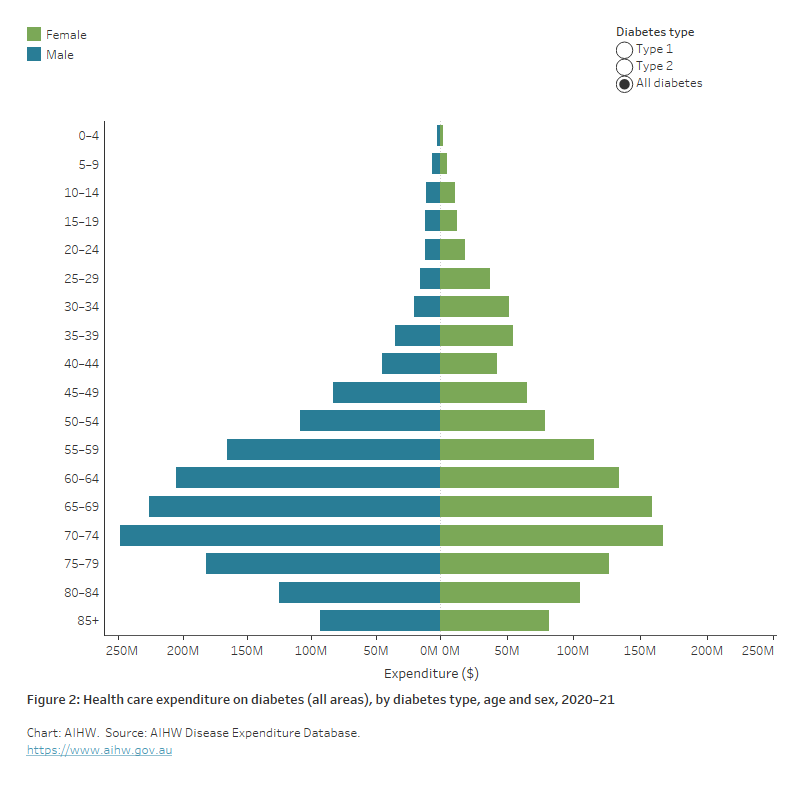
Of the $3.4 billion health system expenditure attributed to diabetes in 2020–21, an estimated:
- $373 million was attributed to type 1 diabetes
- $2.3 billion was attributed to type 2 diabetes
- $71.6 million was attributed to gestational diabetes
- $668.2 million was attributed to ‘other/unspecified’ diabetes (AIHW 2023).
Note: Due to the high number of ‘other/unspecified’ diabetes, caution should be used when interpreting data by diabetes type.
Where is the money spent?
In 2020–21, medications dispensed through the Pharmaceutical Benefits Scheme (PBS) was the single highest area of health system spending for diabetes accounting for 28% of total diabetes expenditure ($952.7 million). The combined spending on hospital services accounted for 36% (1.2 billion). This included expenditure on public hospital admitted patients ($752.2 million), public hospital outpatients ($376.7 million), private hospital services ($89.6 million), and public hospital emergency departments ($18.9 million) (Figure 1).