Expenditure on cardiovascular disease
Page highlights:
How much is spent on cardiovascular disease?
- In 2020–21, an estimated 9.5% of total allocated expenditure in the Australian health system ($14.3 billion) was attributed to cardiovascular disease.
- Nearly two thirds of allocated cardiovascular disease expenditure (65% or $9.2 billion) was spent on hospital services.
- Expenditure on cardiovascular disease in 2020–21 increased with age to be highest among males aged 65–74 and females aged 75–84.
What is expenditure on cardiovascular disease?
This section provides recent data on health care expenditure on cardiovascular disease (CVD), with details by type of condition, health care service, age group, and sex.
It includes expenditure by the Australian Government, state, territory and local governments and the non-government sector (including private health insurance and individual contributions).
These estimates report direct, allocated and recurrent expenditure only. They do not account for the total amount spent on cardiovascular health.
Note: Estimates are not directly comparable to previous disease expenditure estimates due to changes to data and methods. Further information on how the estimates were derived is available from the Health system spending on disease and injury in Australia 2020-21 web report.
How much is spent on cardiovascular disease?
In 2020–21, an estimated 9.5% of total allocated expenditure in the Australian health system ($14.3 billion) was attributed to CVD (AIHW 2023).
CVD was the disease group with the second highest expenditure in 2020–21, behind musculoskeletal disorders ($14.7 billion) and cancer and other neoplasms ($14.6 billion). The high expenditure on CVD reflects its position as a leading cause of death and a major contributor to the overall burden of disease in Australia.
The most expensive cardiovascular conditions in 2020–21 were coronary heart disease, atrial fibrillation and stroke. An estimated:
- 17.7% of CVD expenditure ($2.5 billion) was spent on CHD
- 9.7% of CVD expenditure ($1.4 billion) was spent on AF
- 6.9% of CVD expenditure ($983.8 million) was spent on stroke (Figure 1).
Figure 1: Health care expenditure on selected cardiovascular conditions, 2020–21
The horizontal bar chart shows the leading cardiovascular conditions in terms of health care expenditure in 2020–21. Coronary heart disease was most costly, estimated at $2.5 billion followed by atrial fibrillation and flutter at $1.4 billion and stroke at $1.0 billion.

Where is the money spent?
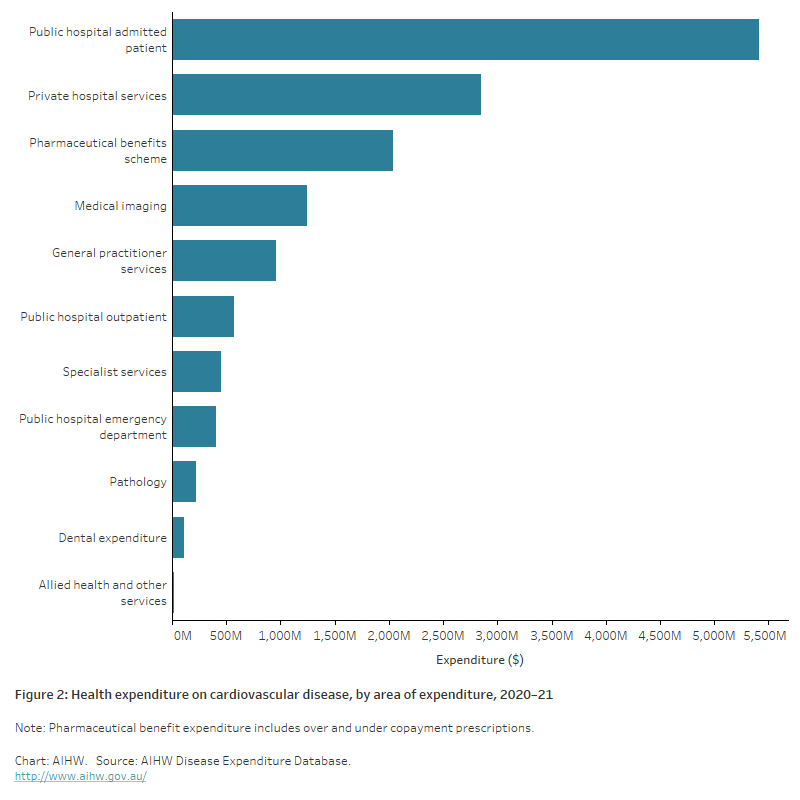
In 2020–21, nearly two thirds of allocated CVD expenditure (65% or $9.2 billion) was spent on hospital services. This included expenditure on public hospital admitted patients ($5.4 billion), private hospital services ($2.8 billion), public hospital outpatients ($567.7 million) and public hospital emergency departments ($406.2 million).
Another 20% ($2.9 billion) related to non-hospital medical services (primary care), comprising medical imaging ($1.2 billion), GP services ($955.1 million), specialist services ($450.8 million), pathology ($223.9 million) and allied health and other services ($22.6 million).
A small amount of CVD expenditure (0.8% or $107.2 million) was spent on dental services.
The remaining 14% ($2.0 billion) was spent on prescription pharmaceuticals dispensed through the Pharmaceutical Benefits Scheme (PBS) (Figure 2).
Figure 2: Health care expenditure on cardiovascular disease, by area of expenditure, 2020–21
The horizontal bar chart shows health care expenditure areas for cardiovascular disease in 2020–21. The costliest areas were Public hospital admitted patients at $5.4 billion, Private hospital services at $2.8 billion and Pharmaceutical Benefits Scheme at $2.0 billion.

Expenditure was distributed differently for each cardiovascular condition. In 2020–21:
- hospital services represented 82% of CHD expenditure, 57% of AF expenditure, and 88% of stroke expenditure
- non-hospital medical services represented 12% of CHD expenditure, 12% of AF expenditure, and 11% of stroke expenditure
- PBS costs represented 6.2% of CHD expenditure, 31% of AF expenditure, and 1.9% of stroke expenditure.
Who is it spent on?
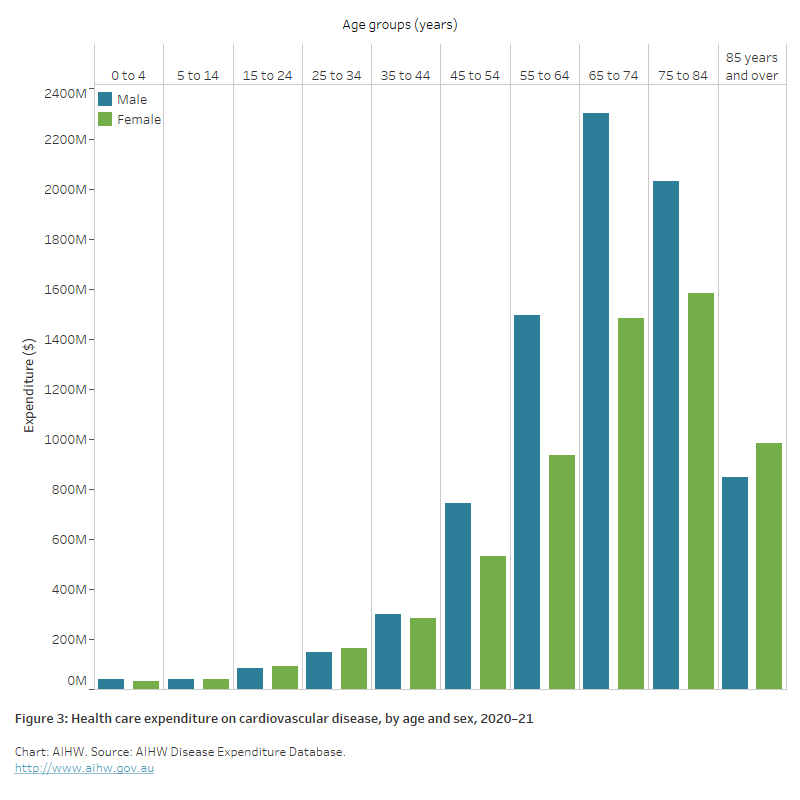
Expenditure on CVD in 2020–21 was low among young people, but increased sharply from age 45–54 to be highest among males aged 65–74 and females aged 75–84 (Figure 3).
From age 35–44, expenditure on CVD was higher among males than females, except at age 85 and over, reflecting the higher prevalence of CVD among males. At ages 55–64 and 65–74, expenditure for males was more than 1.5 times as high as for females.
Most of this difference was related to expenditure on hospital services, where a total of $5.5 billion was spent on males, compared with $3.7 billion on females.
Expenditure on non-hospital medical services (primary care) was slightly higher among females ($1.5 billion, compared to $1.4 billion among males), despite the higher prevalence of CVD among males.
Expenditure in the area of prescription pharmaceuticals was higher among males ($1.1 billion) compared to females ($949.4 million).
Figure 3: Health care expenditure on cardiovascular disease, by age and sex, 2020–21
The bar chart shows health care expenditure for cardiovascular disease in 2020–21 was highest among males aged 65–74 at $2.3 billion, and females aged 75–84 at $1.6 billion. Expenditure was higher for females than males in the 85 and over age group.

First Nations people
In 2019–20, expenditure on hospitalisations for First Nations people living with CVD was $260.7 million – equivalent to 3.3% of total expenditure on hospitalisations for people with CVD. This equated to $305 per First Nations person, compared with $307 for non-Indigenous persons (AIHW & NIAA 2023).
Hospitalisation for rheumatic heart disease (RHD) among First Nations people accounted for 3.0% of total First Nations hospital expenditure on CVD. The per person expenditure on RHD hospitalisation for the First Nations population was almost 4 times the per person expenditure for the non-Indigenous population.
Australian Institute of Health and Welfare (AIHW) (2023) Health system spending on disease and injury in Australia 2020-21, AIHW, Australian Government, accessed 14 December 2023.
AIHW & NIAA (National Indigenous Australians Agency) 2023. Aboriginal and Torres Strait Islander Health Performance Framework: 3.21 Expenditure on Aboriginal and Torres Strait Islander health compared to need, AIHW, Australian Government, accessed 21 November 2023.


