Emergency department presentations
Emergency departments (ED) are an essential component of Australia’s health care system. Many of Australia’s public hospitals have purpose-built EDs, staffed 24 hours a day, providing care for patients with heart, stroke or vascular disease who require urgent medical, surgical or other attention.
 There were 339,000 presentations to Australian public hospital EDs with a principal diagnosis of cardiovascular disease (CVD) in 2020–21 – a rate of 1,300 presentations per 100,000 population.
The triage category indicates the urgency of the patient’s need for care. Of ED presentations with a principal diagnosis of CVD in 2020–21, 15,500 (4.6%) were triaged as ‘resuscitation’ and needed immediate care, 149,700 (44%) were ‘emergency’ (within 10 minutes), 127,200 (38%) were ‘urgent’ (within 30 minutes), 42,200 (12%) were ‘semi-urgent’ (within 60 minutes) and 4,600 (1.4%) were ‘non-urgent’ (within 120 minutes) (AIHW 2022).
Almost two-thirds (63%) of ED presentations with a principal diagnosis of CVD were subsequently admitted to the hospital they presented to in 2020–21, with another 30% departing without being admitted or referred, and 5.8% referred to another hospital for admission.
In addition to ED presentations with a principal diagnosis of CVD, there were 385,000 ED presentations with symptoms of ‘Pain in throat and chest’ (ICD-10-AM R07) in 2020–21. Of these, 158,000 (41%) were subsequently admitted to hospital for further investigation and treatment (AIHW 2022).
Age and sex
In 2020–21:
- there were 179,000 male and 160,000 female presentations to Australian public hospital ED with a principal diagnosis of CVD
- the age-standardised male rate of presentation was 1.2 times as high as the female rate
- more than half of presentations (192,000, or 57%) were among people aged 65 and over
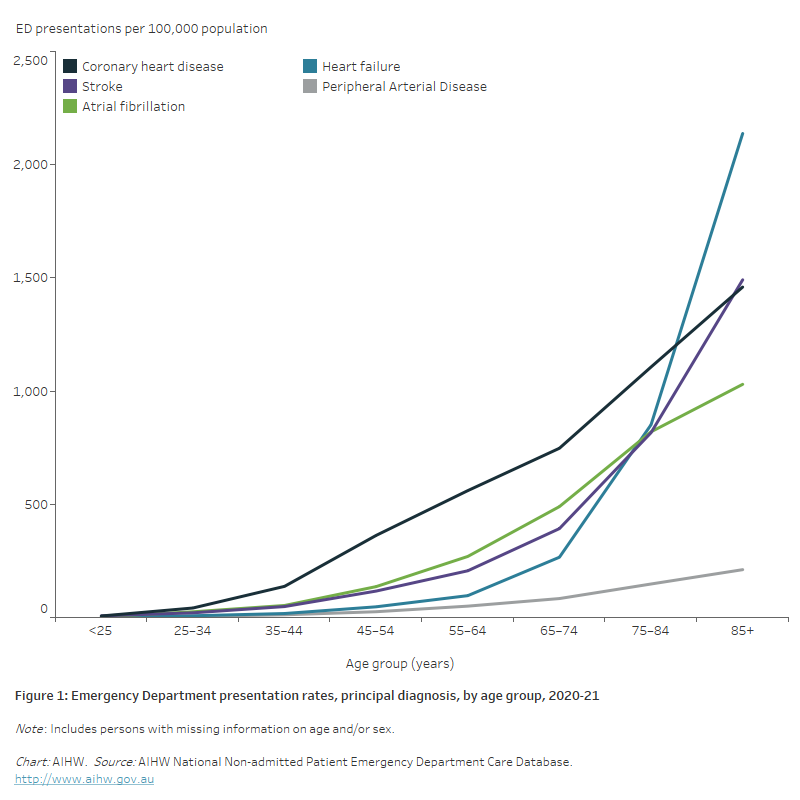
- presentation rates increased with age, to be highest among males and females aged 85 and over ― more than twice as high as age 65–74.
- at age 55–64, the male rate of presentation was 1.5 times as high as the female rate. At age 25–34, the female rate of presentation was 1.1 times as high as the male rate.
Variation among population groups
In 2020–21, after adjusting for differences in the age structure of the populations:
- Indigenous people presented to EDs with a principal diagnosis of CVD at 2.4 times the rate of non-Indigenous people
- rates increased with remoteness, being 1.7 times as high in Remote/very remote areas compared to Major cities
- rates for people living in the lowest socioeconomic areas were 1.9 times as high as for people in highest socioeconomic areas.
Figure 1: Emergency Department presentation rates, principal diagnosis, by age group, 2020–21
The line chart shows the increasing rate of Emergency Department presentations for CVD with age in 2020–21, most notably for heart failure and stroke from age 65–74.

Principal diagnosis
In 2020–21:
- there were 75,900 ED presentations with a principal diagnosis of coronary heart disease (CHD), 43,600 with atrial fibrillation (AF), 41,100 with stroke, 34,400 with heart failure and cardiomyopathy, and 8,200 with peripheral arterial disease (PAD)
- the age-standardised rate of ED presentation by principal diagnosis for males compared to females varied, from 1.2 times as high for AF, 1.3 for stroke, 1.4 times for heart failure and cardiomyopathy, 1.7 for CHD and 1.9 times for PAD
- Indigenous Australians had much higher age-standardised ED presentation rates than non-Indigenous people for CHD (3.5 times as high) and for heart failure (3.7 times as high)
- people living in the lowest socioeconomic areas had much higher age-standardised ED presentation rates than people in the highest socioeconomic areas for CHD (2.8 times as high), heart failure and cardiomyopathy (2.5 times as high) and PAD (2.4 times as high)
- the rate of admission to hospital following ED presentation varied by principal diagnosis, from 62% for AF presentations, to 77% for CHD presentations, and 83% for stroke and for heart failure and cardiomyopathy presentations.
Reference
AIHW 2022. My Hospitals. Emergency department care. Emergency department care 2020–21 data. Table 4.6–4.10. Canberra: AIHW.


