GP services
Timing of most recent visit
Clients may visit GPs for a number of reasons, including preventive care, immunisations and screening, acute illnesses or injuries, chronic disease management, antenatal care, palliative care, follow-up of test results, health education, referrals to specialist or multidisciplinary care, or for medical certificates. The NACCHO and the Royal Australian College of General Practitioners (RACGP) recommend that all Aboriginal and Torres Strait Islander people visit a GP at least once a year for a comprehensive health check.
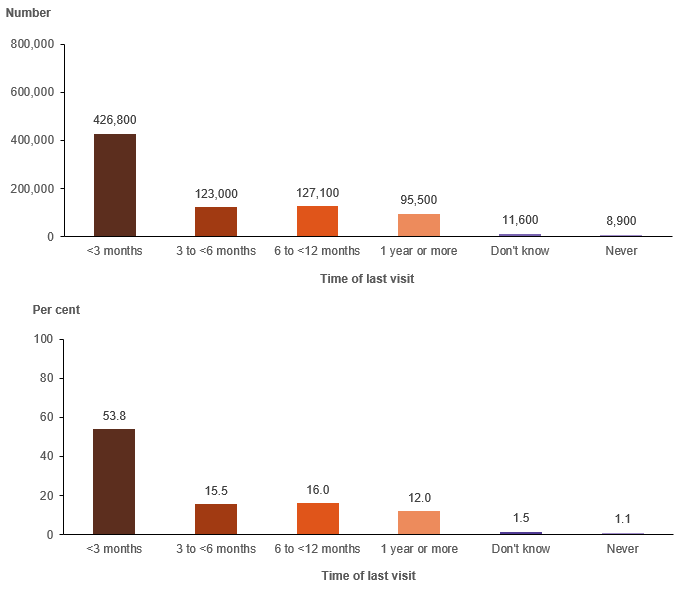
The 2018–19 NATSIHS data show that for just over half of Aboriginal and Torres Strait Islander people their most recent visit to a GP was within the past 3 months (54%, 426,800 people).[1] At the national level, just over 12% report not having seen a GP within the past 12 months.
Figure 5.3: Aboriginal and Torres Strait Islander people, most recent visit to a GP, 2018–19
Notes
- Excludes respondents who answered 'saw specialist in last 2 weeks but not a GP’.
- Estimate for those reporting ‘Don’t know’ has a relative standard error between 25% and 50% and should be used with caution.
Source: AIHW analysis of 2018–19 NATSIHS using TableBuilder (ABS 2019).
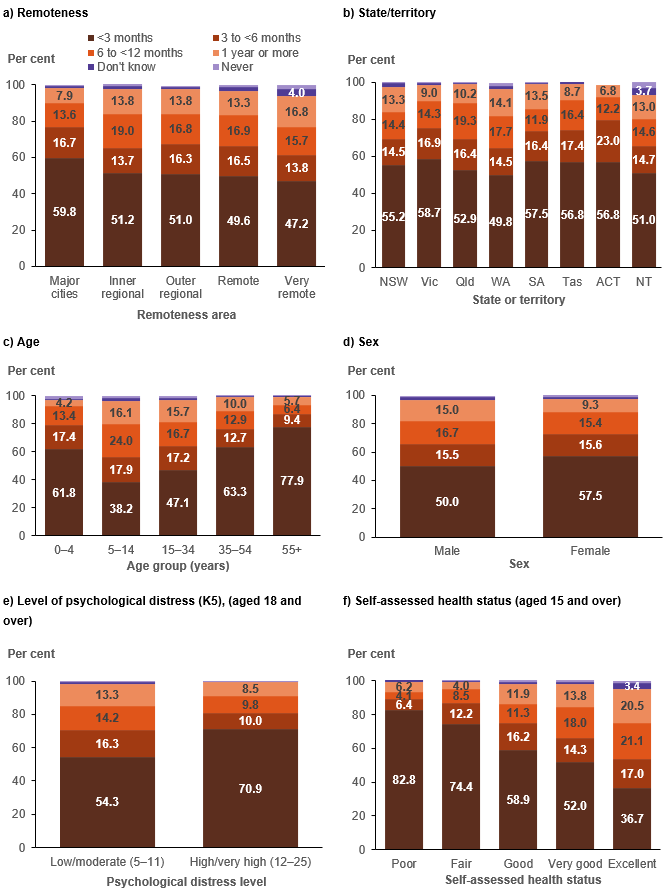
The timing of the most recent visit to a GP varies considerably by a number of the independent variables (Figure 5.4; Data: Descriptive analysis supplementary tables, Table S.5). In terms of the location variables, those Aboriginal and Torres Strait Islander people living in Major cities were most likely to have had a recent visit (60%) and least likely to have gone more than a year without seeing a GP (7.9%). The pattern is reversed for those living in Very remote areas where 47% saw a GP in the past 3 months and 17% had not seen a GP in the past 12 months.
There are also variations by state and territory – for at least 13% of those in New South Wales, Western Australia, South Australia and the Northern Territory, their most recent GP visit was more than 12 months before the survey, compared with fewer than 7% of those in the Australian Capital Territory.
There are also a number of differences by individual-level characteristics. Females were more likely than males to have seen a GP in the past 3 months (58% compared with 50%), while 15% of males reported that their most recent visit was more than 12 months before the survey (compared with 9.3% of females).
Figure 5.4: Aboriginal and Torres Strait Islander people, timing of most recent visit to a GP, by selected characteristics, 2018–19
Notes
- Excludes respondents who answered 'saw specialist in last 2 weeks but not a GP’.
- Estimates for those reporting ‘Don’t know’ or ‘Never’ have a relative standard error between 25% and 50% and should be used with caution.
Source: AIHW analysis of 2018–19 NATSIHS (ABS 2019) using TableBuilder.
As would be expected, the very young (0–4-year-olds) and 55 and over age groups were more likely to have seen a GP in the past 3 months compared with teenagers and young adults, with 78% of those aged 55 and over seeing a GP in the past 3 months compared with 38% of 5–14-year-olds.
Recency of visit is also related to self-assessed health and to levels of psychological distress among adults. Eighty-three per cent of those with poor health saw a GP in the past 3 months, compared with 37% of those in excellent health; 71% of those with high/very high levels of psychological distress saw a GP in the past 3 months, compared with 54% of those with low/moderate levels.
Unmet needs
NATSIHS respondents were asked whether there was ever a time during the past 12 months where they (or their child) needed to go to a GP but did not. If they said there had been an occasion of unmet need, they were given a list of 13 potential reasons why they did not go and asked to tick as many as applied.
While the question does not provide any information on why the person (or their child) needed to go to the doctor in the first place (for example, whether it was for an acute event or illness, part of ongoing chronic disease care, for preventive care, or for something such as a medical certificate), it is a direct measure of the person’s perceived unmet need.
The findings suggest that of 814,000 Aboriginal and Torres Strait Islander people in 2018–19:
- 712,600 (88%) had no unmet need for GPs
- 101,400 (13%) had at least one instance in the past 12 months when they needed to see a GP but did not.
Unmet need for a GP was slightly higher among those whose usual source of care was a mainstream GP (13%) than among those whose usual source of care was an AMS/CC (9.2%).[2]
Figure 5.5 presents both the percentage of each included group with unmet need and the number of Aboriginal and Torres Strait Islander people with that characteristic who had at least one occasion of unmet need. It shows that:
- those in Major cities had both the highest proportion (15%) and the highest number of people with unmet need (47,400), compared with all other remoteness areas
- while the Australian Capital Territory had the highest proportion of people with unmet need (25%), it also had the lowest number of people (1,900 people). In absolute terms, New South Wales and Queensland had the highest number of people with unmet needs (34,400 and 25,000, respectively)
- fewer than 2% of children (aged 0–14) had an occasion of unmet need in the past 12 months, compared with 21% of those aged 35–54. The highest number of people with an unmet need were in the 15–34 age group (nearly 43,000)
- there were 49,600 people living in the most disadvantaged areas with unmet need
- the proportion of adults who had experienced unfair treatment in the past year with unmet need was 31%, which is double the proportion of those who had not experienced unfair treatment
- those with disability and those with a long-term health condition had considerably higher rates of unmet needs than their counterparts. The results indicate that, in 2018–19, 86,100 Aboriginal and Torres Strait Islander people with a long-term health condition had at least one occasion of unmet need in the previous 12 months, and that 64,700 people with disability had unmet need.
Figure 5.5: Aboriginal and Torres Strait Islander people, unmet need for GP in the past 12 months, by selected characteristics, 2018–19
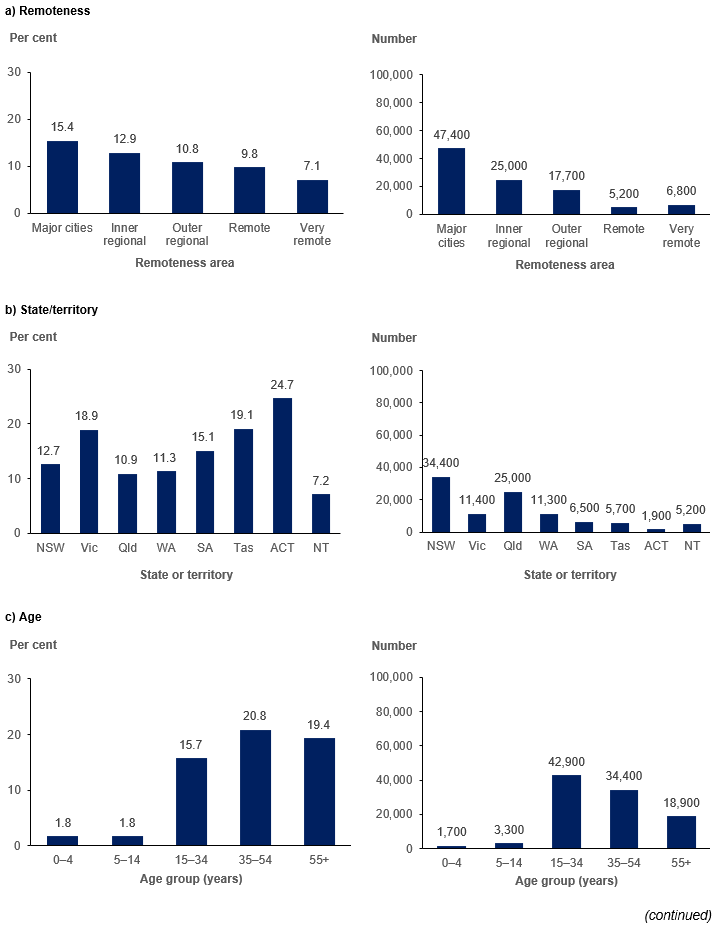
Source: AIHW analysis of 2018–19 NATSIHS (ABS 2019) using TableBuilder.
Figure 5.5 (continued): Aboriginal and Torres Strait Islander people, unmet need for GP in the past 12 months, by selected characteristics, 2018–19
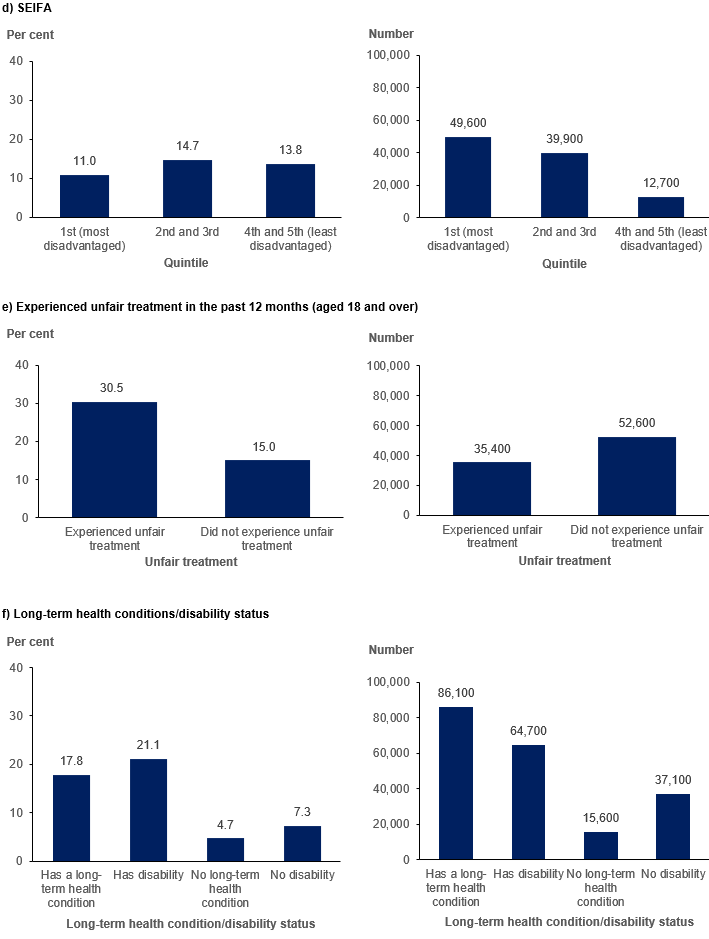
Source: AIHW analysis of 2018–19 NATSIHS (ABS 2019) using TableBuilder.
Reasons for unmet need
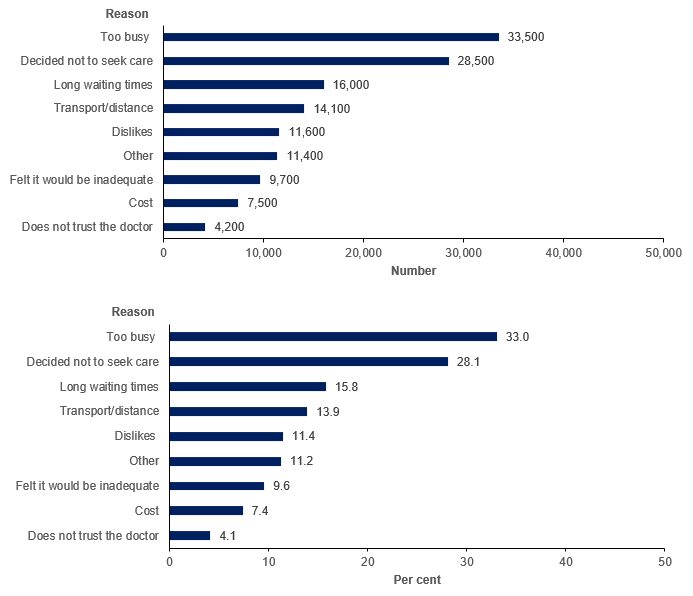
Respondents with unmet need could select as many of a set of 13 reasons as they wanted to explain why they were unable to obtain the care they needed. As shown in Figure 5.6, the most common reasons were being too busy, and deciding not to seek care. Without knowing the underlying reason for wanting to see a GP on the occasion, it is difficult to speculate why a person decided not to seek care, although it may be that the issue resolved itself (for example, an acute illness).
System factors, such as long waiting times and transport/distance were the next most frequently cited reasons. Cost was cited as a reason by only 7.4% of those with unmet need.[3]
Figure 5.6: Aboriginal and Torres Strait Islander people, reasons had unmet need for a GP, 2018–19
Notes
- Percentage distribution is calculated only on those who said they had at least one occasion of unmet need in the past 12 months.
- Only reasons with an acceptable standard error were included.
- The full wording of the graph label ‘Dislikes’ is ‘Dislikes (service/professional, afraid, embarrassed)’. Respondents were allowed to select multiple responses.
Source: AIHW analysis of 2018–19 NATSIHS (ABS 2019) using TableBuilder.