Mental health
Mental health services accessed by new patients: linked data analysis
Last updated:
Background
This report describes the types of mental health contacts accessed by new patients in 2018 and highlights differences in the broad types and combinations of services by sex, age group, remoteness area and socioeconomic disadvantage. The analysis uses linked national health datasets and state and territory public hospital data from the National Health Data Hub (NHDH) data asset (AIHW 2025b).
The analysis population was people identified as ‘new patients’, that is, who accessed their first, or first in at least 5 years, in-scope mental health-related service during 2018.
The in-scope services with available data were:
- Medicare Benefits Schedule (MBS) claims for mental health-related services.
- Dispensed Pharmaceutical Benefits Scheme (PBS) prescriptions for mental health-related medications.
- Public hospital emergency department (ED) presentations where there was a principal diagnosis of a mental health disorder.
- Public and private hospital admitted patient care (APC) episodes with specialised psychiatric care or a principal diagnosis of a mental health disorder.
- Public hospital outpatient (non-admitted) care (OPC) for select clinic service types.
This analysis included all in-scope NHDH mental health-related services accessed during the 12 months from, and including, the initial contact. The calendar year 2018 was selected as the most recent year of data available in the NHDH dataset when the analysis was initiated to ensure that the 12-month follow-up period for all new patients was completed before the end of 2019 and before the onset and impacts of the emergency phase of the COVID-19 pandemic.
Important caveats for this report include:
- People may have accessed other mental health-related services that are not measured in the available data. These include (but are not limited to): private medical consultations, private hospital emergency department presentations, community and residential mental health care, online/phone support services, or other MBS services such as GP attendances that were not billed as a mental health item.
- The NHDH does not include ED and APC data from Western Australia or the Northern Territory, nor OPC data from Western Australia, the Northern Territory, or South Australia.
The Methodology and technical notes section contains detailed information on the in-scope services, data caveats, limitations, and methodology of this analysis.
Key findings
Services
Around 962,500 people had their first, or first in at least five years, in-scope mental health service contact in 2018. This new patient cohort represented around 4% of the Australian population and accessed nearly 4.9 million services during the 12 months following, and including, their first service contact. A third (38%) of the cohort accessed a single service during this period, while 20% had 9 or more contacts, including 6% who had at least 16 contacts.
First mental health contacts comprised 53% MBS services, 42% dispensed PBS prescriptions, 2% ED presentations, 2% APC and 1% OPC services. The high proportion of PBS prescriptions as first contact indicates that many patients received their initial prescription in a consultation that was not captured as a mental health service in the data. These could include via a private specialist appointment or a GP consultation that was not billed as a mental health-related item.
Patient characteristics
Notable demographic differences in the type of first mental health contact include:
- New patients who were female or in younger age groups were more likely to access MBS services as the first contact and ongoing contacts than males or older age groups.
- Male patients, those in older age groups, or patients in remote areas were more likely to access PBS prescriptions than MBS services as their first or ongoing contacts.
- Patients in the 18–24 age group, and specifically males, were more likely to have an ED presentation as a first contact and during the 12-month follow up, compared with other sex and age groups.
- People residing in areas of greater socioeconomic disadvantage had higher hospital contact rates (ED, APC or OPC) and lower MBS rates during follow-up, compared with less disadvantaged areas.
By age group, overall patient and 12-month mental health contact rates peaked among the 18–24 age group (largely driven by MBS services) with a secondary peak among the 75 and over group (largely driven by PBS prescriptions). For the older group high rates of PBS prescriptions could possibly be related to mental health symptoms associated with neurodegenerative conditions such as dementia.
Service combinations and distributions during follow-up
The 38% of patients who had a single contact included 17% of patients who received a single MBS mental health service and 19% a single PBS mental health prescription. Around a quarter of patients accessed multiple MBS services without any PBS or hospital (ED, APC and/or OPC) contacts and a further 15% accessed multiple PBS without any MBS or hospital contacts. Eighteen percent of patients accessed a combination of MBS and PBS. Three percent of patients accessed hospital care only (single or multiple contacts) without any MBS or PBS, and a further 3% accessed hospital services in combination with MBS and/or PBS.
The number of monthly contacts dropped during the first six months and levelled off for the second half of the follow-up period. In the twelfth month following first contact, 16% of the cohort accessed 226,000 contacts, 61% of which were for dispensed PBS prescriptions. The sustained number of contacts indicates a portion of new patients who accessed ongoing mental health services, particularly medication.
Age cohorts
Differences in types of service accessed was observed between the age groups of Youth (0–17 years), Working age (18–64 years) and Older patients (65 years and over). Latent class analysis of contacts during the 12month follow-up indicates that the underlying patient groups with the largest population shares among each age cohort were:
- 70% of Youth patients were in a class characterised by primarily MBS contact
- 53% of Working age patients were in a class characterised by MBS and PBS contacts
- 78% of Older patients were in a class characterised by PBS contacts
Examination of service flows between different contact types by broad age group highlights some further differences in Hospital service pathways. Of patients who presented to ED (4% of Youth, 3% of Working age, 4% of Older patients), 43% of the Older patients had APC as their next contact, compared with 26% of Working age and 16% of Youth ED presentations.
New patient overview
Service summary
Key points:
- An estimated 4% of the Australian population had their first (or first in at least five years) mental health-related service contact during 2018.
- 38% of these patients had no further mental health-related service contacts recorded during the subsequent 12-month period.
- 20% of the new patients had more than 9 contacts in the 12-month follow-up, including 6% who had more than 16 contacts.
There were 962,500 people identified as new patients who had their first (or first in at least 5 years) in-scope mental health-related service in Australia during 2018. These patients, represented around 4% of the Australian estimated resident population and 18% of the 5.5 million people (new and continuing patients) who accessed in-scope mental health services in 2018. New patients accessed nearly 4.9 million services during the 12-month follow-up period from their first contact (Table 1). Most contacts were MBS services (53% of services, accessed by 62% of patients) followed by PBS prescriptions (44% of services, accessed by 53% of patients).
| Service type | Patients | Patient percent | Patient rate per 1,000 population | Services | Service percent | Contact rate per 1,000 population |
|---|---|---|---|---|---|---|
| MBS | 600,332 | 62 | 24 | 2,592,126 | 53 | 104 |
| PBS | 512,739 | 53 | 21 | 2,114,642 | 44 | 85 |
| Hospital subtotal | 65,665 | 7 | 3 | 153,525 | 3 | 7 |
| Emergency department (ED) | 32,058 | 3 | 1 | 39,709 | 1 | 2 |
| Admitted care (APC) | 27,659 | 3 | 1 | 41,307 | 1 | 2 |
| Outpatient care (OPC) | 17,410 | 2 | 1 | 72,509 | 1 | 4 |
| Total new patients | 962,574 | 100 | 39 | 4,860,293 | 100 | 195 |
NOTE: The sum of patient percentages does not equal 100% as patients may access multiple types of services. The sum of service percentages may not equal the total due to rounding. The hospital subtotal comprises ED, APC, and OPC unique patients and services. Patient and contact rates for hospital services were calculated using the sum total populations of the states and territories that contributed data, not the national Australian total population.
Source: National Health Data Hub AIHW
Thirty eight percent of the cohort accessed a single in-scope service. The median number of contacts during the 12-month follow-up was 2. There were 191,000 patients (20%) who had 9 or more contacts, including 56,400 patients (6%) who had more than 16 contacts. The number and type of contacts and combinations are examined in more detail in the section Service type combinations during follow-up.
Demographic characteristics
Key points
- The new patient cohort comprised 53% female and 47% male patients.
- Females in the age groups 18–24, 25–34 and males 75 years and over had the highest patient rates of 5% of the estimated population, compared with 3%–4% for the other sex and age groups.
- The new patient cohort represented around 2% of people residing in Remote and Very remote areas, compared with around 4% of people in Major cities, Inner regional and Outer regional areas.
The new patient cohort represented around 4% of the Australian resident population and was 53% female and 47% male.
Nearly half (48%) of the cohort was under 35 years of age. The 18–24 age group had the highest population rate of just under 5% (46 patients per 1,000 population), compared with 3%–4% for the other age groups. This was largely due to a higher rate for females in the 18–24 and 25–34 age groups (5%) compared to males (4%) in those age groups. The highest rate for males was for the 75 years and over age group (5% of the population), compared with 3%–4% for males in younger age groups, and 4% for females 75 years and over.
The median number of contacts was higher for patients in the 0–17 age group (4 services), and 18–24 or 25–34 groups (3), compared with the older age groups (2). The median number of contacts was the same for males and females overall, and between males and females of corresponding age groups.
By address of usual residence at the first mental health contact, patients in Remote and Very remote areas had the lowest patient rate, representing around 2% of the population, compared with around 4% for Major cities, Inner regional and Outer regional areas.
Patient rates were similar for all Socio-Economic Index for Areas (SEIFA) quintiles at around 4% of the population. Patients who resided in Quintile 5 (least disadvantaged) areas had a median of 3 contacts during the 12-month follow-up compared to 2 for patients who resided in areas of greater disadvantage.
Just under 20,300 (2%) of the cohort died during the 12-month follow-up. The proportion of patients who died was slightly higher among males (3%) compared with females (2%). The proportion of patients who died was also higher among the older age groups, particularly the 75 and over group at 18%, compared with the younger age groups (less than 1% of the age groups under 55 years, 2% of the 55–64 age group, and 5% of the 65–74 age group).
First mental health service contacts
Key points:
- First mental health service contacts were most frequently MBS services (53%) or PBS prescriptions (42%).
- With each older age group, and each increasingly remote category of usual residence, patients were more likely to have a PBS prescription and less likely to have an MBS service as their first mental health contact.
- Male patients in the 18–24 age group had the highest proportion of first contacts that were ED presentations at 5% compared with 1%–3% for other sex and age groups.
The 962,500 patients had over 1 million ‘first’ mental health services due to nearly 71,500 (7%) of the new patient cohort receiving multiple services on the day of their first contact. MBS services made up over half (53%) of all first contacts, comprising 49% General Practitioner (GP) services, and the remaining 4% from Other medical practitioners, Psychologists, Psychiatrists, and Other allied health.
PBS prescriptions made up 42% of first contacts (20% Antidepressants, 10% Anxiolytics, 9% Hypnotics and sedatives, and 1% each Antipsychotics and Psychostimulants, agents used for ADHD and nootropics). The high number of PBS dispensed prescriptions as first contacts suggests that medications are often prescribed during consultations and treatment that are not billed as MBS mental health items (for example, using general GP items). ED and APC each accounted for 2% of first contacts, and OPC accounted for 1%.
Female patients had a higher proportion of first contacts that were MBS (56%, compared with 51% for males), and a lower proportion that were PBS (40% compared with 43% for males).
The proportion of first services that were MBS was highest for the 0–17 age group at 80%, and decreased with each older age group, down to 14% for patients 75 and over (Figure 1). The opposite was observed for PBS which increased from 13% of first services for the 0–17 age group, up to 77% for those 75 and over. Antidepressants, as the most frequently dispensed medication type, was a main contributor to this trend, making up larger proportions of first services for each older age group, from 5% for the 0–17 group, to 35% for patients 75 and over. The proportions of Anxiolytics and Hypnotics and sedatives also increased with each older age group, to a peak among the 65–74 age group (16% for Anxiolytics and 21% for Hypnotics and sedatives).
Figure 1: Proportions of first contacts by service type among each age group, remoteness area and SEIFA quintile of new patients in 2018
Interactive bar graph shows lower proportions of MBS contacts with each older age group, and higher proportions of PBS contacts. The proportion of hospital contacts is highest for the 75 and over age group.

Source: National Health Data Hub
The 18–24 age group had the highest proportion with ED as a first contact (4,600 presentations, 4% of first contacts). By sex and age group, males 18–24 had the highest number (2,800) and proportion of first contacts (5%) that were ED, compared with 1%–3% for other groups. Patients 75 years and over had the highest proportion of first contacts that were APC (4,200 contacts, 5% of first contacts).
There were lower proportions of MBS and higher proportions of PBS as first contacts with each increasing category of remoteness (Figure 1). For patients in Major cities, first contacts comprised 56% MBS and 39% PBS, compared with 38% MBS and 56% PBS for those in Remote and Very remote areas. By SEIFA quintile, patients residing in Quintile 1 (greatest disadvantage) areas had a lower proportion of first contacts that were MBS items (49% compared with 51%–57% for patients in areas of lower disadvantage), and slightly higher proportions that were ED (3% compared to 1%–2%).
Patients who died during the 12-month follow-up period had higher proportions of first contacts that were PBS, ED, APC or OPC, and lower proportions that were MBS, compared with patients who did not die. This trend was evident within each age group, although noting that the number of deaths among the age groups under 65 years were too low to make reliable inferences about associations with first contact type.
Contacts during the 12-month follow-up
Key points:
- Overall patient and mental health contact rates peaked among young adults in the 18–24 age group and then were lower with each older age group, before rising again in the 75 and over age group.
- Females were more likely to access MBS services compared with males.
- MBS patient rates peaked among the 18–24 age group.
- PBS and Hospital patient rates peaked among people in the 75 and over age group.
- MBS services rates where highest among people residing in Major cities or in areas of least socioeconomic disadvantage.
- People in areas of greater socioeconomic disadvantage had higher Hospital contact rates compared with people in less disadvantaged areas.
During the 12 months following the first in-scope mental health contact in 2018, for people overall (both sexes), patient and contact rates were highest for the 18–24 years age group at 46 patients and 257 contacts per 1,000 population (Figure 2). The rates were lower for each older age group, until increasing again among people aged 75 and over. By sex, the contact rates for females peaked among the 18–24 age group at 294 services per 1,000 population, while for males the peak contact rate was equal highest among the 18–24 and 75 and over age groups (221).
Figure 2 also shows that the peak in mental health contact rates for the 18–24 age group was mainly driven by MBS, while the high rates among the 75 and over age group was driven by PBS. People in the 18–24 age group also had slightly higher mental health related contact rates of 4 ED presentations per 1,000 population for males and 3 for females, compared with 1–3 for males in other age groups and 1–2 for females in other age groups.
Both sexes showed similar directions of trends over the age groups, but females 18–24 had considerably higher MBS and PBS contact rates compared with males. This was driven by higher contact rates for GP, Clinical Psychologist and Other Psychologist services and Antidepressants prescriptions in this age group compared with males. Males in the 75 and over age group had higher PBS, Psychiatrist, and hospital patient rates compared with females.
The higher contact and patient rates among the older population is likely related to the higher prevalence of dementia-related conditions and associated treatment for mental-health symptomology (AIHW, 2024a). The majority of people living with dementia in Australia are women, although men living with dementia tend to have higher rates of hospitalisation and are more likely to be prescribed Antipsychotics, compared with women (AIHW, 2024a).
Figure 2: 12-month patient and service population rates for new mental health services patients in 2018, by sex and age group
Interactive line chart shows that the highest service rates were for females in the 18–24 age group (294 services per 1,000 population), while in later life in the 75 and older age group, males had higher service rates (221) compared with females (196).

Source: National Health Data Hub
For people in Remote and very remote areas, the patient rates for PBS prescriptions were higher compared with MBS services (15 vs. 11 per 1,000 population, respectively), but were both considerably lower than the rates for patients in Major cities where the MBS patient rate (25) was higher than PBS (19) (Figure 3). Figure 3 also shows this trend where, as remoteness increased the MBS patient and contact rates decreased, and patients were more likely to access PBS than MBS. The MBS service rate was more than 3 times higher for people residing in Major cities at 111 per 1,000 population, compared with 33 in Remote and very remote areas.
The lower MBS rates for Remote and very remote areas are consistent with the patterns in general MBS services by remoteness area (AIHW 2023). This is also likely related to lower mental-health service availability in more remote areas. The 2018 full time equivalent rates per 100,000 people for psychologists and psychiatrists was lower with each category of increasing remoteness (Psychologists ranged from 25 for Very remote to 106 for Major cities, and Psychiatrists ranged from 3 to 16, respectively) (AIHW 2020).
Figure 3: 12-month patient and service population rates for new mental health service patients in 2018, by remoteness area and SEIFA quintile
Interactive bar chart shows that patients in Remote and Very remote areas had lower MBS and PBS contact rates than people in Major cities or Inner or Outer regional areas. It also shows that people in areas of greater disadvantage had lower MBS service rates compared with people in areas of lower disadvantage.

Source: National Health Data Hub
By SEIFA Quintile, the patient and contact rates for MBS were lowest for people residing in SEIFA Quintile 1 (most disadvantaged) areas, with a gradient of higher service rates with each quintile of decreasing disadvantage (Figure 3). People residing in Quintile 1 (most disadvantaged) areas received 83 MBS services per 1,000 population, compared to 121 for people in Quintile 5 (least disadvantaged) areas. These results are consistent with patterns observed for MBS services in general (AIHW 2023) and may reflect barriers to accessing services for patients in more disadvantaged and remote areas and/or lack of service provision in these areas.
Hospital (ED, APC and/or OPC) contact rates also followed a gradient, with rates for people residing in the more disadvantaged quintiles, from 10 services per 1,000 population for people in the most disadvantaged areas, to 5 in the least disadvantaged areas. It should be noted that the ED and OPC hospitals data is for public hospital services only. Private hospital services are more likely to be accessed by patients with greater socioeconomic advantage and residing in urban areas where private psychiatric hospitals are predominantly located (AIHW 2024b).
Service type combinations during follow-up
Key points
- 38% of patients had a single mental health contact.
- Most patients had either MBS only (42%), PBS only (33%), or a combination of MBS and PBS (18%).
- 17% of the new patient cohort accessed a single MBS service and 26% had multiple MBS services without PBS or Hospital.
Overall, during the 12-month follow-up, 38% of patients had a single in-scope contact, including 19% had a single PBS prescription and 17% had a single MBS service (Figure 4). Of all the new patient cohort, 27% had 2–4, 16% had 5–8, 14% had 9–15, and 6% had 16 or more mental health contact over the 12 months.
Forty two percent of patients accessed MBS only. This means that in addition to the 17% with a single service, 26% of new patients accessed multiple MBS services without any other service type (12% with 2–4 contacts, 8% with 5–8, 5% with 9–15 and 1% with 16 or more). The 33% of patients who accessed PBS only, included the 19% dispensed one PBS prescription, 8% with 2–4, 3% each with either 5–8 or 9–15 and less than 1% with 16 or more prescriptions. The PBS only group highlights that mental health services are often provided in consultations not billed using MBS mental health-related items, for example, other General Practitioner items.
In addition, 18% of patients had a combination of various numbers of MBS and PBS contacts. Three percent of patients accessed hospital services only (either single or multiple), and a further 3% accessed hospital services in combination with MBS and/or PBS.
Figure 4: Number and percentage of patients by service intensity and service combinations, during the 12-month follow-up
Bar chart shows that 38% of new patients only accessed a single service. It also shows that of those who did access multiple services, most accessed either MBS only, PBS only, or a combination of MBS and PBS services.

Source: National Health Data Hub
Key points
- 16% of the cohort (151,500 patients) accessed 226,000 services during the final month of the follow-up period.
- There were sustained numbers of PBS prescriptions dispensed each month, primarily for Antidepressants, whereas MBS services showed gradual tapering over time to level out during the last few months of the follow-up period.
After an initial drop from over 1 million first contacts at ‘time zero’, there were around 616,500 in-scope mental health contacts during the first month of the follow-up period (Figure 5). This was followed by continued declines in the number of monthly contacts, to level off by 7 months after first contact, to more than 213,500 contacts each month for the remainder of follow-up, accessed by more than 147,500 patients (at least 15% of the cohort). During month 6 there were 272,000 contacts by 19% of the cohort and during month twelve there were 226,000 contacts by 16% of the cohort.
Figure 5: The 2018 new patient cohorts’ mental health related service and patient count each month for the 12 months following first contact
Interactive line chart shows that all service types have the highest number of services and patients at first contact or during the first month (for non-GP MBS providers such as psychologists), and then services and patients decline and level out over the second half of the follow-up

Source: National Health Data Hub
MBS services showed a decline from 556,000 first contacts to 451,000 then 316,000 services during the first and second months respectively, before exhibiting a slower decline in subsequent months (Figure 5). During the last month of the follow-up there were 83,100 MBS contacts by 56,600 patients.
There was a drop in GP services from 508,500 contacts at time zero, to 92,700 in month one and 37,700 in month two. In contrast, Psychologist, Clinical psychologist, Psychiatrist, and Other allied services peaked during month one before they also decreased steadily, with the decline slowing around the 8- or 9-month mark. These patterns of MBS contacts likely reflect that following initial contact with a GP for a mental health plan or referral, some patients go on to seek ongoing treatment services from mental health professionals.
The number of ED (21,300 first services) and APC (18,000 first services) also had considerably fewer services in the subsequent first few months, and both levelled out by month six to between 1,100–1,500 services per month for the remainder of follow-up.
Age cohort analysis
Key points:
- The Youth (0–17 years) age group was characterised by MBS services, with 85% having an MBS service during the 12-month follow-up.
- Working age (18–64 years) patients were more likely to have a mixture of MBS and PBS contacts, with 65% accessing MBS and 56% dispensed PBS prescriptions during the 12-month follow-up period.
- The Older patient (65 years and over) group were characterised by PBS contacts, with 74% dispensed a prescription as a first contact, and 82% dispensed a prescription during the follow-up period.
- 4% of Youth accessed OPC compared with 1% of Working age and Older patients.
- The ED presentation rates for Youth, Working age and Older patients were 4%, 3% and 4% respectively. Of patients who presented to ED, 43% of the Older patients had APC as their next contact, compared with 26% of Working age and 16% of Youth ED presentations.
The cohort overview shows different modes of service use according to age group and life stage. The following analysis has been separated into 3 broad age groups: Youth (0–17 years, 190,500 patients), Working age (18–64 years, 622,500 patients), and Older patients (65 years and over, 150,000 patients).
Service characteristics of age cohorts
To examine if the broad age cohorts were characterised by different types or combinations of services, a modelling technique, known as latent class analysis was used to identify unobserved (for example, ‘latent’) classes. Details of this method are outlined in Methodology and technical notes.
The model for Youth included 4 classes, while the models for Working age and Older patients each had 3 classes. The estimate class population shares and conditional probabilities of class membership for each service type are reported in Table 2, with darker shades highlighting the service types that have higher probabilities. For example, membership in the Youth MBS+PBS class (incorporating 22% of the Youth population) indicates that people in that class had a 60% probability of having had an MBS service and 100% probability of a PBS prescription.
Table 2: 2018 new patient age cohort classes, population share, and probabilities of indicator (service type) membership
Table that shows the proportions of each cohort assigned to each class, and the probabilities that people in each class would have accessed each type of mental-health related service.

Source: National Health Data Hub
Consistent with the results presented in the section Service type combinations during follow-up, each age cohort includes classes with large population shares characterised (probabilities ≥ 0.4) by either mainly MBS, PBS, or MBS+PBS. For example, 53% of the Working age group were estimated to fall into a class characterised by MBS+PBS and 41% fell into a class characterised by MBS only. Furthermore, the size of the population shares for the MBS and PBS dominated groups reflect the results of earlier sections of this report First mental health service contacts and Services accessed during the 12-month follow-up:
- Youth patients had the largest proportion of the cohort (70%) allocated to the class characterised by MBS
- The Working age patients had 53% allocated to a class characterised by MBS+PBS
- The largest class (78%) for Older patients was characterised by PBS
Within each age cohort, the classes with smaller population shares had different features when compared between the cohorts:
- Youth had two small classes of 4% of patients each, one characterised by APC+OPC, and the other by ED+MBS services
- 6% of the Working age cohort were in a class that was characterised by a combination of MBS+PBS+ED
- 8% of the Older patient cohort were in a class characterised by PBS+ED+APC
Service flows
The flows between the different mental health service types during the 12-month follow-up were examined by broad age cohort.
Youth service flows indicate that:
- MBS was the first type of contact for 154,000 patients (81%).
- During the 12-month follow-up period, 85% of patients accessed MBS services, 23% accessed PBS, while ED, APC and OPC were each accessed by 4% of patients.
- Just under 22,000 patients accessed PBS as a first contact without accessing MBS on the same day.
- The median time between MBS contacts, where there was no intervening service of another type, was 14 days, while the median time between PBS prescriptions without intervening services, was 31 days.
- 1,200 (16%) of the 7,600 who presented at ED then received APC as their next service.
- 7% (around 500 patients) of those who had an ED presentation had repeat presentations with no other type of service accessed in between, with a median of 8 days between presentations.
The number of young people with PBS as their first contact indicates a substantial number of prescriptions that were issued at a first recorded MBS contact on the same day, or during consults not billed using a mental health-related MBS items. It was explored whether this could be related to private or other consultations not captured in the data.
Of the nearly 17,700 children dispensed Psychostimulants, agents used for ADHD or nootropics during the period, nearly two thirds (63%, 11,100 patients) had a prescription as a first contact. Fewer than 200 of these patients also had an MBS service as a first contact on the same day. Of the 11,100 with a Psychostimulants, agents used for ADHD or nootropics prescription dispensed as a first contact, 90% received the prescription from a Paediatrician, 3% from a Psychiatrist, 5% from a GP, and 2% from other types of practitioners. Furthermore, of the 23,100 children dispensed Antidepressants during the 12-month period, 44% (10,100 patients) had an Antidepressant prescription dispensed as a first contact. Of these, 77% were prescribed by GPs, 11% by Paediatricians, 5% by Psychiatrists and 6% by Other medical practitioners.
The large proportions for PBS first contacts for children who received Psychostimulants, agents used for ADHD or nootropics and Antidepressant prescriptions highlights that there are a considerable number of mental-health related consultations (possibly multiple, preceding a formal diagnosis) being administered by health professionals, which are not captured in the data under MBS mental health items. This could be due to them being billed using other MBS items or administered under other health programs.
The flow between the broad types of mental health services accessed by the Working age population indicates that:
- 65% of patients accessed MBS services during the 12 months, 56% PBS, 3% ED, 2% APC, and 1% OPC.
- MBS patients who had no other contact between MBS services, had a median of 14 days between contacts, while PBS patients with no other intervening contacts had a median of 29 days between prescriptions.
- Of the 19,200 (3% of Working age) patients who presented to ED, around 4,900 patients (26%) progressed to APC as their next contact, and 1,200 (6%) had return presentations to ED with no other contact in between, with a median of 1 day between presentations.
- Just under 3,400 patients (<1%) died during the 12-month follow-up, with the majority (around 80%) having had PBS as their last contact.
The flow between the broad types of mental health services accessed by the Older patient group indicates:
- There was a high number of patients with PBS as a first contact (110,900, 74% of patients), and who accessed PBS during the 12 months (122,100, 82%).
- Approximately 4% (5,200) of Older patients presented to ED, with 5% returning to ED after a median of 19 days without any contact in between, which was a lower proportion and a longer intervening time compared with the younger age groups.
- 43% (around 2,200) of patients who presented to ED progressed to APC as their next contact, which is a substantially higher proportion than for Working age ED presentations (26%) and Youth ED presentations (16%).
- Just over 11% of the older patient cohort died during the 12 months.
Examination of the hospital data indicates that the Dementia, other organic mental disorders, Alzheimer's disease group were the principal diagnosis recorded for 53% of ED presentations and 57% of APC contacts for the Older patient cohort. In contrast, dementia-related conditions were listed as the principal diagnosis among 7% of mental health ED presentations and only 2% of APC for patients under 65 years of age.
Conclusion
This analysis presents associations between MBS, PBS and hospital mental health service use patterns and demographic factors. Of note are the differences in service use by sex and age group, including the higher likelihood of younger people, and particularly females, to access mental health related MBS services compared to the propensity of older people to have PBS contacts.
The observed differences likely relate to a range of factors, including treatment guidelines, social factors and perceptions around mental ill health and appropriate types of mental health care, or differences in physical health and conditions over the life cycle. For example, a child with a mood disorder is less likely to receive an antidepressant prescription as the first line or sole treatment, compared with an elderly person with a mood disorder comorbid with a neurodegenerative condition. Differences in service use by remoteness area or area of socioeconomic disadvantage is also likely to relate to variations in service availability as well as geographic and economic barriers affecting access.
Statistical (latent class) analysis supported the results of the descriptive analysis around differing MBS and PBS service use by life stage, with Youth patients (0–17 years) characterised by MBS contacts, while Working age (18–64 years) were characterised by a combination of MBS and PBS contacts, and Older patients (65 years and over) were characterised by PBS contacts. Service flow analysis highlighted differences in hospital contacts, with larger proportions of Older patients who progressed from an ED presentation to APC as the next contact, compared with the Working age and Youth cohorts.
Future directions
Continuing from this high-level overview, further linked-data analyses could investigate questions concerning different age cohorts, or patients with specific mental health conditions, and interactions between more detailed service information such as MBS provider type, PBS medication type, or hospital setting.
The high proportion (42%) of PBS mental health related medication dispensing as a first contact highlights that many contacts that involve a mental health component and in which the medication was prescribed, are not captured in the data, such as general MBS GP consultations. Examination of non-mental health MBS items in proximity to PBS prescriptions may be helpful to understand the extent to which this occurs.
Where can I find more information?
For more information refer to:
Methodology and technical notes
The following datasets in the National Health Data Hub (NHDH), formerly the National Integrated Health Services Information analytical asset (NIHSI AA), were used for this report, noting that some states and territories do not contribute hospitals data (AIHW 2025b):
- Medicare Benefits Schedule (MBS) – National data.
- Pharmaceutical Benefit Scheme (PBS) including Repatriation Pharmaceutical Benefits Scheme (RPBS) data – National data.
- Emergency department (ED) – public hospital data from New South Wales, Victoria, Queensland, South Australia, Tasmania, and the Australian Capital Territory
- Admitted patient care (APC) National Minimum Data Set – public hospital data from New South Wales, Victoria, Queensland, South Australia, Tasmania, and the Australian Capital Territory, and private hospital data from Victoria, Queensland, and the Australian Capital Territory.
- Outpatient (Non-admitted) care (OPC) – public hospital data from New South Wales, Victoria, Queensland, Tasmania, and the Australian Capital Territory.
- National Death Index – National data.
The specific mental health-related services for each data type that were included in the analysis are detailed in Table 3. In-scope mental health-related service contacts.
| Mental health service type | Mental health service |
|---|---|
| MBS | Mental health- related MBS items by date of service, as outlined in the ‘Data source’ section of the AIHW Medicare mental health services online report (AIHW 2025a) |
| PBS | Prescription dispensed, by date of supply, for Anatomical Therapeutic Chemical (ATC) level 3 codes (WHO, 2025):
|
| Emergency Department | Public hospital presentations where the patient had an ICD-10-AM 10th edition (IHPA, 2017) mental-health related code recorded as their principal diagnosis code. The relevant codes are outlined in Table Class code 1 in the Classification codes section at: classifications and technical notes No data available for Western Australia or the Northern Territory. |
| Admitted patient care | Public and private hospitalisations where the patient received mental health care with specialised psychiatric care setting (for example, psychiatric hospital or ward), or in a non-specialised psychiatric care setting where the patient had an I ICD-10-AM 10th edition (IHPA, 2017) mental-health related code recorded as their principal diagnosis. The relevant codes are outlined in Table Class code 1 in the Classification codes section at: classifications and technical notes No data available for Western Australia or the Northern Territory. Private hospital data only available for Victoria, Queensland, and the Australian Capital Territory. |
| Non-admitted patient care | Outpatient care by a public hospital according to the following Independent Health and Aged Care Pricing Authority, previously the Independent Hospital Pricing Authority (IHPA) Tier 2 Non-Admitted Services Classification (IHPA, 2018):
No data available for Western Australia, South Australia, or the Northern Territory. |
Population selection
Patients with linked data and Medicare enrolment were drawn from the NHDH demographics data set. Patients who had any mental health-related service during the 2018 calendar year, were identified according to the in-scope services outlined in Table 3.
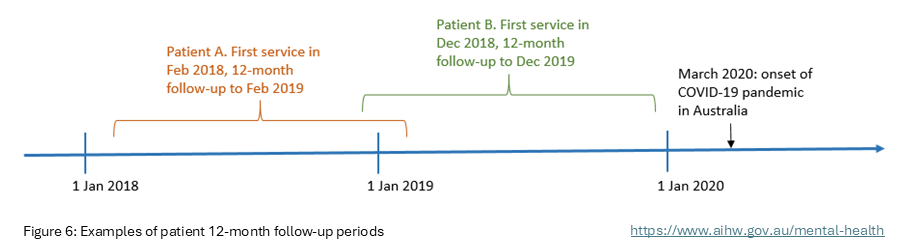
Patients were retained in the population and categorised as ‘new patients’ if they had not had any of the in-scope mental health-related services in the 5 years preceding the day of their first mental health service contact in 2018. Data on all mental health-related service contacts during the 12 months following the day of first contact in 2018 was then added to the dataset. The National Death Index dataset was used to determine date of death for patients who died during the 12-month follow-up period. The calendar year 2018 was selected so that services could be tracked for a full 12 months, without the data being affected by the impacts of the COVID-19 pandemic (Figure 6).
Figure 6: Examples of patient 12-month follow-up periods
Patient sex and age were extracted from NHDH demography data. Geospatial data was determined by the Statistical Area Level 2 (SA2) area of usual residence recorded for a mental health service in the relevant NHDH data set. Patient age and SA2 were determined according to date of birth and SA2 as at their first mental health service contact in 2018.
A patient’s remoteness area was based on concordance of their SA2 of usual residence to the Australian Statistical Geographical Standard 2016 Census remoteness areas based on the Accessibility/Remoteness Index of Australia (ABS, 2018a). A patient’s SEIFA Quintile was based on concordance of their SA2 of usual residence to the Socio-Economic Index for Areas (SEIFA) 2016 Index of Relative Socio-Economic Disadvantage (ABS, 2018b).
Limitations
The results reported are likely to be an under-estimate of the measured services due to the unavailability of:
- Unlinked patients, and patients with missing demographic data.
- Information about other types of mental health services where data was not available, such as but not limited to, community mental health services, private consultations, and general GP consultations not billed as mental-health items.
- Private hospital emergency department and outpatient data.
Furthermore, the hospitals data is missing data from some states and territories, as outlined in Table 3. To examine the impacts of this a sensitivity analysis was conducted. See the Sensitivity analysis section below for analysis results excluding these jurisdictions.
Patient and service rates
The rates reported are crude rates. The rates for MBS, PBS and Totals are calculated using the estimated resident national population as of 30 June 2018. To adjust for missing Western Australia and Northern Territory data, the rates for ED, APC, and Hospital subtotal rates were calculated using the sum of populations from New South Wales, Victoria, Queensland, South Australia, Tasmania, and the Australian Capital Territory. To adjust for missing Western Australia, South Australia and Northern Territory data, the rates for OPC were calculated using the sum of populations from New South Wales, Victoria, Queensland, Tasmania, and the Australian Capital Territory.
Sensitivity analysis
Due to missing state and territory data for ED, APC and OPC services, sensitivity analyses were performed, restricting the analysis to patients who only had services in New South Wales, Victoria, Queensland, Tasmania, and the Australian Capital Territory. An overview of this sub-population is shown in Table 4. When compared to the full population in Table 1, the differences in patient and service percentages and rates are small. In the sensitivity analysis population 8% of the cohort were Hospital patients and their services accounted for 4% of all services, compared with 7% and 3% respectively for the full population.
Source: National Health Data Hub
Latent class analysis
Latent class analysis a probabilistic modelling technique used to group data to identify unobserved (for example, ‘latent’) classes within a population (Sinha et al 2021). The analysis used five categorical indicators for each patient, identifying if they had accessed each of the following in-scope mental health service types during the 12-month follow-up period: MBS, PBS, ED, APC, OPC. The indicators for each service type were binary and did not account for the quantity of services, or any dimension of time. A process of fitting multiple models and evaluating model performance to select the optimal model, identified the latent classes and the probability of class membership for each observation.
Latent class analysis was performed in R (version R-4.2.2) using the poLCA suite of packages (version 1.6.0.1) and dependencies (Linzer and Lewis 2011). Models up to 5 classes were considered, with an increasing number of iterations to achieve maximum likelihood convergence. Goodness of fit to select the model with the most appropriate number of classes was done by evaluating the Akaike information criterion (AIC) and Bayesian information criterion (BIC), associated elbow plots, and interpretability of model classes.
A sensitivity analysis was also performed, using the sub-population which exclude data from Western Australia, South Australia, and the Northern territory. The sensitivity analysis patient count for the broad age groups were: 158,491 Youth, 509,859 Working age, and 123,121 Older patients. The latent class analysis on these sub-populations produced very similar results to the models run on the full populations. The same number and type of classes were suggested for each age group, but with differences of 1%–2% for the population shares:
- Youth: MBS = 70%, MBS+PBS = 21%, APC+OPC = 5%, ED+MBS = 4%
- Working age: MBS+PBS = 51%, MBS = 42%, MBS+PBS+ED = 7%
- Older patients: PBS = 76%, MBS = 15%, PBS+ED+APC = 9%
Service flow analysis
The age cohort service flow analysis was undertaken in R (version R-4.2.2) using the bupaR suite of and dependencies (Janssenswillen 2023). Further information about bupaR and process analytics can be found at Bupar.
Patient service type data was constructed as an ‘event’ log whereby each service was a unique activity with a date and an imputed time stamp. As the NHDH data at the time of analysis had only month, year, and day difference available, a proxy date for a service was created whereby the first day of service contact was given the date of the first of the month and subsequent services had the date calculated by the difference in days from that first event. To avoid having services recorded as occurring simultaneously on the same day, services were given a time stamp 1 second different from each other to create an arbitrary order. For example, a GP service was timestamped at 1 second past midnight, an Other Medical Provider item was timestamped at 2 seconds past midnight. The order of broad service types was MBS, PBS, ED, APC, OPC. If a patient died, their death ‘event’ was ordered last.
A sensitivity analysis was run on the Youth, Working age and Older patient sub-populations excluding data from Western Australia, South Australia, and the Northern territory. Similar service flow results were produced with some proportions or median days differing only slightly for example, by one percentage point or 1 day, respectively.
| Service type | Patients | Patient percent | Patient rate per 1,000 population | Services | Service percent | Contact rate per 1,000 population |
|---|---|---|---|---|---|---|
| MBS | 498,053 | 63 | 24 | 2,155,779 | 54 | 106 |
| PBS | 410,708 | 52 | 20 | 1,672,958 | 42 | 82 |
| Hospital subtotal | 60,504 | 8 | 3 | 144,247 | 4 | 7 |
| Emergency department | 28,201 | 4 | 1 | 34,728 | 1 | 2 |
| Admitted care (APC) | 25,152 | 3 | 1 | 37,541 | 1 | 2 |
| Outpatient care (OPC) | 17,317 | 2 | 1 | 71,978 | 2 | 4 |
| Total | 791,499 | 100 | 39 | 3,972,984 | 100 | 195 |
ABS Australian Bureau of Statistics
ADHD Attention Deficit Hyperactivity Disorder
AIHW Australian Institute of Health and Welfare
APC Admitted Patient Care
ATC Anatomical Therapeutic Chemical
ED Emergency Department
ICD International Classification of Diseases
ICD-10-AM International Classification of Diseases, 10th Revision, Australian Modification
IHPA Independent Hospital Pricing Authority
IRSD Index of Relative Socioeconomic Disadvantage
LCA Latent Class Analysis
MBS Medicare Benefits Schedule
NHDH National Health Data Hub
OPC Outpatient Care
PBS Pharmaceutical Benefits Scheme
RPBS Repatriation Pharmaceutical Benefits Scheme
SA2 Statistical Area Level 2
SEIFA Socio-Economic Index for Areas
WHO World Health Organisation
ABS (Australian Bureau of Statistics) (2018a) 1270.0.55.005 - Australian Statistical Geography Standard (ASGS): Volume 5 - Remoteness Structure, July 2016, ABS, Australian Government, accessed 4 April 2025.
ABS (2018b) 2033.0.55.001 - Census of Population and Housing: Socio-Economic Indexes for Areas (SEIFA), Australia, 2016, ABS, Australian Government, accessed 4 April 2025.
AIHW (Australian Institute of Health and Welfare) (2020) Data tables: Mental health workforce 2018 [XLSX 490kB], AIHW, Australian Government, accessed 3 April 2025.
AIHW (2023) Medicare Benefits Scheme funded services over time, AIHW, Australian Government, accessed 4 April 2025.
AIHW (2024a) Dementia in Australia, AIHW, Australian Government, accessed 4 April 2025.
AIHW (2024b) Hospitals, My Local Area, AIHW, Australian Government, accessed 4 April 2025.
AIHW (2025a) Mental Health [website], AIHW, Australian Government, accessed 4 April 2025.
AIHW (2025b) National Health Data Hub [website], AIHW, Australian Government, accessed 4 April 2025, DOI: 10.25816/xdvs-6944
IHPA (Independent Hospital Pricing Authority) (2017) ICD-10-AM Chronicle – First Edition to Tenth Edition, IHPA, Sydney NSW.
IHPA (2018) Tier 2 Non-Admitted Services Compendium – 2018–19, IHPA, Sydney NSW, accessed 4 April 2025.
Janssenswillen G. (2023) bupaR: Business Process Analysis in R, R package version 0.5.3, CRAN.R-project.org [website], accessed 4 April 2025.
Linzer D.A., Lewis J.B. (2011) ‘poLCA: An R Package for Polytomous Variable Latent Class Analysis’, Journal of Statistical Software, 42(10), 1-29, DOI: 10.18637/jss.v042.i10
Sinha P., Calfee C.S., Delucchi, K.L. (2021) ‘Practitioner’s Guide to Latent Class Analysis: Methodological Considerations and Common Pitfalls’. Critical Care Medicine, 49(1), e63-e79, DOI: 10.1097/CCM.0000000000004710
WHO (World Health Organization) (2025) Anatomical Therapeutic Chemical (ATC) Classification [website], accessed 4 April 2025.