


A guide to using the First Nations Cancer data
Cancer data commentary number 13
There are various issues that impact Aboriginal and Torres Strait Islander (First Nations) data and different ways to consider the data. This cancer data commentary aims to help people use the First Nations cancer data and to understand the range of options to consider the data.
The approaches used within the First Nations reporting have been considered and approved by the Australian Institute of Health and Welfare Indigenous Statistics Internal Advisory Group.
Help understanding the Census 2021 and Census adjusted for changing identification time series
First Nations cancer incidence and mortality rates are calculated using the number of cases diagnosed/deaths (the numerator) and the estimated number of First Nations people in Australia (denominator). This section focusses on the issues associated in deciding what to use as estimated First Nations population and the impact on rates and trends for the different time series.
Changing identification in the Census
The First Nations population estimates are provided by the Australian Bureau of Statistics (ABS) through the Australian Census. The Census is conducted every five years. First Nations population estimates have increased substantially between Censuses (670,000 in 2011; 798,000 in 2016; and 984,000 in 2021), with much of the growth attributed to a greater propensity for First Nations people to identify as being of Aboriginal and Torres Strait Islander origin. For each Census, based on the most recent Census First Nations population estimates for the year are revised, recast population estimates going back several years and revised population projections into the future.
Impact of changing identification
Table 1 provides a comparison of First Nations and non-Indigenous age-standardised cancer incidence rates for 2011 based on the 2011 and 2021 Census First Nations population estimates. The 2021 Census produces cancer incidence rates which have the First Nations and non-Indigenous rates as quite similar, while the 2011 Census provides rate where the First Nations population cancer incidence is much higher. The cancer data does not change, only the population estimate is revised.
Table 1: Age-standardised cancer incidence rates, by Indigenous status, 2011, using the First Nations population estimates from 2011 and 2021 Censuses
Census | First Nations cancer incidence rate for 2011 (cases per 100,000 people) | Non-Indigenous cancer incidence rate for 2011 (cases per 100,000 people) |
|---|---|---|
First Nations population 2011 Census | 341.7 | 285.2 |
First Nations population 2021 Census | 279.8 | 286.3 |
Notes
1. Rates exclude South Australia and Tasmania
2. .Records with Indigenous status unknown have Indigenous status imputed
Source: AIHW Australian Cancer Database 2021
Discussion point 1: Which rate is correct?
Firstly, the concept of correct cannot be substantiated with the data but recommendations can be made. Of the rates in Table 1, the rates provided from the 2011 Census population are recommended. This is based on two main assumptions; the first being that like the Census, First Nations people were less likely to identify in cancer data in 2011. This would mean that the incidence rate in 2011 when using the 2021 Census is lower because many First Nations people did not identify in the cancer data. The second is that, age-standardised First Nations cancer incidence rates are much higher than non-Indigenous cancer rates and using the Census population of the time provides such comparatively high rates.
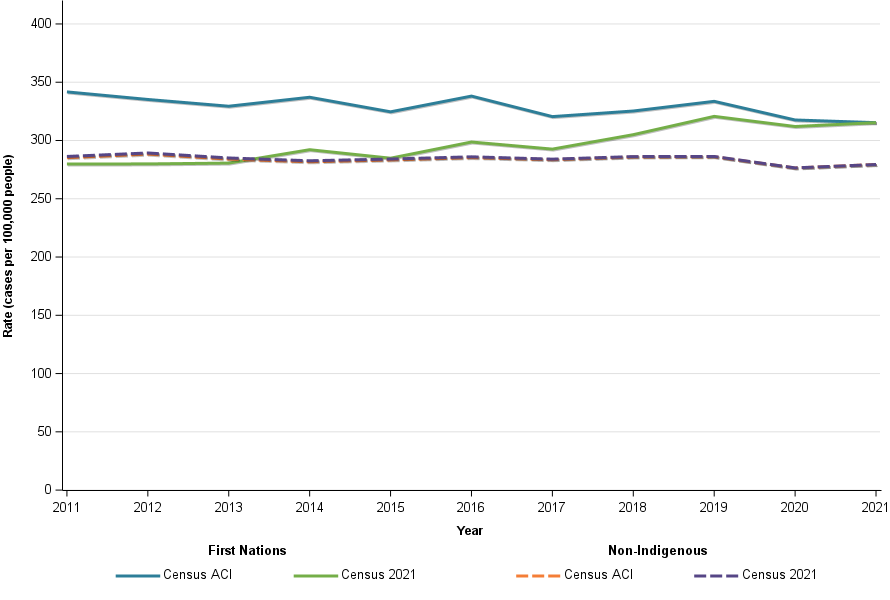
Figure 1 compares the First Nations and non-Indigenous cancer incidence rates over time when using the 2021 Census First Nations population as well as a constructed First Nations population referred to within this report as the Census adjusted for changing identification (Census ACI). The Census ACI uses the 2011 First Nations population for 2011, the 2016 Census population for 2016 and the 2021 Census for 2021. The years in between the Census are derived by First Nations populations incrementally and changing evenly.
The time series when using the Census ACI suggests First Nations cancer incidence rates have been consistently higher, have been decreasing slightly over time and move similar to the non-Indigenous trends. The Census 2021 time series suggests First Nations incidence rates used to be close to non-Indigenous, have been increasing and are no longer similar to non-Indigenous.
If the two Censuses are interpreted together, the Census 2021 time series provides rates which may be increasing to some extent due to increasing identification. The Census ACI attempts to provide rates adjusted for increasing identification.
Figure 1: Age standardised cancer incidence rate trend, by Indigenous status (cases per 100,000 people), using different Census population estimates, 2012 to 2021
Notes
1. Rates are standardised to the 2021 First Nations population
2. Rates exclude South Australia and Tasmania
3. Records with Indigenous status unknown have Indigenous status imputed
Source: AIHW Australian Cancer Database 2021
Discussion point 2: Given rates have uncertainty, why present the rates?
While First Nations data has several considerable challenges to consider, understanding cancer within the First Nations population and how it is changing is critically important. Recent rates are useful to understand the differences in cancer between the non-Indigenous and First Nations populations. Changes in cancer rates generally take time. Time series are critically important to understand cancer in the First Nations population, whether there appears to be improvement and whether trends move contradictory to the overall Australian population.
While there is uncertainty, the information is critical to attempt to provide. The use of the Census ACI provides a different and plausible time series and the method is based on the logic that First Nations people increasing identification in the Census also occurs in cancer data. Testing of the time series data when using many different cancers helps to confirm the plausibility of time series. It generally notes differences in rates between the First Nations and non-Indigenous population across years. It also often suggests that the First Nations cancer trends appear quite similar to non-Indigenous, irrespective of whether trends are relatively stable, increasing or decreasing.
Help understanding which age-standardised rate selection to use
The First Nations cancer incidence and mortality data includes cancer rates age-standardised to:
- The 2001 Australian Standard Population
- The Australian population for the year of release
- The 2021 First Nations population
Figure 2 compares the lung cancer incidence using the various age-standardised options noted above and the crude rates for First Nations people.
The 2001 Australian Standard Population is the standard population for Australia. For the below time series, it provides rates which are on average around twice the First Nations crude rate (Figure 2). Where a crude rate changes considerably when age-standardised, it is of little relevance to the age structure of that population. However, in being the standard Australian population it is commonly used and accordingly provided within the CdiA report.
The rates standardised to the current Australian population (2025 used below as this paper is released in 2026 but as part of the 2025 CdiA report) are higher than the 2001 Australian Standard Population. The higher rates occur because the Australian population has aged since 2001 and cancer rates are higher in older age groups. Given the magnitude of difference from the crude rate, the rates are even less relevant to the First Nations population but relevant to the Australian population as it currently is. After the 2026 Census is complete, the Australian standard population is anticipated to change to 2026.
The 2001 Australian Standard Population suggests that if First Nations population had the same (older) age structure as the Australian population in 2001, ‘these’ would be the cancer rates. The rates standardised to the 2025 Australian population standardised to an even older age structure. The rates standardised to the 2021 First Nations population are much closer to the crude rates as the age-structure is similar. The cancer rates are much lower because cancer is less common in younger populations and the First Nations population is, on average, much younger than the overall Australian population.
While the direction of trends produced by each standard population are similar, they are not the same. The projections in Figure 2 help illustrate this (the projections are for 2022 to 2025). Projections are based on trends. For the projections, there is a slight rate decrease projected when using the Australian population standard but slightly increasing using the First Nations. These generally slight differences occur where cancer trends differ by age to some extent and the older ages are given more weighting when standardising to the Australian populations. Also, in 2017 the age-standardised rates when using the Australian populations drop considerably while when standardised to the First Nations population, it decreases slightly. This will again be a result of the different weighting.
Figure 2: Age standardised lung cancer incidence rates, First Nations people, using selected age-standardised rates and crude rates, 2012 to 2025 (2022 to 2025 are projections)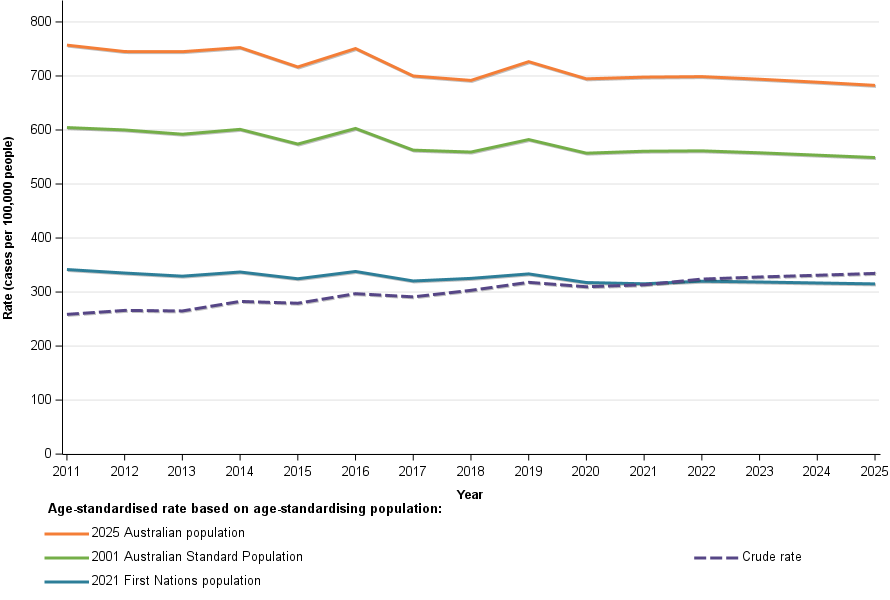
Notes
1. Rates exclude South Australia and Tasmania
2. Records with Indigenous status unknown have Indigenous status imputed
Source: AIHW Australian Cancer Database 2021
Discussion point: Which age-standardised rates should be used?
Similar to how Australia uses its population for understanding rates in Australia and not the World population for its standard population, the First Nations population age structure provides the rates most relevant to First Nations people. This does not mean that it is the standard population that should be used in all instances.
The most common age-standardised rate used is standardising to the 2001 Australian Population. As the standard, it provides rates suitable to compare with other statistics also using the standard. It would be common to use the rates standardised to the 2001 Australian Standard Population on the basis of the population being the standard.
Within the Cancer in Australia overview in the CdiA, cancer incidence and mortality rates are standardised to the current year. This is because the rates are relevant to today and focus on Australia. Adding information about First Nations people using the First Nations age-standardised rates within the overview makes it difficult for users to interpret because the rates will be lower than elsewhere in the overview, not because they are genuinely lower but because a different standard population is used.
However, within the CdiA First Nations cancer overview, we use the rates standardised to the First Nations population. Rates are most relevant to the First Nations population, trends are not potentially distorted by smaller elements of the First Nations population moving in different directions. Here the non-Indigenous population undergoes the greatest adjustment and the First Nations rates and trends are focussed on the age-structure of the First Nations population.
Each standard has its place, and each standard can be used. It is up to the user to decide which is best for their purposes and audience. However, when using the Australian current or 2001, it may be useful to confirm that the trends appear similar to those provided when standardising to the 2021 First Nations population.
Help understanding the raw data and imputed data
The standard question on Indigenous status—"Are you of Aboriginal and Torres Strait Islander origin?"—appears across various forms and data collections. The Australian Cancer Database (ACD) serves as the primary source for national cancer data, and statistics for the First Nations population depend on completed responses to this question. However, not all records have this information.
Within the ACD, only six jurisdictions have sufficiently complete Indigenous status data to allow for reliable First Nations cancer rate reporting. South Australia and Tasmania, while collecting this information, do not achieve the necessary completeness for inclusion. Even among the six reporting jurisdictions, the level of completeness varies, and many records have 'Not stated' for Indigenous status, rendering them unknown.
Figure 3 compares the incidence rates for all cancers combined when using the raw cancer data and imputed cancer data. The raw incidence rates are lower as they exclude records with Indigenous status unknown while the imputed derives the Indigenous status for these records. With increasing rates of Indigenous status unknown, the trends for both populations in the raw decrease to a greater extent, not because of actual decrease but because of increasing rates of records with unknown Indigenous status.
Figure 3: Age standardised all cancers combined incidence rates, by Indigenous status, raw and imputed data, 2012 to 2021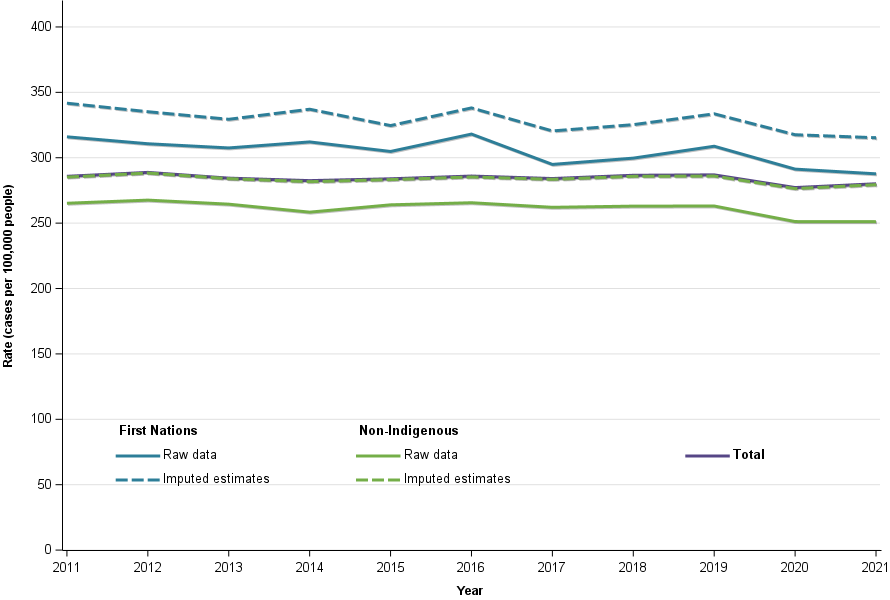
Notes
1. Rates are standardised to the 2021 First Nations population
2. Rates exclude South Australia and Tasmania
Source: AIHW Australian Cancer Database 2021
Discussion: why provide raw and imputed data?
The imputed results are more likely to provide rates similar to the ‘real world’ rates while the raw are definitely understated. For some reporting, raw data is preferred and the raw rates are provided for these uses. The raw data is also provided for transparency and understanding the completeness of the data and the impact of imputation.
The imputation works on the basis that the rates of First Nations and non-Indigenous people where the Indigenous status for the cancer record is unknown, are the same as where Indigenous status is known. While rates may be incorrect to the extent this is not true, the imputation method uses a variety of information to derive Indigenous status for the records where Indigenous status is unknown. The imputation method is discussed in Appendix 1.
Help understanding other aspects of the First Nations data
Do I use annual, 5-year or trend data?
There are many different cancers with differing rates. The extensive range of First Nations data is provided so that users can find the most relevant data for their analysis. For the most common cancers, annual reporting and 5-year age groups may be practical. For other less common cancers, 20-year age groups and 5-year pooled data may provide the most relevant insights.
The trend data is provided to help understand the most recent 10-year trends and is only available in the data visualisations. The trend removes the volatility that is often present when viewing the annual data.
Overall, it is combined that the data becomes most useful. The 5-year pooled data can be impacted by an unusual occurred such as COVID-19 seeing fewer cases diagnosed while restrictions were in place. The annual data helps to confirm the representativeness of the 5-year pooled rates.
Are all the incidence and mortality rates reliable?
The incidence and mortality rates are accurate but they are not always representative or genuinely useful. For most cancers, rates of First Nations people in the oldest age groups are often the least informative. The population is very small and for some cancers a single case leads to rates higher than the non-Indigenous rate. Highly volatile rates are more likely the result of a small population leading to great change of rates but only a small number of cases changing. Users are encouraged to view the number of cases and whether it is sufficient to be of use to understand cancer within the First Nations population, particularly where leading to conclusion of higher cancer rates for First Nations people.
Which rate survival rate should I use?
The most appropriate survival rate to compare the First Nations and non-Indigenous populations is the First Nations all ages survival and the non-Indigenous age-adjusted survival rate. Table 2 uses brain cancer survival rates to help illustrate the various survival comparisons.
Table 2: Brain cancer survival, by Indigenous status, 2017 – 2021, persons, by survival type
Survival type | First Nations | Non-Indigenous | Comments |
|---|---|---|---|
Observed survival | 45.6% | 22.2% | The observed survival is the percentage of those who survived 5-years. A limitation of this is that the people who died, may have died from other causes. For cancer, which more commonly occurs in older people, this may be a misleading figure with age being a main factor, rather than the cancer. |
Relative survival | 46.8% | 23.1% | The relative survival considers the observed survival and uses life table to calculate the comparability of survival with the general population. A relative survival rate of 100% suggests survival of the population is the same as the general population while 50% suggest it is half that of the general population. While relative survival comparisons are generally very useful, for First Nations and non-Indigenous comparisons, they may be limited by differences in age-structure. Younger people generally have higher survival rates and the First Nations population is much younger. Please note that First Nations and non-Indigenous life tables were used. This is because the life tables for the general population are not suitable for First Nations people. The First Nations life tables are developmental and please view the methods section for description of the method used. |
Relative and age-adjusted survival | 46.8% (relative) | 45.4% (relative and age-adjusted) | Here the non-Indigenous population is age-adjusted to be that of the diagnosed First Nations population. The very large increase to non-Indigenous brain cancer rates when age-adjusted occurs for two reasons. First, the population age-structure becomes equal to the younger First Nations population and so increases. Second, brain cancer survival rates differ by age more than most cancers with exceptionally low rates for the oldest ages. The smaller amount of older people in the age-adjusted non-Indigenous population contributes largely to the increase. It should be noted that most cancers only move several percentage points when age-adjusted. The brain cancer is chosen to highlight the potential impact where the age structure is changed and the cancer has more extreme survival rate differences by age.
|
Source: AIHW Australian Cancer Database 2021
Are there national First Nations cancer rates?
There are estimated national cases and deaths for First Nations people but there aren’t national mortality and incidence rates. The estimates are based on the rates from combined states and territories included in reporting (that is, all except for South Australia and Tasmania) and applied to the national First Nations population. This provides a broad estimate of First Nations cancer cases and deaths.
The survival rates are based on all records with known Indigenous status and excludes South Australia and Tasmania. These are not national survival rates but are used as the base to gauge cancer survival for First Nations people.
Appendix 1
This page discusses unknown Indigenous status within cancer data and the imputation method.
Rates of unknown Indigenous status
The rate of unknown Indigenous status varies by cancer type. Table 1a provides the rate of unknown Indigenous status by cancer type for First Nations cancer reporting. Cancers with unknown Indigenous status of more than 1 of every 3 records are excluded from reporting but as Table 1a indicates, most cancers are well below this rate. Cancers with higher rates of imputation should be considered with higher caution but there is uncertainty of all rates considering the various issues within the data. The cancers with the highest rates of unknown Indigenous status are likely collected by different types of services which do not collect Indigenous status or collect it comparatively infrequently. The mortality data has much lower Indigenous status unknown, likely because the mortality information includes Indigenous status.
Table 1a: Percentage of cancer records with unknown Indigenous status, excludes South Australia and Tasmania
Cancer | 2012 – 2016 | 2017 – 2021 |
Acute lymphoblastic leukaemia | 1.5 | 2.9 |
Acute myeloid leukaemia | 2.3 | 1.5 |
All blood cancers combined | 7.2 | 13.8 |
All cancers combined | 6.6 | 7.9 |
All sarcomas combined | 9 | 11.2 |
Ampullary cancer | 2.1 | 2.4 |
Anal cancer | 3.2 | 4.6 |
Appendiceal cancer | 10.6 | 13.5 |
Bladder cancer | 2.3 | 2.1 |
Bone cancer | 5.6 | 6.2 |
Brain and other central nervous system (cancer of the) | 2.3 | 1.5 |
Brain cancer | 2 | 1.2 |
Breast cancer | 3.8 | 4.8 |
Breast cancer (tumour size <= 2cm) | 3.6 | 3.4 |
Breast cancer (2cm < tumour size <= 5cm) | 2.6 | 3.1 |
Breast cancer (tumour size > 5cm) | 1.6 | 2.7 |
Breast cancer (tumour size unknown) | 7.5 | 10.9 |
Cervical cancer | 6.6 | 5.7 |
Chronic lymphocytic leukaemia | 15.4 | 33 |
Chronic myeloid leukaemia (CML) | 13.7 | 19.8 |
Chronic myelomonocytic leukaemia (including juvenile) | 4.9 | 8.6 |
Colon cancer | 4 | 3.4 |
Colorectal cancer | 3.8 | 3.4 |
Common cancers (2025) | 6.8 | 7.7 |
Connective, subcutaneous and other soft tissues (cancer of) | 5.7 | 6.8 |
Endometrial cancer | 4.4 | 4 |
Extrahepatic bile duct cancer | 1.1 | 1.8 |
Eye cancer | 5.3 | 9.5 |
Fallopian tube cancer | 1.5 | 2.5 |
Gallbladder and extrahepatic bile duct cancer | 1.9 | 2.1 |
Gallbladder cancer | 2.9 | 2.5 |
Gynaecological cancers | 4.6 | 4.4 |
Head and neck cancer (excluding lip) | 4.1 | 5.5 |
Head and neck cancer (including lip) | 8.8 | 10.1 |
Higher survival cancers (5yr survival above 90%) | 9.7 | 10.8 |
Hodgkin lymphoma | 4.4 | 7.9 |
Hypopharyngeal cancer | 1.1 | 2.3 |
Immunoproliferative cancers | 8.3 | 15.9 |
Kaposi sarcoma | 27.4 | 38.6 |
Kidney cancer | 5.3 | 4.7 |
Laryngeal cancer | 2.9 | 3.6 |
Less common cancers (2025) | 5.8 | 10 |
Leukaemia | 9.3 | 18.2 |
Lip cancer | 27.1 | 34 |
Liver cancer | 2.6 | 1.7 |
Low survival cancers (5yr survival below 30%) | 2.6 | 2.3 |
Lung cancer | 2.2 | 2.7 |
Lymphoma | 5.9 | 11.7 |
Major salivary glands (cancer of the) | 6.5 | 10.1 |
Melanoma of the skin | 21.6 | 25.3 |
Melanoma of the skin (Breslow <= 1mm) | 28.3 | 32.2 |
Melanoma of the skin (1mm < Breslow <= 2mm) | 14.1 | 16.3 |
Melanoma of the skin (2mm < Breslow <= 4mm) | 9 | 11.4 |
Melanoma of the skin (Breslow > 4mm) | 5.8 | 8.4 |
Melanoma of the skin (Breslow unknown) | 5.9 | 9.8 |
Mesothelioma | 1.3 | 1.9 |
Mouth cancer | 5.3 | 6 |
Multiple myeloma | 3.6 | 7 |
Myelodysplastic syndromes | 5.4 | 8.4 |
Myeloproliferative neoplasms | 13.2 | 22.7 |
Myeloproliferative neoplasms (excluding CML) | 13 | 23.4 |
Nasal cavity cancer | 5.6 | 4.8 |
Nasopharyngeal cancer | 4.9 | 8.6 |
Neuroendocrine neoplasms | 5.6 | 7.4 |
Non-Hodgkin lymphoma | 6.1 | 12.2 |
Non-melanoma skin cancer (rare types) | 11.8 | 20.6 |
Oesophageal cancer | 1.9 | 2.3 |
Oral cancer | 10.8 | 12 |
Oropharyngeal cancer | 3 | 5.8 |
Other and ill-defined digestive organs (cancer of) | 7.2 | 4.1 |
Other and ill-defined sites (cancer of) | 9 | 8.9 |
Other and ill-defined sites in the lip, oral cavity and pharynx (cancer of) | 1.5 | 2.8 |
Other and unspecified leukaemia | 6.1 | 1.9 |
Other and unspecified lymphoid leukaemia | 12.2 | 17.6 |
Other blood cancers | 14 | 14.8 |
Other central nervous system cancers | 6.4 | 6.1 |
Other endocrine glands (cancer of) | 10.7 | 11.4 |
Other female genital organs excluding serous carcinomas of the fallopian tube (cancer of) | 5.9 | 4.2 |
Other plasma cell cancers | 3.9 | 5.4 |
Other thoracic and respiratory organs (cancer of) | 6.2 | 11.7 |
Ovarian cancer | 3.8 | 4.9 |
Ovarian cancer and serous carcinomas of the fallopian tube | 3.5 | 4.4 |
Overlapping and unspecified sites in biliary tract (cancer of) | 0.7 | 1.4 |
Overlapping and unspecified sites in urinary tract (cancer of) | 0 | 0.7 |
Pancreatic cancer | 2.8 | 1.9 |
Parotid gland cancer | 6.9 | 10.6 |
Penile cancer | 5.1 | 6.1 |
Peripheral nerves and autonomic nervous system (cancer of the) | 8.1 | 9.2 |
Prostate cancer | 6.2 | 5.3 |
Rare and less common cancers (2025) combined | 5.9 | 8.7 |
Rare cancers (2025) | 6.1 | 7.2 |
Rectal cancer (excluding rectosigmoid junction) | 3.5 | 3.6 |
Rectal cancer (including rectosigmoid junction) | 3.4 | 3.5 |
Rectosigmoid junction cancer | 3 | 3 |
Renal pelvis cancer | 1.8 | 2 |
Retroperitoneal and peritoneal cancer | 1.8 | 3.1 |
Sinuses cancer | 1.6 | 3.8 |
Small intestine cancer | 5.7 | 5.8 |
Soft tissue sarcoma | 9.5 | 11.7 |
Stomach cancer | 4 | 4.4 |
Submandibular gland cancer | 5.3 | 9 |
Testicular cancer | 6.3 | 6 |
Thyroid cancer | 7.3 | 8.4 |
Tongue cancer | 4.6 | 5.1 |
Unknown primary site (cancer of) | 5.6 | 3.3 |
Ureteral cancer | 1.1 | 2 |
Urethral cancer | 1.4 | 1.6 |
Uterine cancer | 4.4 | 3.9 |
Vaginal cancer | 2.8 | 4.3 |
Vulvar cancer | 5.7 | 5.7 |
Source: AIHW Australian Cancer Database 2021
About the imputation method
The imputation method get the count of First Nations and non-Indigenous records by 5-year age group, sex and 5-year period. These counts are provided for each cancer and each socio-economic disadvantage quintile (SEIFA).
Once this is done, the proportion of records which are First Nations and non-Indigenous are calculated for each cancer, SEIFA, sex, 5-year age group. The unknown Indigenous status records are similarly categorised with the exception that years are used instead of 5-year period. The corresponding rate of known Indigenous status is applied to the unknown Indigenous status.
Age-group, SEIFA and cancer type are all critical to help derive Indigenous status. First Nations people are, on average, younger. First Nations people are also over-represented within the more disadvantaged areas and over or underrepresentation can occur, depending on the cancer type.
Table 2a provides some examples of First Nations imputation rates (that is, the percentage of records with complete Indigenous status that are records of First Nations people. This rate is then applied to the records with unknown Indigenous status to estimate the number of records of these that are First Nations people).
First Nations people accounted for around 3.8% of the Australian population in 2021. For all cancers combined, the First Nations imputation rate decreases with age. This will be influenced by the younger age-structure for First Nations people. For all cancers, the imputation rate is higher for SEIFA quintile 1. This will be influenced by First Nations people being over-represented in areas of greater socio-economic disadvantage (Table 2a).
Lung cancer rates are much higher for First Nations people and this sees the First Nations imputation rate much higher than all cancers combined for the 50 to 54 age group. Even with higher rates of lung cancer in general, the imputation rate for First Nations people 85 years and older remains low because of fewer First Nations people reaching these ages. Melanoma of the skin has lower rates of cancer for First Nations people and sees comparatively low imputation rates for First Nations people (Table 2a).
Table 2a: Imputation rate, First Nations people, by selected cancers, 2017–2021
Cancer | Age group | First Nations Imputation rate SEIFA quintile 1 | First Nations Imputation rate SEIFA quintile 5 |
All cancers combined | 0 to 4 years | 13.0% | 1.5% |
All cancers combined | 50 to 55 years | 7.5% | 0.8% |
All cancers combined | 85 years and older | 0.9% | 0.2% |
Lung cancer | 50 to 55 years | 13.3% | 2.0% |
Lung cancer | 85 years and older | 1.0% | 0.2% |
Melanoma of the skin | 50 to 55 years | 2.1% | 0.7% |
Melanoma of the skin | 85 years and older | 0.1% | Less than 0.1% |
Notes
1. The rate of First Nations imputation rate is the rate at which records with unknown Indigenous status will have Indigenous status as derived as First Nations.
Source: AIHW Australian Cancer Database 2021