


Melanoma of the skin in Australia
Cancer data commentary number 14
This commentary discusses incidence, mortality and survival rates and trends for melanoma of the skin, including insights by age, histology, social and economic disadvantage, and by remoteness areas. Trends by primary tumour stage (I and II only, derived from Breslow’s thickness and the presence or absence of ulceration) have also been explored.
What is melanoma of the skin?
Melanoma of the skin is a type of cancer that develops from cells in the skin called melanocytes, which give colour to the skin through the production of the pigment melanin. Melanoma can appear on the skin as a new mole or an existing mole that changes shape, colour, or size. Among commonly diagnosed skin cancers, melanoma is the deadliest type due to its susceptibility to metastases (Cancer council Australia, 2023).
Exposure to ultraviolet (UV) radiation is the main risk factor for melanoma of the skin and people with fairer skin are at greater risk. While melanoma may occur in other sites of the body, for convenience, melanoma of the skin has been abbreviated to ‘melanoma’ for the remained of the commentary.
Melanoma is a significant health issue in Australia:
Australia has one of the highest incidences of melanoma in the world. In 2025, there were an estimated 17,400 new cases of melanoma in Australia.
People born in Australia have higher melanoma incidence rates than people living in Australia who were born overseas (51 vs. 17 cases per 100,000 people for 2007–2021). In 2007–2021 in Australia, melanoma incidence rates were highest for people born in Australia, New Zealand and South Africa (51, 48 and 35 cases per 100,000 people respectively) and lowest for people born in India, Mauritius, Hong Kong and Lebanon (2.5, 2.6, 2.8 and 2.8 cases per 100,000 people respectively).
Please note that the rates from the above paragraphs are standardised to the World Health Population while, for the remainder of the report, age standardised rates are standardised to the 2025 Australian population unless otherwise stated. A more complete range of Australian melanoma incidence rates by country of birth are available in the Cancer incidence by country of birth data visualisation.
The incidence of melanoma has increased steadily over time:
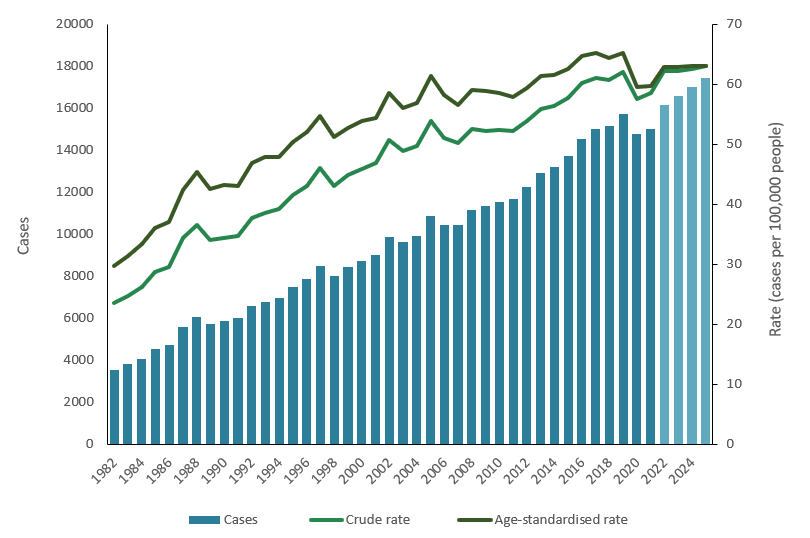
Since 1982, there has been a steady increase in the incidence of melanoma. During this time, the number of new cases more than quadrupled (from 3,600 to an estimated 17,400 in 2025) and the crude incidence rate more than doubled (from 24 to an estimated 63 cases per 100,000 people).
Melanoma case increases are partly attributable to the increase in the Australian population size, while crude incidence rates are influenced by the ageing population. As with most cancer types, melanoma is more common in older age. As life expectancy rises, proportionally more people are living to older ages, where there is a greater risk of developing melanoma.
When adjusted for age, melanoma incidence rates have also increased over time. Between 1982 and 2025, the age-standardised rate increased from 30 cases per 100,000 people to an estimated 63 cases per 100,000 people. Since 2016, however, age-standardised rates have become more stable. Lower incidence rates occurred for several cancers in 2020, including melanoma, which may be related to reduced access to medical services during the COVID-19 pandemic (Figure 1).
Figure 1: Melanoma incidence counts and rates, persons, all ages, 1982–2025:
Notes
- Values for 2022 to 2025 are projections
- Age-standardised rates are standardised to the 2025 Australian population
Source: AIHW Australian Cancer Database 2021
Uncertainties in projected melanoma incidence rates:
In 2020 and 2021, melanoma incidence cases and rates were considerably lower when compared to incidence counts and rates in the preceding years. In 2021, the incidence rate of melanoma was 8.4% lower than the rate in 2019 (60 vs 65 per 100,000 people). Similar trends have been observed across the world - reductions in newly diagnosed melanomas during the COVID-19 era were also observed in other countries including the United Kingdom, Belgium, Chile, Italy and Brazil (Mostafavi Zadeh et al. 2025).
The COVID-19 pandemic significantly disrupted healthcare systems. Service providers in Australia recorded substantial reductions in procedures related to skin cancer investigation and treatment during this time (Thomas et al. 2024), which contributed to a reduction in melanomas diagnosed. Between 2020 and 2022, several lockdown periods were also implemented in Australia as part of pandemic control. Restrictions on activities outside the home may have reduced sun exposure during this period (Clayton et al. 2023) or disrupted health-seeking behaviours like regular skin cancer checks (Mostafavi Zadeh et al. 2025), with potential implications for melanoma incidence and diagnosis.
The immune system plays a critical role in controlling tumour progression of melanoma and immunotherapy forms a central part of care for many patients with melanoma (Passarelli et al. 2017). Early research indicates that SARS-CoV-2 mRNA vaccines may impact the development and progression of melanoma through its effects on the immune system, which may promote antitumour activity (Bafaloukos et al. 2022; de Sousa et al. 2022; Grippin et al. 2025). However, further research into these effects is needed on a larger scale.
Over the next few years, it is uncertain whether trends in the incidence of melanoma will increase back to pre-pandemic levels or will remain lower. The projected incidence rates included in this report are currently estimated between the lower rates observed in 2020 and 2021 and the higher rates observed in the years from 2016 to 2019 but have considerable uncertainty. Projections should, therefore, be interpreted with caution.
Melanoma is more commonly diagnosed among males:
Males have higher rates of melanoma than females. In 2025, an estimated 10,187 cases will be diagnosed among males, and an estimated 7,256 cases will be diagnosed among females — equivalent to an estimated age-standardised incidence rate of 78 cases per 100,000 males and 50 cases per 100,000 females.
Since 1982, the incidence of melanoma has increased among both males and females but has increased more substantially among males (Figure 2). In 1982, male incidence rates were 3.4 cases per 100,000 higher than female incidence rates (32 cases per 100,000 males vs. 29 cases per 100,000 females). By 1995, the rates for males were 20 cases per 100,000 higher than the rates for females. The greatest disparity between the sexes occurred in 2017 with a difference of 31 cases per 100,000 (82 cases per 100,000 males vs. 51 cases per 100,000 females).
Figure 2: Melanoma incidence counts and age-standardised rates by sex, all ages, 1982–2025: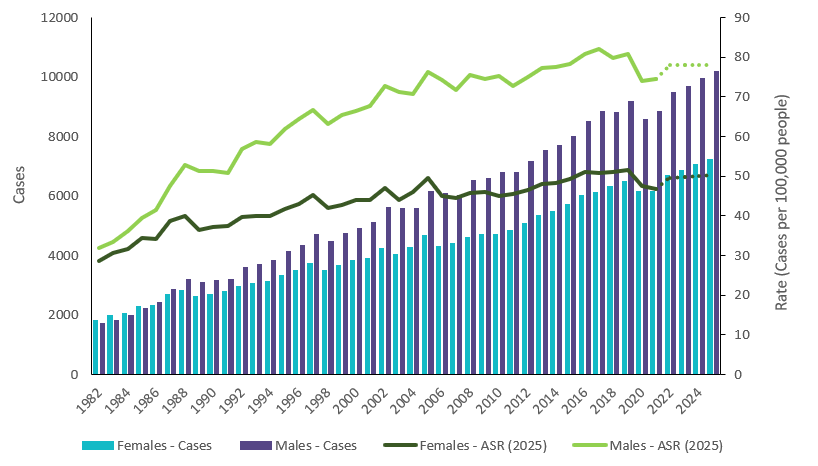
Notes
- Values for 2022 to 2025 are projections.
- Age-standardised rates are standardised to the 2025 Australian population.
Source: AIHW Australian Cancer Database 2021
Melanoma incidence rates increase with age:
Most cancers occur predominantly in the older populations. While melanoma of the skin is one of the most common cancer types diagnosed among adolescents and young adults and historically impacts younger people more than most other cancers, the incidence rate of melanoma is much higher among older populations.
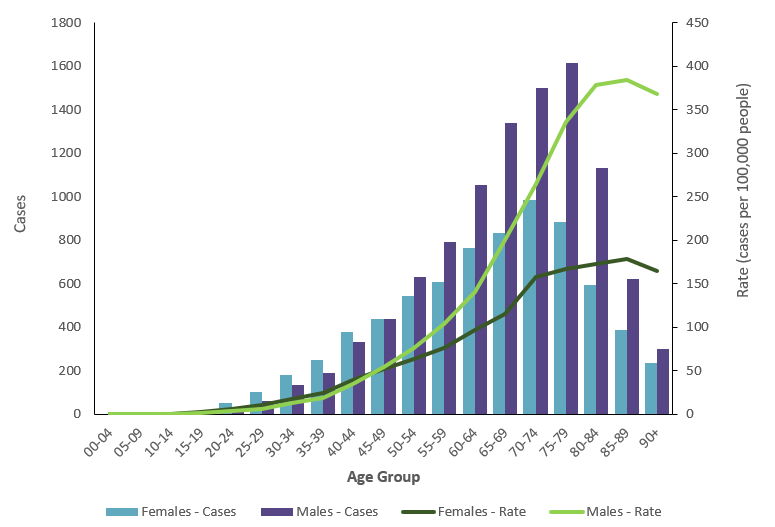
To help illustrate the impact of age on melanoma incidence, in 2025, the age-specific incidence rate for 15-19 years olds is estimated to be 1.8 cases per 100,000 people. The rate for the 35-39 age group is estimated to be more than ten times higher at 22 cases per 100,000 people. The rate for the 75-79 age group is estimated to be ten times greater again at 247 cases per 100,000 people (Figure 3).
In 2025, it is estimated that around 40 cases of melanoma will be diagnosed in individuals under 20 years old, accounting for less than 1% of all cases of melanoma estimated for that year. In the same year, approximately 12,200 cases (70%) are estimated to be diagnosed among individuals aged 60 and older.
Females have slightly higher rates of melanoma than males in younger age groups (0–39) and males had much higher rates of melanomas than females in older age groups (50 and older) (Figure 3).
Figure 3: Melanoma incidence counts and rates by age group and sex, 2025:
Notes
- Values for 2025 are projections.
- Rates are age-specific.
Source: AIHW Australian Cancer Database 2021
Trends in melanoma incidence over time vary across age groups:
Over time, trends in melanoma incidence have emerged differently across age groups.
Melanoma incidence has decreased in younger age groups:
Over time, there has been a gradual decline in the rate of new melanoma cases among individuals aged 0–39 (Table 1). From 1982 to 2025, the incidence of melanoma among 0–39-year-olds decreased from 10.2 to 7.2 cases per 100,000 people. Among this population, the incidence rate first increased to 12.5 cases per 100,000 people in 2005, before subsequently declining to an estimated 7.2 cases per 100,000 people between 2005 and 2025.
Declining incidence rates are being observed among populations that grew up during long-running public education campaigns on the effects of sun exposure, including the 'Slip-Slop-Slap’ campaign of the 1980s, which aimed to improve public awareness of melanoma and its prevention through sun-safe behaviours. Other contributing factors may include changes in the use of solariums (indoor tanning devices) over time (Whitman et al. 2024; Rodriguez-Acevedo et al. 2020), and widespread lifestyle changes such as population-level reductions in childhood outdoor activities and increased time spent indoors (Whitman et al. 2024; Australian Institute of Family Studies, 2024).
While melanoma is more commonly diagnosed in older populations, melanoma has higher incidence rates for younger populations when compared to most other cancer types. In 1997, melanoma of the skin was the most diagnosed cancer type for people under the age of 40 years (14.7 cases per 100,000 people) with the next most common cancer type being breast cancer (6.3 cases per 100,000 people). In 2025, melanoma is estimated to be the second most common cancer among people under the age of 40 years old, following colorectal cancer (7.2 and 7.3 cases per 100,000 people, respectively). Breast cancer for the under 40s population is also estimated to be 7.2 cases per 100,000 people in 2025 and thyroid cancer is next most common at 7.1 cases per 100,000 people.
Melanoma incidence has increased in older age groups:
Since 1982, there has been an increase in the rate of new melanoma cases among individuals aged 40 and over (Table 1). From 1982 to 2025, the incidence of melanoma among this population increased from 48 to 124 cases per 100,000 people. The rate of change has slowed substantially over time, however. Between 1982 and 2005, the incidence among individuals aged 40 and older increased by 116% — from 48 to 104 cases per 100,000 people. The rate of increase slowed but still increased by 19% between 2005 and 2025 — from 104 to 124 cases per 100,000 people.
The median age at diagnosis with melanoma has also increased over time — from 53 years of age in 1982 to 68 years in 2021. The increase is influenced by the ageing population, rising incidence rates in older populations and the decreasing rates in younger populations. Over the same period, the increase in the median age at diagnosis for all cancers combined was much smaller (66 to 69 years of age).
The increases seen in melanoma incidence among older age groups contrasts with the decreases observed in younger age groups. Incongruent trends across age groups may partially be explained by younger populations living a greater proportion of their lives in an environment where skin cancer awareness has been greater.
Table 1: Melanoma incidence rates by age group, 1982 to 2025:
| Age group (years) | 1982 | 1995 | 2005 | 2015 | 2025 | Change 1982 to 2005 | Change 2005 to 2025 | Change 1982 to 2025 |
|---|---|---|---|---|---|---|---|---|
| 00–09 | 0.1 | 0.1 | 0.2 | 0.0 | 0.0 | 100% | -100% | -100% |
| 10–19 | 3.0 | 4.5 | 2.4 | 0.9 | 1.2 | -20% | -50% | -60% |
| 20–29 | 13.8 | 18.6 | 15.4 | 9.4 | 6.5 | 12% | -58% | -53% |
| 30–39 | 25.2 | 32.7 | 30.1 | 22.6 | 18.4 | 19% | -39% | -27% |
| 40–49 | 36.9 | 48.9 | 52.5 | 48.1 | 44.6 | 42% | 15% | 21% |
| 50–59 | 45.0 | 71.5 | 84.1 | 79.5 | 79.4 | 87% | -6% | 76% |
| 60–69 | 57.4 | 105.1 | 131.1 | 140.5 | 136.2 | 128% | 4% | 137% |
| 70–79 | 62.3 | 130.6 | 180.6 | 209.9 | 225.9 | 190% | 25% | 263% |
| 80–89 | 58.1 | 142.9 | 211.3 | 239.5 | 267.6 | 264% | 27% | 361% |
| 90+ | 59.8 | 98.9 | 200.1 | 222.5 | 238.0 | 235% | 19% | 298% |
| All ages | 23.5 | 41.6 | 53.9 | 57.7 | 63.1 | 129% | 17% | 169% |
Notes:
- Values for 2022 to 2025 are projections.
- Rates are age-specific and crude rates are reported for all ages.
Source: AIHW Australian Cancer Database 2021
Melanoma rates may be lower for people born in the 1970s and 1980s
Data visualisation 1 provides melanoma incidence rates for different age groups, by year of birth. The information provides a basic exploration of possible melanoma cohorts.
For the under 40 age groups, melanoma incidence rates generally stabilise for people born in the 1970s and start decreasing for people born in the 1980s onwards.
Considering the older age groups, melanoma rates progressively increase for people born in the 1920s, 1930s and 1940s, but appear to slow as people born in the 1950s and 1960s enter these age groups.
Please note that 2020 and 2021 data is excluded from the data analysis in Data visualisation 1 because the rates deviate from those of the past, which may be due to impacts of the COVID-19 pandemic. Similarly, the over 90 age group is excluded as the median year of birth may not be a consistent approximation.
Data visualisation 1: Melanoma incidence rates by age and year of birth, by sex
This visualisation shows melanoma of the skin incidence by 5-year age group and year of birth. It supports analysis of birth cohorts that may have different incidence rates and influence trends as they age. All data are available in Excel in the Data section of this report.

Melanoma incidence varies across regions of Australia:
Trends in melanoma incidence varied between the states and territories. In 2021, the age-standardised incidence rate ranged between 45 cases per 100,000 people in South Australia and Victoria to 79 cases per 100,000 people in Queensland.
Historically, melanoma incidence rates in Queensland have been higher than the national rate (Figure 4). This may be due to various factors, including a higher risk environment in Queensland compared to other states and territories. Exposure to ultraviolet radiation is the main risk factor for melanoma.
Melanoma incidence rates in the Northern Territory have historically been lower than the national rate (Figure 4). In recent years, however, the incidence of melanoma in the Northern Territory has increased substantially – rising by 42% between 2011 and 2021. During the same period of time, the national rate rose by 3.3% and the difference in melanoma incidence between the Northern Territory and the national rate has, therefore, reduced over the last decade. In 2021, the incidence rate of melanoma in the Northern Territory was comparable to the national rate (58 vs. 60 cases per 100,000 people, respectively).
Figure 4: Melanoma age-standardised incidence rates for Queensland, Northern Territory and Australia, Persons, 1986–2021: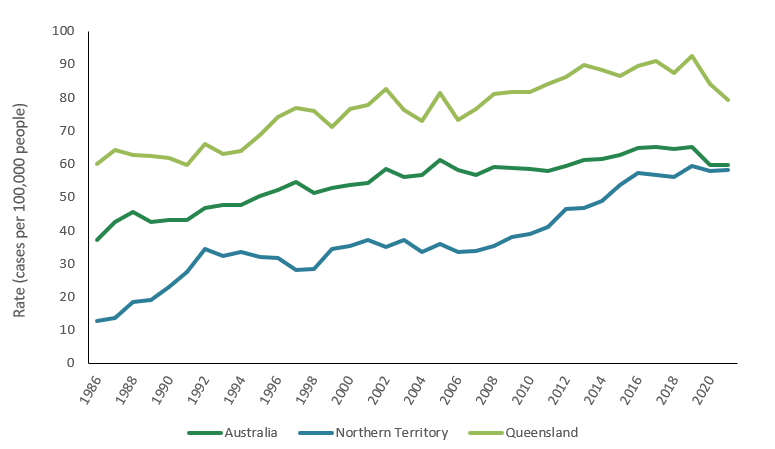
Notes
- Age-standardised rates are standardised to the 2025 Australian population.
Source: AIHW Australian Cancer Database 2021
Melanoma incidence can vary significantly within jurisdictions:
Melanoma incidence not only varies significantly between the states and territories but also varies significantly within these jurisdictions. Variations within jurisdictions may be driven by geographical variations in individual-level risk factors, population characteristics, and patterns of exposure to ultraviolet radiation.
Statistical Areas Level 3 (SA3s) are geographic regions in Australia used for statistical purposes. In 2017–2021, the age-standardised incidence rate of melanoma across SA3s ranged from 121 cases per 100,000 persons (Coolangatta) to 15 cases per 100,000 persons (Fairfield) (Tables 2 and 3).
Proximity to the coast may be associated with higher incidence of melanoma. In 2017–2021, among the 10 SA3s with the highest incidence rates across Australia, seven SA3s included coastal regions. Comparatively, none of the 10 SA3s with the lowest incidence rates across Australia were coastal SA3s. Figure 5, a map of Australia from the Australian Cancer Atlas, provides a view of the concentration of coastal regions of NSW and Queensland, with higher rates than the national average (Figure 5). Differences in lifestyle characteristics, demographic factors, and ultraviolet radiation exposure between coastal and non-costal populations may contribute to higher incidence of melanoma in coastal SA3s.
Figure 5: Melanoma incidence rates compared to the Australian average, 2019: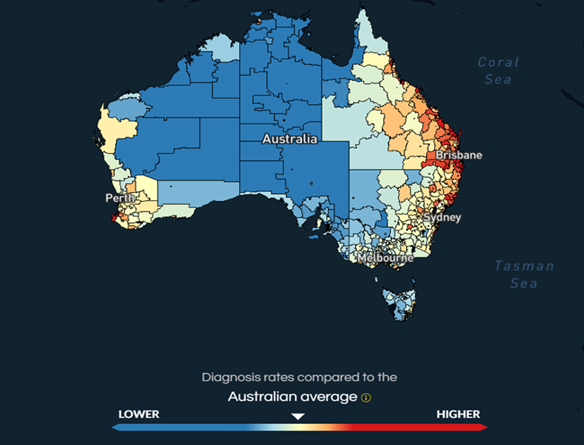
Source: Australian Cancer Atlas 2019
Table 2: 10 highest Statistical Areas Level 3 (SA3s) for melanoma incidence, age-standardised rates (2025 Australian population), persons, 2012–2016 to 2017–2021:
| Rank | 2012–2016 | Rate (per 100,000 persons) | 2017–2021 | Rate (per 100,000 persons) |
|---|---|---|---|---|
| 1 | Broadbeach – Burleigh (QLD) | 125.4 | Coolangatta (QLD) | 121.4 |
| 2 | Coolangatta (QLD) | 121.8 | Broadbeach – Burleigh (QLD) | 116.4 |
| 3 | Richmond Valley – Coastal (NSW) | 119.5 | Richmond Valley – Coastal (NSW) | 114.5 |
| 4 | Clarence Valley (NSW) | 112.8 | Cronulla – Miranda - Caringbah (NSW) | 111.7 |
| 5 | Tweed Valley (NSW) | 106.7 | Port Macquarie (NSW) | 107.5 |
| 6 | Kenmore – Brookfield – Moggill (QLD) | 105.6 | Richmond Valley - Hinterland (NSW) | 104.8 |
| 7 | The Gap – Enoggera (QLD) | 104.1 | Cairns – North (QLD) | 103.8 |
| 8 | Darling Downs – East (QLD) | 103.5 | Brisbane Inner – West (QLD) | 103.1 |
| 9 | Cairns – North (QLD) | 100.6 | Ipswich Hinterland (QLD) | 102.7 |
| 10 | Wynnum – Manly (QLD) | 100.2 | Clarence Valley (NSW) | 101.9 |
Notes:
- Italicised SA3s include coastal areas.
Source: AIHW Australian Cancer Database 2021
Table 3: 10 lowest Statistical Areas Level 3 (SA3s) for melanoma incidence, age-standardised rates (2025 Australian population), persons, 2012–2016 to 2017–2021:
| Rank | 2012–2016 | Rate (per 100,000 persons) | 2017–2021 | Rate (per 100,000 persons) |
|---|---|---|---|---|
| 1 | Auburn (NSW) | 13.4 | Fairfield (NSW) | 14.9 |
| 2 | Fairfield (NSW) | 17.4 | Brimbank (VIC) | 16.7 |
| 3 | Brimbank (VIC) | 20.8 | Auburn (NSW) | 17.8 |
| 4 | Canterbury (NSW) | 21.8 | Dandenong (VIC) | 19.9 |
| 5 | Maribyrnong (VIC) | 22.3 | Canterbury (NSW) | 20.7 |
| 6 | Dandenong (VIC) | 23.2 | Tullamarine – Broadmeadows (VIC) | 21.1 |
| 7 | Tullamarine – Broadmeadows (VIC) | 24.8 | Darebin - North (VIC) | 25.4 |
| 8 | Darebin - North (VIC) | 25.4 | Moreland – North (VIC) | 26.0 |
| 9 | Strathfield – Burwood – Ashfield (NSW) | 25.8 | Merrylands - Guildford (NSW) | 28.5 |
| 10 | Whittlesea – Wallan (VIC) | 29.2 | Blacktown (NSW) | 29.7 |
Source: AIHW Australian Cancer Database 2021
Trends by remoteness area:
Remoteness areas divide Australia into broad geographical regions that share characteristics of remoteness for statistical purposes. The Australian Statistical Geography Standard (ASGS) Remoteness Structure defines 5 classes of relative geographic remoteness in Australia: Major Cities, Inner Regional, Outer Regional, Remote, and Very Remote.
Melanoma incidence varies across these remoteness areas (Table 4). In 2017–2021, age-standardised incidence rates ranged between 78.3 cases per 100,000 people in Inner Regional areas of Australia and 55.3 cases per 100,000 people in Remote and Very Remote areas.
Table 4: Crude and age-standardised incidence rates for melanoma, by remoteness areas, 2017–2021
| Remoteness area | Cases | Crude rate (per 100,000 persons) | Age-standardised rate (per 100,000 persons) |
|---|---|---|---|
| Major cities | 47,377 | 52.1 | 57.5 |
| Inner regional | 19,397 | 86.5 | 78.3 |
| Outer regional | 7,760 | 75.1 | 70.3 |
| Remote and very remote | 1,100 | 44.6 | 55.3 |
| Australia | 75,635 | 59.9 | 62.7 |
Note:
- Age-standardised rates are standardised to the 2025 Australian population
Source: AIHW Australian Cancer Database 2021
First Nations people comprise around 41% and 15% of the population living in Very Remote and Remote areas of Australia, respectively (ABS, 2021). In comparison, First Nations people comprise 1.8% of the population living in Major Cities (ABS, 2021). The relatively low incidence of melanoma among First Nations people likely contributes to lower incidence rates in Remote and Very Remote areas.
Inner Regional areas of Australia often encompass coastal regions (Figure 6). As discussed earlier, incidence rates for melanoma in coastal regions were generally higher than the national average, which may contribute to the higher incidence observed in Inner Regional areas.
Figure 6: Map of ASGS Edition 3 Remoteness Areas for Australia: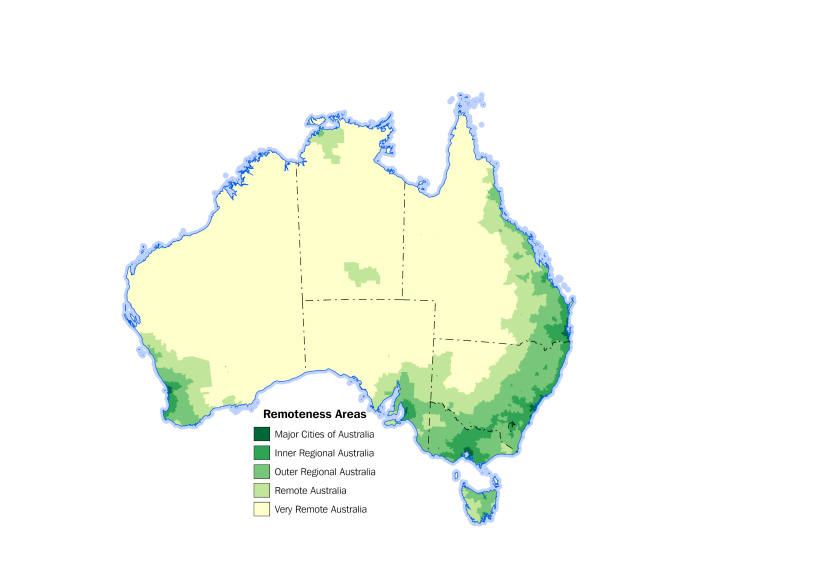
Source: Remoteness Areas | Australian Bureau of Statistics
The least disadvantaged population has the highest melanoma rates
The Index of Relative Socio-Economic Disadvantage (IRSD) is a general socioeconomic index that summarises information about the economic and social conditions of people and households within an area based on factors such as average household income, education levels, and unemployment rates. It is an area-based measure of relative socioeconomic disadvantage and is used as a proxy for the socioeconomic disadvantage of participants living in those areas. Consequently, it may not reflect the individual status of each person or household within that area.
Socioeconomic quintile 1 represents people living in areas with the greatest socioeconomic disadvantage according to the Index of Relative Socio-Economic Disadvantage (that is, the lowest socioeconomic area), and quintile 5 represents people living in the highest socioeconomic areas.
In 2017–2021, the age-standardised incidence rate for melanoma was highest among individuals living in areas of least socioeconomic disadvantage (69 cases per 100,000 people). The lowest incidence rate was observed for individuals living in areas of most socioeconomic disadvantage (56 cases per 100,000 people).
Most of the difference across socioeconomic quintiles is attributable to differences in the incidence of melanomas with a Breslow thickness less than 1mm (Figure 7). As socioeconomic disadvantage increased, the incidence rate of thin melanomas (<1mm) decreased – from 47 cases per 100,000 people in Quintile 5 to 34 cases per 100,000 people in Quintile 1. However, individuals living in lower socioeconomic areas were more likely to be diagnosed with a thick melanoma (>4mm) when compared to individuals living in the highest socioeconomic areas (4.8 cases per 100,000 people and 3.9 cases per 100,000 people, respectively). Individuals living in higher socioeconomic areas may be more likely to have regular skin checks, which would lead to earlier detection of melanoma and contribute to improved health outcomes.
Figure 7: Age-standardised incidence rates for melanoma, by SEIFA quintile and Breslow thickness, 2017–2021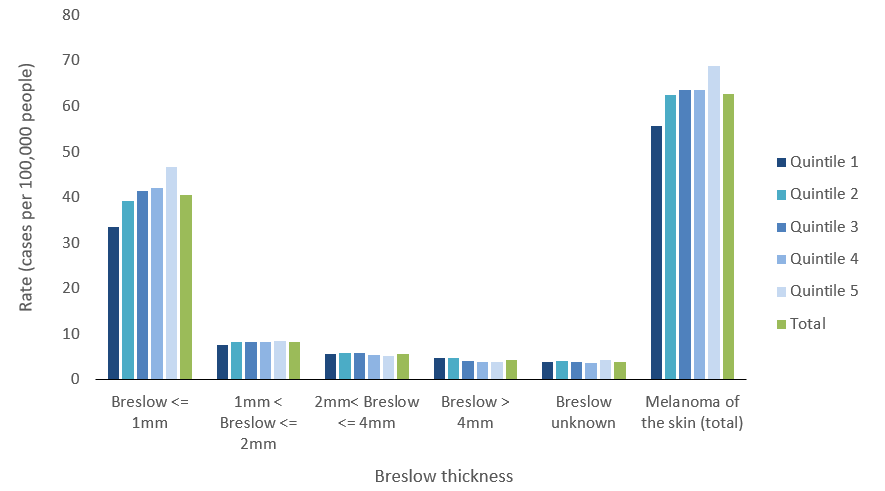
Note:
- Age-standardised rates are standardised to the 2025 Australian population
Source: AIHW Australian Cancer Database 2021
Most melanomas are diagnosed at an early primary tumour stage:
The melanoma staging system published by the American Joint Committee on Cancer (AJCC) categorises the primary tumour (the original, or first, tumour in the body) based on its Breslow thickness and ulceration status, whether it involves local lymph nodes, and whether there is distant metastasis to other organs.
Breslow thickness measures how deeply a melanoma has grown into the layers of skin and is measured from the surface of the skin to the deepest point of the tumour. The AJCC melanoma staging system stratifies tumours of varying thickness into different primary tumour categories, frequently referred to as ‘T-categories’.
Melanomas with a Breslow thickness less than or equal to 1.0mm are classified as T1 melanomas. T2 and T3 melanomas are 1.1–2.0mm and 2.1–4.0mm thick, respectively. T4 melanomas have a thickness greater than 4.0mm.
Each T-category can be further broken down based on the presence or absence of ulceration. Ulceration refers to the breakdown of the skin on top of the melanoma. Ulcerated melanomas have a greater risk of metastasis (Barricklow et al. 2022) and so, are staged higher than tumours without ulceration (Table 4).
Table 5: AJCC Primary Tumour Categories (T-Categories), rates and counts, 2021:
| T-category | Breslow thickness (mm) | Ulceration status | Counts | Crude rate (per 100,000 persons) |
|---|---|---|---|---|
| T1 | ≤ 1.0 | Unknown | 6,355 | 24.7 |
| T1a | < 0.8 | Without ulceration | 2,737 | 10.7 |
| T1b | < 0.8 | With ulceration | 52 | 0.2 |
| T1b | 0.8 – 1.0 | Without ulceration | 433 | 1.7 |
| T1b | 0.8 – 1.0 | With ulceration | 29 | 0.1 |
| T2 | 1.1 – 2.0 | Unknown | 1,362 | 5.3 |
| T2a | 1.1 – 2.0 | Without ulceration | 455 | 1.8 |
| T2b | 1.1 – 2.0 | With ulceration | 120 | 0.5 |
| T3 | 2.1 – 4.0 | Unknown | 969 | 3.8 |
| T3a | 2.1 – 4.0 | Without ulceration | 223 | 0.9 |
| T3b | 2.1 – 4.0 | With ulceration | 169 | 0.7 |
| T4 | > 4.0 | Unknown | 820 | 3.2 |
| T4a | > 4.0 | Without ulceration | 128 | 0.5 |
| T4b | > 4.0 | With ulceration | 187 | 0.7 |
Source: AIHW Australian Cancer Database 2021
Breslow thickness was known for 14,039 melanomas diagnosed in 2021. Of these melanomas, 9,606 (68.4%) were diagnosed at a T1 stage, 1,937 (13.8%) at a T2 stage, 1,361 (9.7%) at a T3 stage, and 1,135 (8.1%) were diagnosed at a T4 stage. The median tumour thickness at diagnosis was 0.60mm.
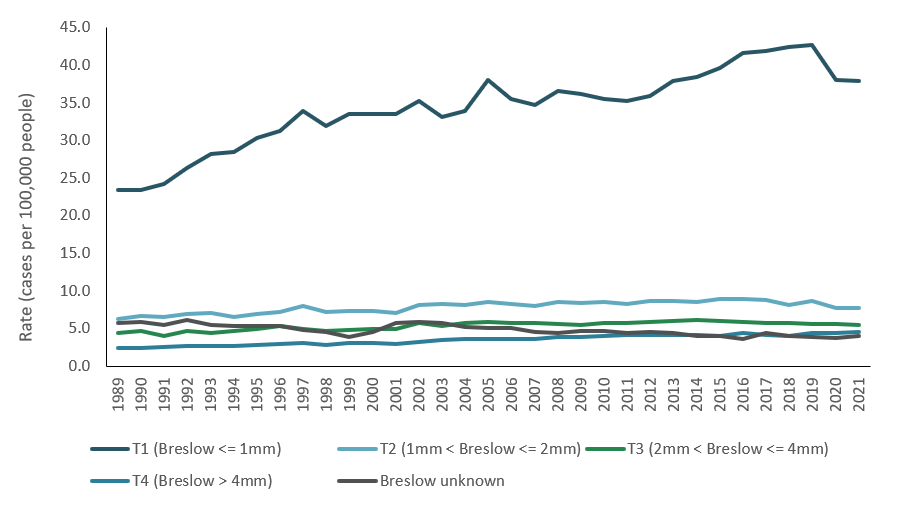
Increases in melanoma incidence over time are primarily being driven by an increase in thin melanomas (Figure 8). Between 1989 and 2021, the age-standardised incidence rate of T1 melanomas increased from 23.5 to 37.9 cases per 100,000 people. During the same period, the incidence rate increased from 6.3 to 7.7 cases per 100,000 people for T2 melanomas, from 4.5 to 5.5 cases per 100,000 people for T3 melanomas, and from 2.4 to 4.6 cases per 100,000 people for T4 melanomas.
Ulceration status was known for 4,562 melanomas diagnosed in 2021. Of these melanomas, 562 (12.3%) showed signs of ulceration while 4,000 melanomas (87.7%) had no ulceration present. Ulceration was more likely to occur with increased Breslow thickness. In 2021, the median thickness for non-ulcerated melanomas was 0.5mm compared to 2.9mm for ulcerated melanomas. The median thickness for melanomas where the ulceration status was unknown was 0.4mm.
Other factors associated with Breslow thickness included patient age and diagnosis with nodular melanoma. Patient age at diagnosis increased progressively with Breslow thickness. In 2021, the median age at diagnosis was 66 years old for T1 melanoma, increasing to 69 years for T2 melanomas, 74 years for T3 melanomas, and 77 years for T4 melanomas. Diagnosis with nodular melanoma was also associated with increased tumour thickness. In 2021, the median thickness for nodular melanoma was 3.0mm compared to 0.6mm for low cumulative sun damage melanoma (previously called superficial spreading melanoma).
Figure 8: Melanoma age-standardised incidence rates by year and Breslow thickness, persons, 1982–2021:
Note:
- Age-standardised rates are standardised to the 2025 Australian population
- Data starts from 1989 due to a high proportion of data being unknown prior to this year
Source: AIHW Australian Cancer Database 2021
Among males, the highest melanoma incidence rates are for the trunk of the body, for females it is the upper limbs
Melanomas are most commonly diagnosed on the trunk (the part of the body that contains the chest, abdomen, pelvis, and back). In 2025, an estimated 5,863 melanomas will be diagnosed on the trunk (33.6%). In the same year, an estimated 4,598 melanomas will be diagnosed on the upper limbs (26.4%), 3,220 cases will be diagnosed on the lower limbs (18.5%), and 3,005 cases will be diagnosed on the head or neck (17.2%).
Melanomas are diagnosed most frequently on the trunk in males and most frequently on the upper or lower limbs in females (Table 5). In 2025, it is estimated that 32.9% of melanomas diagnosed among women will be on the upper limbs, 25.8% will be diagnosed on the trunk, and 25.2% will be diagnosed on the lower limbs. Comparatively, 39.2% of melanomas estimated to be diagnosed among men will be on the trunk while 21.7% and 13.7% of melanomas are estimated to be diagnosed on the upper and lower limbs, respectively.
Table 6: Proportion of melanomas according to anatomical site, 2025:
| Tumour site | Males | Females | ||
|---|---|---|---|---|
Frequency | % | Frequency | % | |
| Trunk | 3,989 | 39.2 | 1,874 | 25.8 |
| Upper limbs | 2,212 | 21,7 | 2,386 | 32,9 |
| Lower limbs | 1,393 | 13.7 | 1,827 | 25.2 |
| Head and neck | 2,073 | 20.3 | 932 | 12.8 |
| Overlapping or unspecified melanoma | 520 | 5.1 | 237 | 3.3 |
| Total | 10,187 | 100.0 | 7,256 | 100.0 |
Notes:
- Data for 2025 is projected.
Source: AIHW Australian Cancer Database 2021
Recent increases in melanoma incidence have not been accompanied by increases in mortality
Deaths from melanoma experienced an upward trend until reaching its peak of approximately 1,600 deaths in 2013. By 2025, it is estimated there will be around 1,450 deaths from melanoma. While melanoma incidence rates have been increasing up to 2020, melanoma mortality rates have been declining since 2011. In 2011, the age-standardised mortality rate of melanoma peaked at 8.1 deaths per 100,000 people. By 2025, the mortality rate is estimated to have declined to 5.3 deaths per 100,000 people.
Reducing mortality rates may reflect improvements in early detection of melanoma and advancements in treatment options (Lapides et al. 2023).
Figure 9: Melanoma of the skin, age-standardised mortality rates, persons, all ages: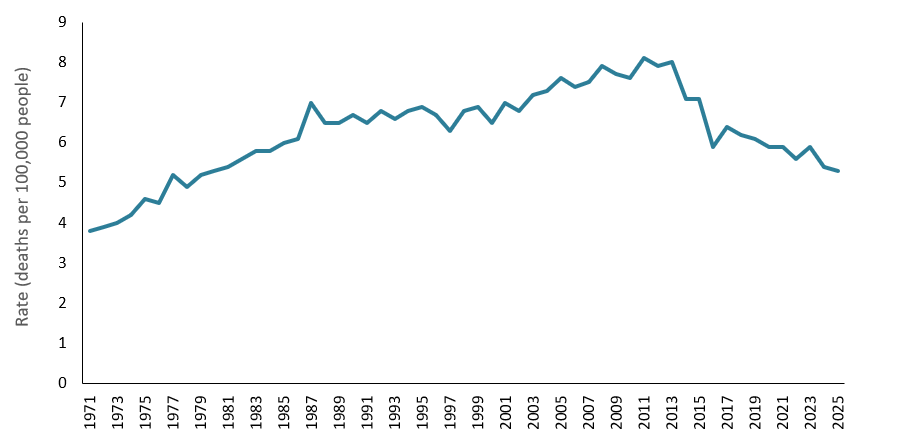
Notes:
- Rates are standardised to the 2025 Australian population.
- Values for 2024 and 2025 are projections.
Source: National Mortality Database
Melanoma survival is high:
In 2017–2021, 5-year relative survival for melanoma was 94% across all age groups. This means that, from the time of diagnosis, people diagnosed with melanoma had a 94% chance of surviving for at least 5 years compared with their counterparts in the general population.
While melanoma survival is generally high, survival can vary by factors like tumour thickness, the presence of ulceration, age, sex, histological type, and anatomical site.
Melanoma survival varies by age and sex:
The 5-year relative survival for melanoma decreases slightly in older age. In 2017–2021, the 5-year relative survival for melanoma was between 96% and 98% for age groups under 60 years of age. Survival decreased from 96% for people aged 60–64 to 93% for people aged 75–79. From here survival decreased more quickly but still remained comparatively high compared to most other cancer types (87% for 80–84 years and 82% for 85 years and older). Lower melanoma survival rates in older age groups may arise from several factors, including stage at diagnosis, potential comorbidity, and amenability to treatment (Ribero et al. 2018).
Melanoma survival also varies by sex. In 2017–2021, females had a slightly higher 5-year relative survival for melanoma when compared to males (96% vs 93%).
Tumour thickness, ulceration, histological type, and primary tumour site are important prognostic risk factors for melanoma:
The 5-year relative survival for melanoma decreases with increasing tumour thickness. In 2017–2021, the 5-year relative survival for melanomas with a Breslow thickness less than or equal to 1.0mm was 100%. This decreased to 95% for melanomas 1.1–2.0mm thick, 82% for melanomas 2.1–4.0mm thick, and 66% for melanomas with a thickness greater than 4.0mm.
Ulceration was also associated with a lower 5-year survival, independent of tumour thickness. In 2017–2021, the 5-year survival rate for individuals with non-ulcerated melanomas was 98.9%. Comparatively, the 5-year survival rate for ulcerated melanomas was 76.1%.
Primary tumour categories consider the combined impact of ulceration and Breslow thickness on survival outcomes (Figure 10). Across primary tumour categories, relative survival rates ranged from 101% among individuals diagnosed with a non-ulcerated melanoma less than 0.8mm thick (T1a) to 57.1% for individuals diagnosed with an ulcerated melanoma with a thickness greater than 4mm (T4b).
Figure 10: Melanoma of the Skin, 5-year relative survival by AJCC primary tumour category, 2017–2021: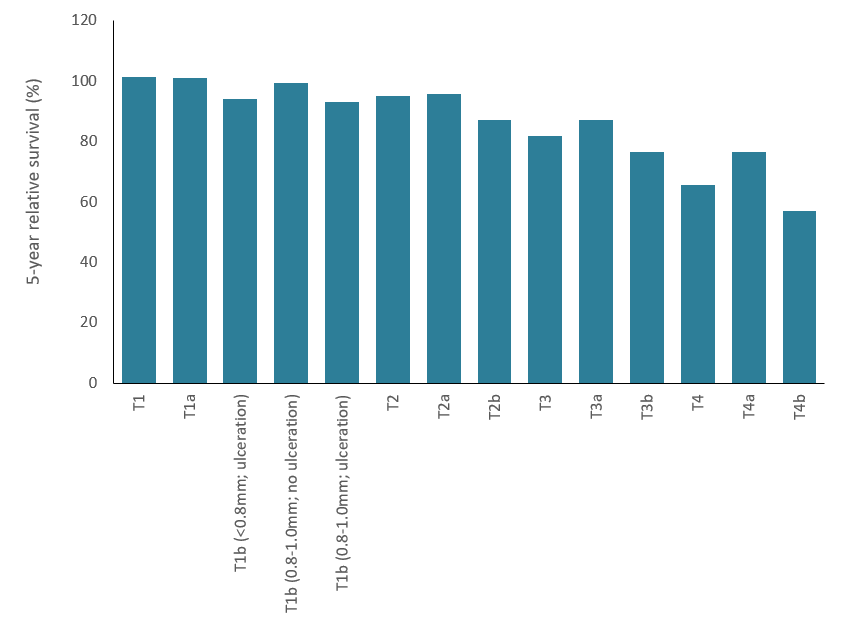
Source: AIHW Australian Cancer Database 2021
The location of the melanoma on the body (the primary tumour site) can confer differences in survival rates. In 2017–21, the 5-year relative survival rate was greatest for melanomas of the upper limbs (97%), followed by melanomas on the lower limbs (97%), the trunk (97%) and the head and neck (91%). Of the specified sites, the head and neck consistently had the lowest survival rates across melanoma sites.
Survival rates also varied across histological type of melanoma (Table 6). In 2017–2021, the 5-year relative survival rate was lowest for nodular melanomas (80%) and highest for malignant melanoma in junctional naevus (101%). For the most common type of melanoma diagnosed during the period – low cumulative sun damage melanoma – the relative survival rate was 99%.
Table 7: 5-year relative survival rates and proportion of melanomas by histological type, 2017–2021:
| Histological type | Relative survival rate (%) | Proportion of cases (%) |
|---|---|---|
| Nodular melanoma | 80.3% | 10.42% |
| Epithelioid cell melanoma | 82.5% | 0.11% |
| Spindle cell melanoma, NOS | 84.8% | 0.63% |
| Amelanotic melanoma | 87.5% | 0.21% |
| Malignant melanoma, NOS | 88.8% | 24.24% |
| Acral melanoma | 88.9% | 0.73% |
| Desmoplastic melanoma, NOS | 91.4% | 1.44% |
| Malignant Spitz tumour | 93.1% | 0.19% |
| Low cumulative sun damage melanoma | 98.8% | 49.51% |
| Lentigo malignant melanoma | 99.6% | 9.50% |
| Malignant melanoma, regressing | 100.3% | 2.83% |
| Malignant melanoma in junctional naevus | 100.6% | 0.14% |
| Blue naevus, malignant [obs] | n.p. | 0.02% |
| Balloon cell melanoma | n.p. | 0.01% |
| Malignant melanoma arising in giant congenital naevus | n.p. | 0.01% |
notes:
- Relative survival may be above 100%. Relative survival is relative to the general population. A rate of 50% suggests the survival is half that of the general population. A rate of more than 100% suggests the survival is greater than the general population.
Source: Australian Cancer Database 2021
Survival trends by country of birth
In 2012–2021, 142,325 cases of melanoma were diagnosed (an average of 14,233 cases per year). Of these cases, 60% were diagnosed among individuals born in Australia, 28% had missing or inadequately described information on country of birth, and 12% were diagnosed among individuals who were born overseas. Due to the incompleteness of records, there is greater uncertainty regarding the precision of rates by country of birth. Data aggregated by country of birth should, therefore, be interpreted with caution.
Melanoma survival rates for males and females living in Australia varied by country of birth. 5-year relative survival rates for the top 10 countries of birth for Australia’s estimated resident population are presented in Table 8. In 2012–2021, the 5-year relative survival rates across these 10 countries of birth were lowest for males born in China (56%) and highest for males born in India (101%). In comparison, the rate for the Australian-born male population was 87%, while the rate for males born overseas was 86%. For females, during the same period, the lowest survival rate was for females born in China (78%) and highest rate was for females born in India (95%). Comparatively, the relative survival rate for the Australian born female population was 92%, while the rate for females born overseas was 90%. When considering the 10 most commonly diagnosed cancers in Australia (excluding melanoma), males and females born in China had comparable or higher 5-year relative survival rates when compared to their Australian-born counterparts (Table 9).
Table 8: 5-year relative survival rates for the 10 countries of birth with the greatest population size in Australia, by sex, 2012–2021:
| Country of birth | Proportion of Australia's total population (%) | Males | Females | ||
|---|---|---|---|---|---|
| Survival rate | Mean Breslow (mm) | Survival rate | Mean Breslow (mm) | ||
| England | 3.5 | 85.7 | 1.6 | 90.6 | 1.4 |
| India | 3.5 | 101.1 | 2.3 | 94.7 | 2.2 |
| China | 2.6 | 55.8 | 2.8 | 77.5 | 3.1 |
| New Zealand | 2.3 | 92.9 | 1.4 | 93.9 | 1.1 |
| Philippines | 1.5 | n.p. | 2.6 | n.p. | 3.9 |
| Vietnam | 1.2 | n.p. | 2.4 | n.p. | 3.7 |
| South Africa | 0.8 | 93.2 | 1.5 | 97.0 | 1.0 |
| Nepal | 0.8 | n.p. | n.p. | n.p. | n.p. |
| Malaysia | 0.7 | n.p. | 1.8 | n.p. | 1.8 |
| Sri Lanka | 0.7 | n.p. | 1.6 | n.p. | 0.7 |
| Total overseas born population | 32.0 | 86.4 | 1.7 | 89.9 | 1.4 |
| Australian born population | 68.0 | 87.3 | 1.6 | 91.8 | 1.4 |
Source: Australian Cancer Database 2021 and Australian Bureau of Statistics 2025
Notes:
- Survival rates have been calculated using data from 2012-2021
- Proportion of the Australian estimated resident population as at 30 June 2025
- n.p. indicates data that was suppressed due to privacy and/or data quality concerns
- Relative survival may be above 100%. Relative survival is relative to the general population. A rate of 50% suggests the survival is half that of the general population. A rate of more than 100% suggests the survival is greater than the general population.
Table 9: 5-year relative survival rates for the ten most commonly diagnosed cancers, Australian-born and China-born populations, by sex, 2012-2021:
| Cancer type | China-born males | Australian-born males | China-born females | Australian-born females |
|---|---|---|---|---|
| Prostate | 94.6 | 99.4 | n.a. | n.a. |
| Breast | n.p. | 84.5 | 94.8 | 90.9 |
| Melanoma | 55.8 | 87.3 | 77.5 | 91.8 |
| Lung | 31.1 | 17.2 | 41.3 | 25.3 |
| Colorectal | 74.0 | 68.3 | 73.6 | 69.7 |
| Non-Hodgkin lymphoma | 74.1 | 72.8 | 71.9 | 75.6 |
| Kidney | 84.4 | 79.0 | 87.4 | 78.6 |
| Pancreatic | 19.5 | 10.8 | 20.1 | 11.0 |
| Thyroid | 95.0 | 91.9 | 99.7 | 97.1 |
| Uterine | n.a. | n.a. | 84.7 | 81.8 |
| Bladder | 71.5 | 56.3 | 61.7 | 45.6 |
| All cancers combined | 64.1 | 67.5 | 73.8 | 69.4 |
Notes:
- Survival rates have been calculated using data from 2012-2021
- n.p. indicates data that was suppressed due to privacy and/or data quality concerns
- n.a. indicates that the cancer is not applicable
Source: Australian Cancer Database 2021 and Australian Bureau of Statistics 2025
Variations in survival rates by country of birth are likely the result of multiple factors.
Differences in histology can contribute to variations in survival across countries of birth. In 2012–2021, males born in China had a higher proportion of melanoma types associated with lower survival rates when compared to Australian-born males, including acral melanomas (10.2% vs 0.6%). In contrast, the proportion of the higher-survival type low cumulative sun damage melanoma was lower (31% for males born in China vs 45% for males born in Australia). Similarly, histological types associated with lower survival rates made up a greater proportion of melanoma cases for females born in China when compared to females born in Australia (24% vs 0.9% acral melanomas in 2012–2021). Meanwhile, the proportion of low cumulative sun damage melanomas was lower for females born in China when compared to Australian-born females (24% vs 50%). Acral melanoma is the most frequent subtype of melanoma in China, accounting for approximately 38-42% of melanomas diagnosed (Chang, 2013; Guo et al. 2023).
Tumour size and diagnosis may also contribute to differences in survival rates across countries of birth (Table 8). Relative 5-year survival rates decline as melanoma thickness increases (Figure 10). In 2012–2021, the average thickness of melanomas diagnosed for males born in China was 2.8mm compared to an average of 1.6mm for melanomas diagnosed for males born in Australia. Females born in China also had a greater average thickness of melanomas diagnosed when compared to Australian-born females (3.1mm vs 1.4mm).
Other factors that may contribute to variations in survival rates by country of birth could include demographics factors, age at migration, accessibility and availability of culturally responsive services, use of sun protection, and awareness of melanoma risk.