


An overview of cervical cancer in Australia
What is cervical cancer?
Cervical cancer refers to cancers that develop in the uterine cervix - the lower part of the uterus projecting into the upper vagina. Cervical cancer develops when abnormal cells in the lining of the cervix begin to multiply in an uncontrolled manner and form precancerous abnormalities. If these abnormalities remain undetected or are left untreated, they can develop into invasive cervical cancer with the potential to spread into surrounding tissue and organs.
Cervical cancer disproportionately affects younger populations compared to most other cancer types
Generally, cancer is most common in older people. In 2021, the median age at diagnosis for females diagnosed with cancer (of any type) was 68 years old. Cervical cancer incidence rates begin to rise at younger ages than most other cancer types and the highest incidence rates for cervical cancer are recorded in younger populations when compared to most other cancer types. In 2021, the median age at diagnosis for cervical cancer was 48 years old. In 2025, an estimated 16% of all cancer cases for females were diagnosed in those under 50 years of age. Comparatively, an estimated 55% of cervical cancer cases were diagnosed in females under 50 years old.
Infection with HPV is the main risk factor associated with cervical cancer. Australia’s national HPV vaccination program commenced in 2007, with the aim of providing protection against the HPV infections that most commonly cause cancer. As time progresses and the populations who have participated in the vaccination program progressively represent greater proportions of the population under 50 years old, it is foreseeable that younger age groups will make up a smaller proportion of all cervical cancer cases. As a result, the median age at diagnosis is likely to continue to increase over time.
The number of cases of cervical cancer diagnosed has remained relatively stable over the last 20 years
In 2025, around 950 new cases of cervical cancer were estimated to be diagnosed, an unadjusted rate of 6.8 cases per 100,000 females in the population. Of these new cases, around 880 (93%) were estimated to be diagnosed in females aged 25–74 (the target population for the National Cervical Screening Program).
Since 1982, the crude incidence rate of cervical cancer has decreased from 12.7 cases per 100,000 females to an estimated 6.8 cases per 100,000 females in 2025. The most rapid decrease occurred from 1994 to 2002 where the rates changed from 12.8 to 7.1 cases per 100,000 females. Since 2003, the annual crude incidence rates have been more stable, ranging between 6.8 and 7.6 cases per 100,000 females.
When adjusted for age, cervical cancer incidence rates have also remained relatively stable over the last 20 years
In 2025, the age-standardised cervical cancer incidence rate was 6.7 cases per 100,000 females (age-standardised to the 2025 Australian population).
Since 1982, there has been a decrease in the age-standardised incidence of cervical cancer, from 15.5 to an estimated 6.7 cases per 100,000 females in 2025. Since 2003, however, the annual age-standardised incidence rate of cervical cancer has remained relatively unchanged – between an estimated 6.7 cases and 7.8 cases per 100,000 females with the 2025 estimate representing the lowest rate during the entire period. (Figure 1).
Cervical cancer age-adjusted incidence trends move with a greater similarity to the crude rates than most other cancer types. This is because most other cancer types are more heavily impacted by the ageing population. This occurs as more people reach older ages, where rates of most cancer types are generally higher and crude rates commonly increase, even where age-adjusted rates are stable or decreasing slightly. However, as discussed in the next section, the relative stability of cervical cancer incidence rates is achieved largely through offsetting differing trends by age.
Figure 1: Cervical cancer incidence, counts and age-standardised rates, females, all ages, 2001–2025:
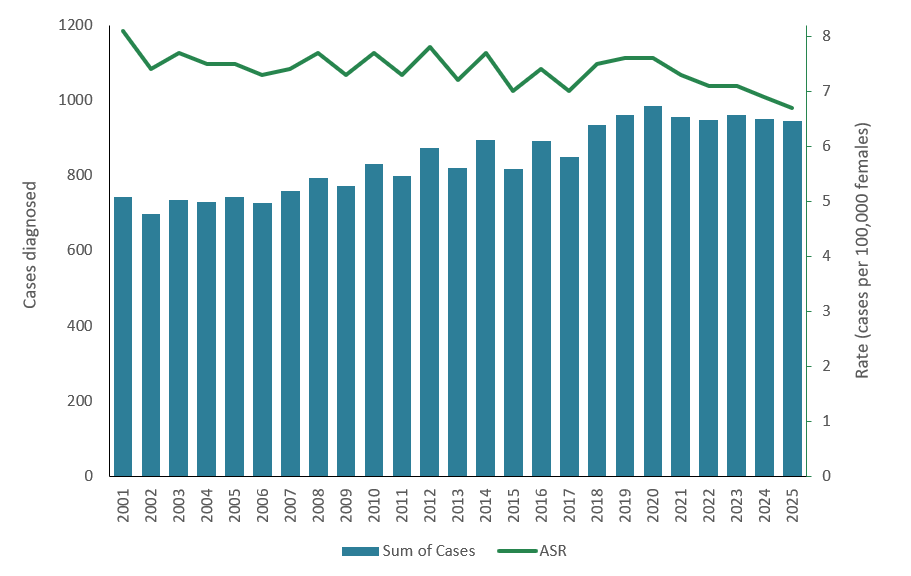
Notes:
- Rates are age-standardised to the 2025 Australian population.
- Data for 2022 to 2025 are projections.
Source: AIHW Australian Cancer Database 2021
Trends in cervical cancer incidence vary substantially by age group:
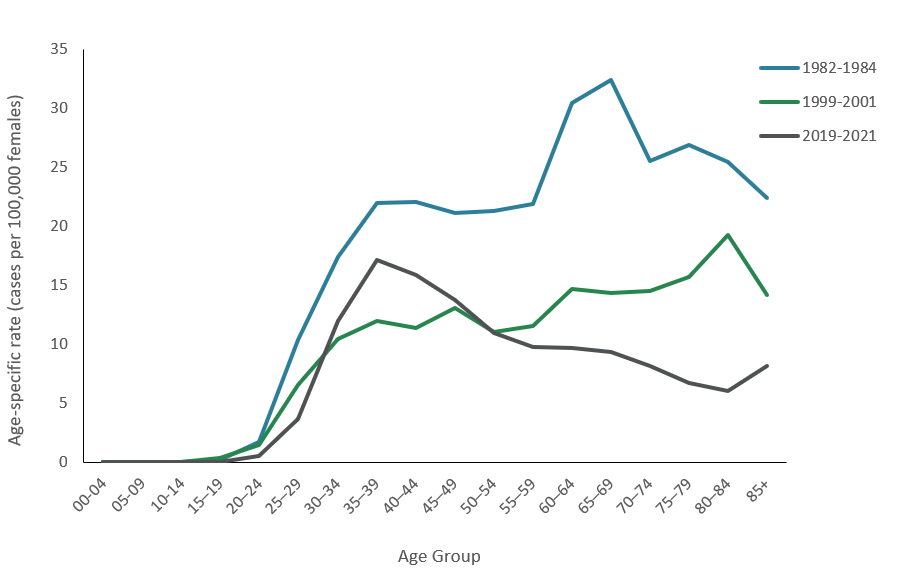
In 1982–1984, prior to the introduction of screening, cervical cancer incidence rates were comparatively high for all age groups. At this time, rates increased with increasing age up to around the age of 70. By 1999–2001, incidence rates had reduced across all ages, reflecting the introduction of the National Cervical Screening Program in 1991. Although the rates continued to increase with increasing age, it was more gradual up to the 80 to 84 age group where rates were highest (Figure 2). Cervical screening can detect precancerous abnormalities before they develop into invasive cancers, thereby reducing the incidence of malignant disease among screened populations.
Between 1999–2001 and 2019–2021, the incidence rates for individuals aged 55 or older continued to decrease. In contrast, incidence rates for individuals aged 30–49 increased and remain higher than the rates observed 20 years earlier (Figure 2).
The 2019–2021 rate for the 30 to 34 age group was around 12 cases per 100,000 females (Figure 2). The average rate is based on rates of 14 (2019), 12 (2020) and 9.7 (2021) cases per 100,000 females. By 2025, and with increasing proportions of the HPV vaccinated cohort within the age group, the estimated rate for this age group was 5.8 cases per 100,000 females, which would be the lowest rate reported for this age group.
Figure 2: Cervical cancer age-specific incidence rates, females, 1982–1984, 1999–2001 and 2019–2021:
Source: AIHW Australian Cancer Database 2021
Cervical cancer is very rare in children:
Since 2000, only two cases of cervical cancer have been observed in children aged 0–14. The histologic subtypes of cervical cancers in children and adolescents differ from the commonly diagnosed subtypes in the adult population and often have distinct characteristics and risk factors (Wohlmuth and Wohlmuth-Wieser 2021; Shi et al 2025).
Cervical cancer rates for females aged 15 to 29 are the lowest they have ever been:
Cervical cancer cases diagnosed and incidence rates among females aged 15–29 have been decreasing since 2013 (Figure 3). Between 2013 and 2021, the age-specific incidence rate among females in this age group declined by 68% — from 4.0 to 1.3 cases per 100,000 females, moving it from the 5th most common cancer diagnosed among females aged 15–29 to the 9th most common cancer. By 2025, should the existing trends continue, cervical cancer will no longer be within the leading 20 cancers diagnosed for this age group.
Infection with HPV is the main risk factor associated with cervical cancer and the reduced incidence of HPV observed within the younger population coincides with the delivery of Australia’s national HPV Vaccination Program. Generally, it takes 15 to 20 years for cervical cancer to develop following HPV infection (de Martel et al, 2020). A time lag between the introduction of the HPV vaccine and a reduction in cervical cancer incidence is, therefore, expected.
Since 2007, females aged 12–13 have received vaccination against HPV as part of a national vaccination program. In 2021, the first cohort of females that received vaccination were 26–27 years old. Around the time the national vaccination program was introduced, a catch-up program was also established for females aged 14–26, which ran from 2007 to 2009. Therefore, it is expected that while the impact of the vaccination program on cervical cancer incidence to date will be most noticeable among women aged 26 and below, the vaccination program may confer some benefit among women older than 26 too.
As vaccinated individuals age and move into older age-groups, the rates of cervical cancer for these older age-groups are expected to decrease. More information about the HPV vaccination program and its impact across cohorts is available in Box 1.
Figure 3: Cervical cancer age-specific incidence rates, females aged 15–29 years-old, 1982–2025:
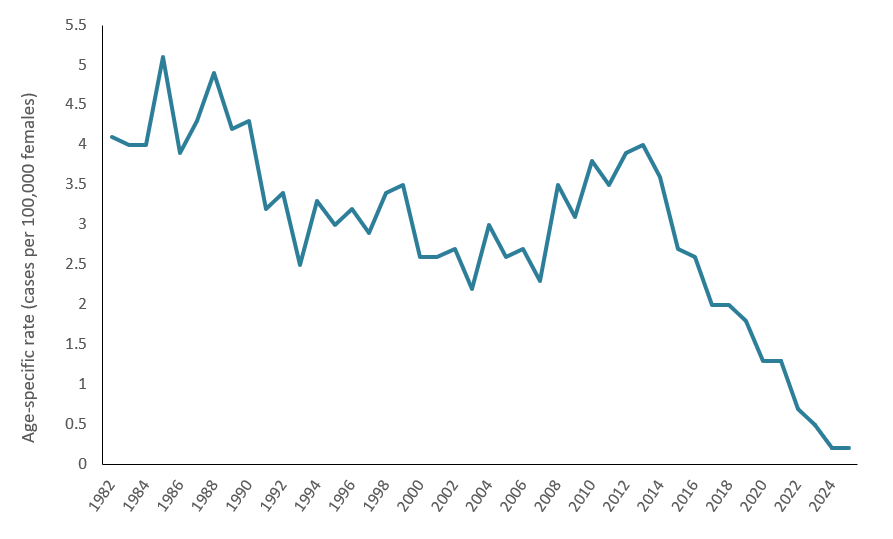
Notes:
- Data for 2022 to 2025 are projections.
Source: AIHW Australian Cancer Database 2021
Cervical cancer rates have recently increased among women aged 30–49:
Cervical cancer incidence for females aged 30-44 reached their lowest rate in 2001. Between 2001 and 2021, the incidence rates of cervical cancer among women aged 30–44 increased by 41% — from 9.6 to 13.5 cases per 100,000 females (Figure 4). Similar trends have been observed in countries like the United States of America, where the incidence of cervical cancer among females aged 30–44 increased by an average of 1.7% each year from 2012 to 2019 (American Cancer Society, 2025).
While cervical cancer incidence rates have increased among females aged 30-44 since 2001, trends differ slightly by 5-year ages groups. Cervical cancer incidence rates among females aged 30–34 may have peaked in 2019 (at 14.4 cases per 100,000 females). Over the following two years, the rates reduced to 11.7 and 9.7 cases per 100,000 females. This recent decline may mark the beginning of sustained reductions for this age group as the cohort from the vaccination program and youngest members of the catch-up program begin to represent an increasing proportion of the 30–34 age group. Comparatively, incidence rates for females aged 35-39 and 40-44 have not had recent declines sustained over multiple years.
For females aged 45 to 49, incidence rates have increased slightly since the early 2000s. In 2001, the cervical cancer incidence rate for this population was 15 cases per 100,000 females. By 2008, the incidence rate reached the lowest rate recorded to date - 9.3 cases per 100,000 females. After this, rates increased to 15 cases per 100,000 females in 2021 and are estimated to reach around 17 cases per 100,000 females in 2025.
The rise in incidence rates within this age group may be attributable to several factors, including increased frequency of HPV infection and changes to sexual behaviours and attitudes over time (Dillner 2000; Baussano et al. 2016). Additionally, the impact of HPV vaccination may be less demonstrable within this age group for multiple reasons. For instance, females aged 30 in 2021 would have been 16 years old in 2007 and those aged 44 would have been 30 years old. While most women aged 30–44 in 2021 have been offered HPV vaccination at some point, women in older cohorts, primarily targeted by the catch-up program, appear to have lower vaccinations rates than women in younger age groups who were primarily targeted by the in-school program (Box 1). Furthermore, HPV vaccination only prevents new HPV infections and, therefore, works best when given in early adolescence and before any exposure to HPV (Department of Health and Aged Care, 2023).
Figure 4: Cervical cancer incidence rates, females aged 30–44 years-old, 1982–2025:
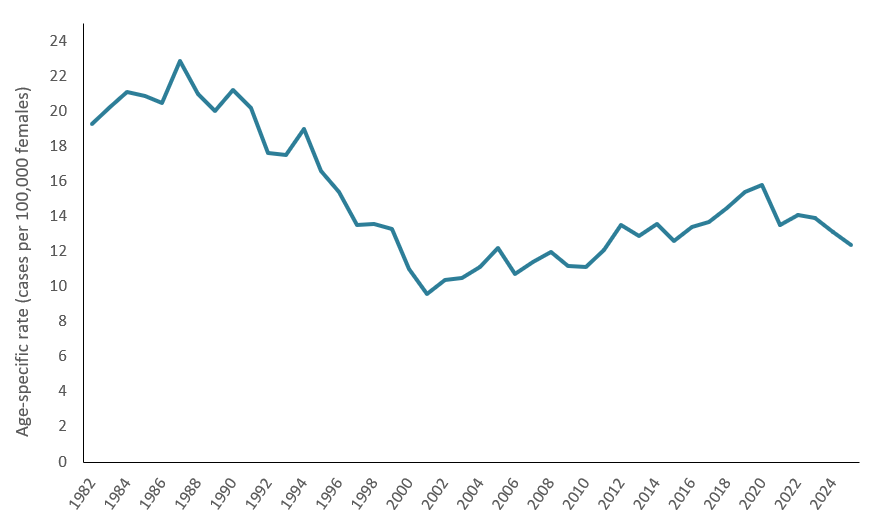
Note:
- Data for 2022 to 2025 are projections.
Source: AIHW Australian Cancer Database 2021
Cervical cancer incidence rates for the older female populations have been stable or decreasing:
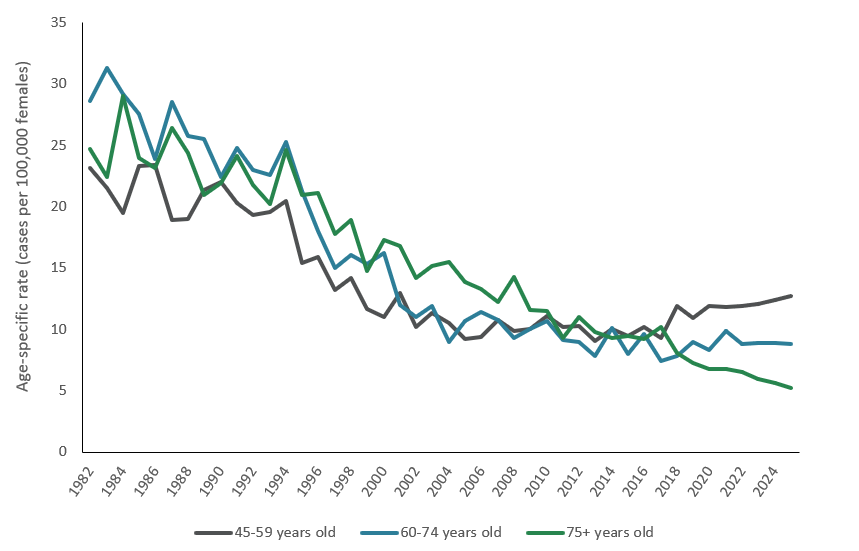
Cervical cancer incidence rates have decreased among women aged 50 and older from 14 cases per 100,000 females in 2000 to 9.2 cases per 100,000 females in 2021 (Figure 5).
Within this population, decreases in incidence became more pronounced as age increased. Since 2000, incidence rates have either remained stable or had modest decreases for populations closer to the age 50. For instance, between 2000 and 2021, cervical cancer incidence rates for the 50–59 age group have been somewhat stable, ranging between 12 and 8.1 cases per 100,000 females. Meanwhile, more pronounced decreases in incidence were observed as age increased further above 50. Between 2000 and 2021, the incidence rate for females aged 70–79 decreased by 58% - from 18 to 7.5 cases per 100,000 females. The incidence rate for females aged 80–89 decreased by 65% during the same period - 19 to 6.6 cases per 100,000 females.
Reductions in the incidence rate of cervical cancer among women aged 50 and older coincide with population-level cervical screening efforts, which have enabled the early detection of cervical abnormalities before progression to invasive cervical cancer (Box 2). Declines in cervical cancer incidence rates have similarly been observed in other countries following the introduction of population-level cervical screening programmes, including Sweden, the United Kingdom, and the United States of America (Singh et al. 2023).
Figure 5: Cervical cancer age-specific incidence rates, females aged 45 years and over, 1982–2025:
Note:
- Data for 2022 to 2025 are projections.
Source: AIHW Australian Cancer Database 2021
Cervical cancer mortality has remained low over the last 20 years:
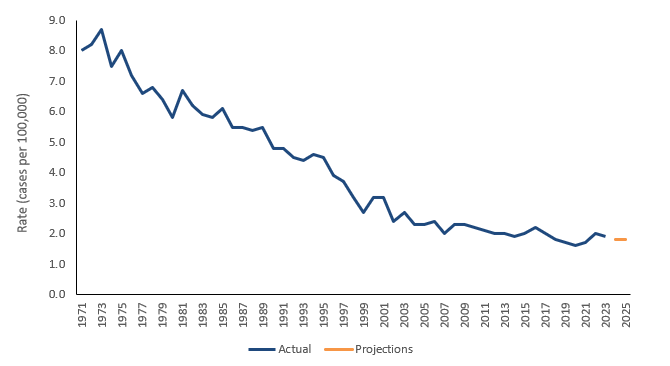
In 2025, there were an estimated 254 deaths attributable to cervical cancer (1.8 deaths per 100,000 females). The median age of death attributable to cervical cancer in 2023 was 60 years, compared to 78 for all cancers combined.
Between 2000 and 2007, mortality rates declined from 3.2 to 2.0 deaths per 100,000 females (Figure 6). Since 2007, mortality rates for cervical cancer have remained relatively steady between 1.6 and 2.3 deaths per 100,000 females but lower rates were more likely to occur in more recent years.
Deaths attributable to cervical cancer are rare in younger age groups. For instance, since 1971, cervical cancer mortality rates for females aged 0–29 ranged between 0.0 to 0.3 deaths per 100,000 females in the population.
While cervical cancer incidence rates among females aged 30–44 increased between 2001 and 2021, rising incidence rates were not accompanied by equivalent rises in mortality. During this period, mortality rates among females aged 30–44 remained between 0.8 and 2.1 deaths per 100,000 females. Survival rates for cervical cancer among this age group are high. For 2017–2021, the 5-year relative survival rates for females aged 30–34, 35–39, 40–44 were 92%, 89%, and 83%, respectively.
As more individuals are vaccinated against HPV, and as these cohorts age, the incidence of cervical cancer and consequently cervical cancer mortality rates are expected to decrease for women aged 30–44 and older.
Figure 6: Cervical cancer mortality rates, females, all ages, 1972–2025
Source: AIHW Australian Cancer Database 2021
Cervical cancer: Priority populations:
Cervical cancer incidence rates can differ across Australia and for different population groups. The following discusses some of the more notable differences.
Queensland has higher rates of cervical cancer
Trends in cervical cancer incidence varied between states and territories. In 2021, the age-standardised incidence rate of cervical cancer varied between 8.9 cases per 100,000 women (Queensland) and 4.7 cases per 100,000 women (Australian Capital Territory).
Since 1982, the age-standardised cervical cancer incidence rate in Queensland has usually been above the national rate. This is also true for the Northern Territory although in more recent years the Northern Territory’s incidence rates have been closer to the national rate. Since around 2007 the Australian Capital Territory has usually recorded incidence rates below the national average while since 1997, Victoria has also usually recorded lower rates than the national rate. More information about cervical cancer by state and territory can be found within the Cancer by state and territory data visualisation.
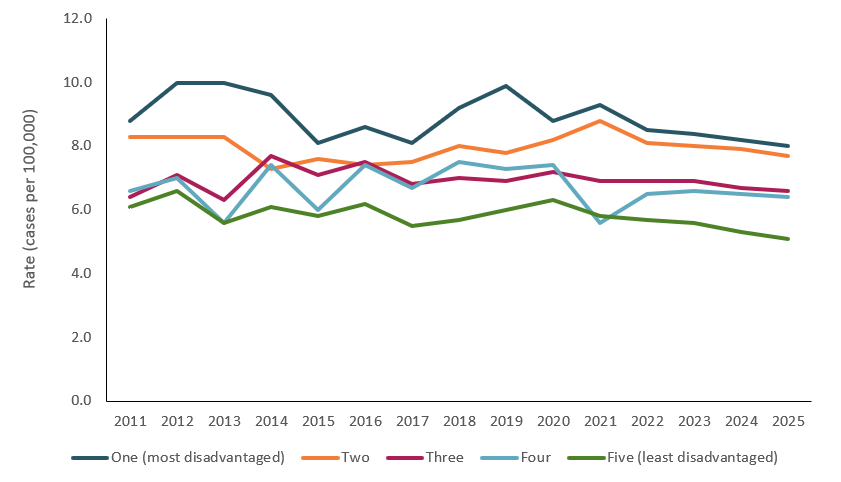
Those living in the most disadvantaged areas have higher rates of cervical cancer and poorer survival outcomes:
The Index of Relative Socio-Economic Disadvantage (IRSD) is a general socioeconomic index that summarises information about the economic and social conditions of people and households within an area based on factors such as average household income, education levels, and unemployment rates. It is an area-based measure of relative socioeconomic disadvantage and is used as a proxy for the socioeconomic disadvantage of people living in those areas. Consequently, it may not reflect the individual status of each person or household within that area.
Socioeconomic quintile 1 represents people living in areas with the greatest socioeconomic disadvantage according to the Index of Relative Socio-Economic Disadvantage (that is, the lowest socioeconomic area), and quintile 5 represents people living in the highest socioeconomic areas.
In 2021, the age-standardised incidence rate of cervical cancer was highest among those living in the most socioeconomically disadvantaged areas (237 cases; 9.3 cases per 100,000 females). The incidence rate among individuals living in the least socioeconomically disadvantaged areas was 38% lower (158 cases; 5.8 cases per 100,000 females) (Figure 7).
Figure 7: Cervical cancer incidence rates by Socio-Economic Indexes for Areas (SEIFA) quintiles, female, all ages, 2011–2025:
note: Rates are per 100,000 females and data for 2022 to 2025 are projections.
Source: AIHW Australian Cancer Database 2021
As discussed earlier, over the last two decades, national incidence rates for cervical cancer have been increasing for females aged 30–44. Within this age group, incidence rates for cervical cancer have increased or remained stable across the socioeconomic quintiles. Between 2012–2016 and 2017–2021, the age-specific incidence rate amongst individuals living in the most socioeconomically disadvantaged areas increased from 16.4 to 17.6 cases per 100,000 females. Similarly, the age-specific incidence rate amongst individuals aged 30–44 living in the least socioeconomically disadvantaged areas increased from 11.4 to 12.2 cases per 100,000 females.
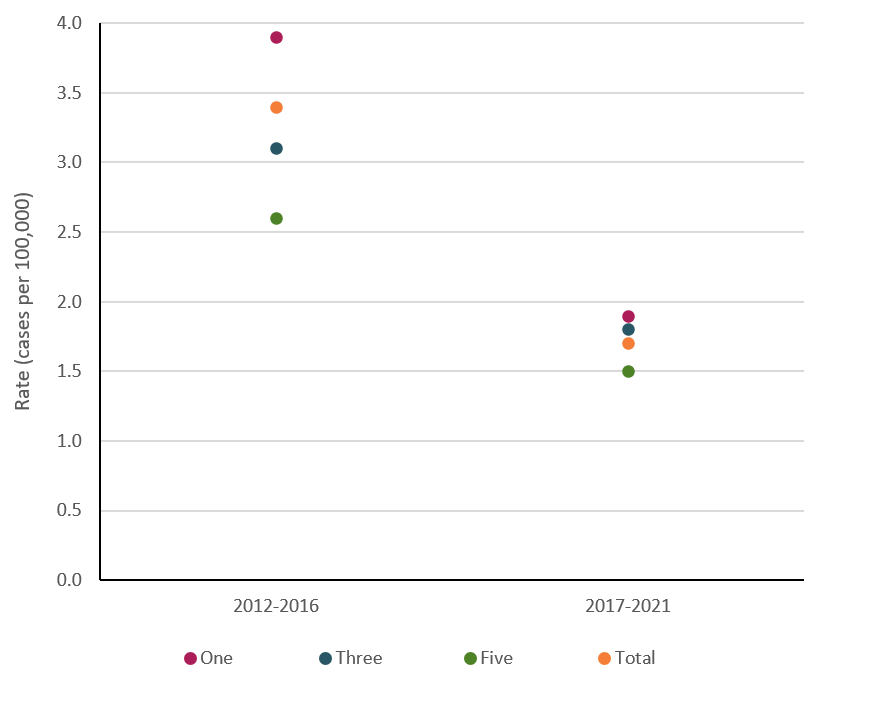
For females aged 15–29, for whom national cervical cancer incidence rates have been decreasing, incidence rates have also decreased across all socioeconomic quintiles. Between 2012–2016 and 2017–2021, the age-specific incidence rate amongst individuals living in the most socioeconomically disadvantaged areas halved from 3.9 to 1.9 cases per 100,000 females. Likewise, the rate amongst individuals living in the least socioeconomically disadvantaged areas decreased from 2.6 to 1.5 cases per 100,000 females and the rate disparity between these populations has reduced. Decreases across socioeconomic areas for females aged 15–29 coincide with the delivery of the National HPV vaccination program.
Figure 8a: Cervical cancer incidence rates for the 2012–2016 and 2017–2021 periods by Socio-Economic Indexes for Areas (SEIFA), females, 15–29 years:
Source: AIHW Australian Cancer Database 2021
Figure 8b: Cervical cancer incidence rates for the 2012–2016 and 2017–2021 periods by Socio-Economic Indexes for Areas (SEIFA), females, 30–44 years:
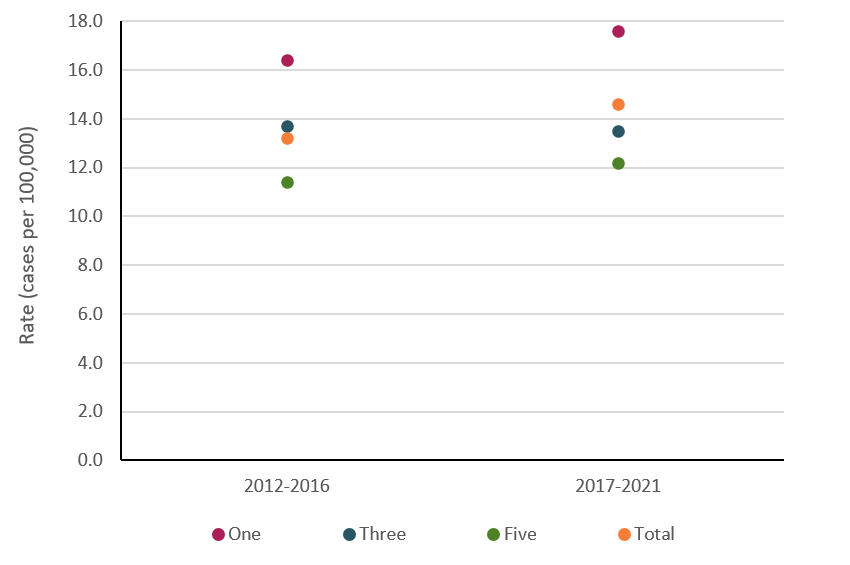
Source: AIHW Australian Cancer Database 2021
Females living in the most socioeconomically disadvantaged areas experienced poorer survival outcomes and higher mortality rates. In 2017–2021, the 5-year relative survival rate for cervical cancer was 68.5% for females living in the most disadvantaged areas compared to 81.1% for females living in the least disadvantaged areas. Due to a combination of higher incidence rates and poorer survival outcomes, individuals living in the most disadvantaged areas, who represent approximately 20% of the total population, accounted for 32% of deaths from cervical cancer in 2017–2021 (361 of 1,140 deaths). In contrast, the approximately 20% of the population living in the least disadvantaged areas accounted for 15.4% of cervical cancer deaths (175 of 1,140 deaths) – less than half the proportion observed in the most disadvantaged areas. More information about cervical cancer across socioeconomic areas can be found in the SEIFA - cancer incidence, mortality and survival data visualisation.
Disparities in cervical cancer incidence and outcomes across socioeconomic areas may be impacted by multiple factors, including differences in exposure to risk factors, differences and variability in the use of and access to cervical screening. In 2020–2024, individuals living in the most disadvantaged areas had lower levels of participation (70%) in cervical screening programs when compared to individuals living in the most socioeconomically advantaged areas (87%) (AIHW, 2025).
Table 1: Participation in cervical screening, by socioeconomic area, participants aged 25–74, 2020–2024:
| Socioeconomic area | Number | Crude rate (%) | Age-standardised rate (%) |
|---|---|---|---|
| 1 (most disadvantaged) | 949,305 | 69.8 | 70.2 |
| 2 | 1,031,706 | 73.8 | 74.2 |
| 3 | 1,101,561 | 77.4 | 77.6 |
| 4 | 1,172,353 | 80.3 | 80.6 |
| 5 (least disadvantaged) | 1,253,806 | 87.2 | 87.2 |
| Australia | 5,513,616 | 77.9 | 78.1 |
Notes
- Number is the number of participants who had an HPV test between 1 January 2020 and 30 June 2025.
- Crude rate is the number of participants who have had an HPV test between 1 January 2020 and 30 June 2025 as a percentage of the average ABS estimated resident population for females aged 25-74 in 2020, 2021, 2022, 2023, 2024, adjusted to exclude the estimated number of females who have had a hysterectomy (using age-specific hysterectomy fractions derived from the AIHW National Hospitals Morbidity Database).
- Age-standardised (AS) rate is the crude rate, age-standardised to the Australian population at 30 June 2001.
- Participants were allocated to a socioeconomic area, using their SA2 at the time of their screen (or postcode where SA2 was not available), according to the Socio-Economic Indexes for Areas (SEIFA) Index of Relative Socio-Economic Disadvantage for 2021.
- Australia does not match the total number of participants across different socio-economic areas because some participants were not able to be allocated to a socioeconomic area.
Source: AIHW analysis of NCSR data (NCSE RDE 11/07/2025) (AIHW 2025)
Trends in cervical cancer incidence vary by Remoteness area:
Remoteness areas divide Australia into broad geographical regions that share characteristics of remoteness for statistical purposes. The Australian Statistical Geography Standard (ASGS) Remoteness Structure defines 5 classes of relative geographic remoteness in Australia: Major cities, Inner regional, Outer regional, Remote, and Very remote. For this analysis, results for Remote and Very remote areas are combined and presented as ‘Remote and very remote’.
Cervical cancer incidence varies across remoteness areas (Table 2). In 2017–2021, age-standardised incidence rates ranged from 7.0 cases per 100,000 females in Major cities of Australia to 9.9 cases per 100,000 females in Remote and very remote areas.
Table 2: Crude and age-standardised (2025 Australian population) incidence rates for cervical cancer, by remoteness areas, 2017–2021
| Remoteness area | Number of cases | Crude rate (per 100,000 persons) | Age-standardised rate (per 100,000 persons) |
|---|---|---|---|
| Major cities | 3,205 | 7.0 | 7.0 |
| Inner regional | 889 | 7.9 | 8.1 |
| Outer regional | 481 | 9.4 | 9.6 |
| Remote and very remote | 109 | 9.3 | 9.9 |
| Australia | 4,684 | 7.4 | 7.4 |
Source: AIHW Australian Cancer Database 2021
For females aged 15–29, for whom national incidence rates have been declining over time, incidence rates for cervical cancer have decreased across all remoteness areas (Figure 9a). Between 2012–2016 and 2017–2021, the age-specific incidence rate for individuals in this age group living in Remote and very remote areas decreased from 4.0 to 0.8 cases per 100,000 females, which was the largest decrease of all remoteness areas.
For females aged 30–44, where national cervical cancer incidence rates have been increasing, incidence rates have increased or remained stable across remoteness areas (Figure 9b). Between 2012–2016 and 2017–2021, the age-specific incidence rate for individuals in this age group living in Outer regional areas increased from 16.1 to 21.2 cases per 100,000 females, which was the largest increase of all remoteness areas.
Figure 9a: Cervical cancer incidence rates by remoteness areas for 2012–2016 and 2017–2021 periods, 15–29 years, females (actuals only, excludes projections)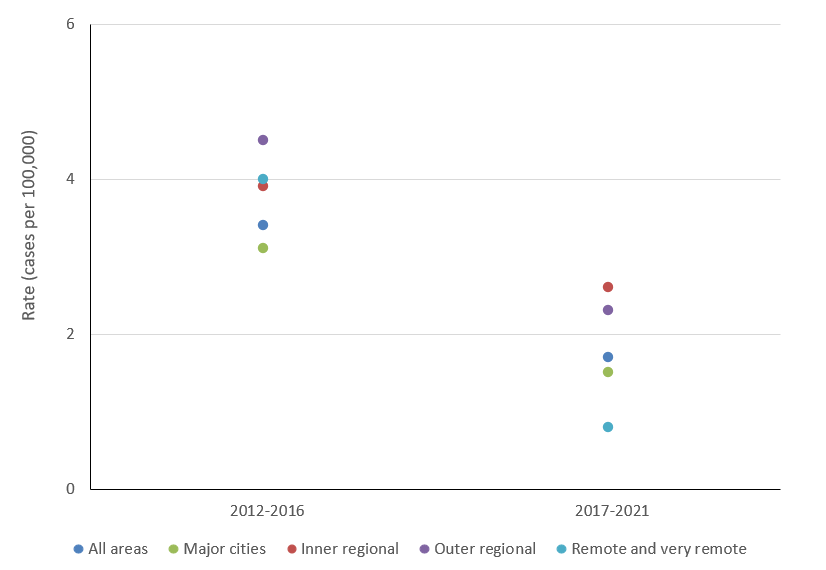
Source: AIHW Australian Cancer Database 2021
Figure 9b: Cervical cancer incidence rates by remoteness areas for 2012–2016 and 2016–2021 periods, 30–44 years, females (actuals only, excludes projections)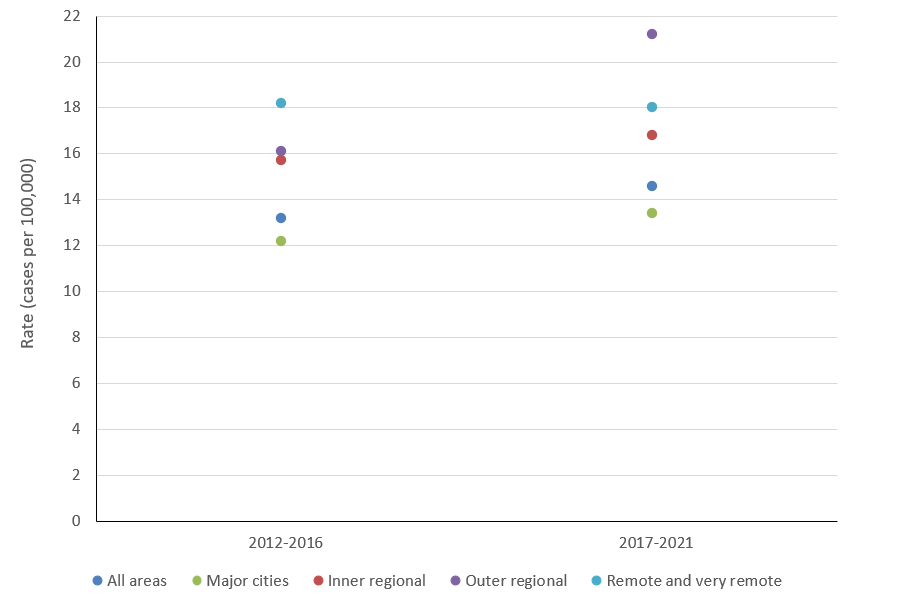
Source: AIHW Australian Cancer Database 2021
Access to, and timely use of, healthcare services are essential for reducing the health burden attributable to cervical cancer. Compared to people living in Major cities, people living in Remote areas face additional barriers to accessing healthcare services related to the prevention, diagnosis and treatment of cervical cancer. Among individuals who participated in cervical screening, for example, participants living in Remote areas who were recommended to have a colposcopy, the waiting time for the procedure was longer than their counterparts living in Major cities. Median time to colposcopy was 71 days for participants living in Major cities, 77 days for participants in Inner regional areas, 85 days for participants in Outer regional areas, and 80 days for participants in Remote areas (AIHW 2024).
Further, at a population level, individuals living in Remote areas are less likely to participate in cancer screening services (AIHW 2025). In 2020–2024, individuals living in Remote and Very remote areas of Australia had lower levels of participation in cervical screening programs when compared to individuals living in Major cities of Australia (Table 3) (AIHW, 2025). Cervical screening can prevent the incidence of cervical cancer by detecting abnormalities before they develop into cancers.
Table 3: Participation, by remoteness area, participants aged 25–74, 2020–2024:
| Remoteness area | Number | Crude rate (%) | Age-standardised rate (%) |
|---|---|---|---|
| Major cities | 4,066,220 | 78.3 | 78.6 |
| Inner regional | 940,042 | 77.7 | 78.3 |
| Outer regional | 410,905 | 75.0 | 75.6 |
| Remote | 58,815 | 74.1 | 74.1 |
| Very remote | 35,105 | 70.1 | 70.0 |
| Australia | 5,513,616 | 77.9 | 78.1 |
Notes
- Number is the number of participants who had an HPV test between 1 January 2020 and 30 June 2025.
- Crude rate is the number of participants who had an HPV test between 1 January 2020 and 30 June 2025 as a percent of the average ABS estimated resident population for females aged 25-74 in 2020, 2021, 2022, 2023, and 2024, adjusted to exclude the estimated number of females who have had a hysterectomy (using age-specific hysterectomy fractions derived from the AIHW National Hospitals Morbidity Database).
- Age-standardised (AS) rate is the crude rate, age-standardised to the Australian population at 30 June 2001.
- Participants were allocated to a remoteness area using their SA2 at the time of their screen (or postcode where SA2 was not available) according to the Australian Statistical Geography Standard (ASGS) for 2021.
- Australia does not match the total number of participants across different remoteness areas because some participants were not able to be allocated to a remoteness area.
Source: AIHW analysis of NCSR data (NCSR RDE 11/07/2025) (AHW, 2025).
First Nations cervical cancer incidence and mortality rates are more than double those for the non-Indigenous population:
National estimates for Aboriginal and Torres Strait Islander (First Nations) populations in this commentary are based on data from all jurisdictions with imputation of Indigenous status for those records where Indigenous status is unknown. Additionally, rates for First Nations populations in this section have been calculated using Census populations adjusted for changing Indigenous status identification over time. Further information on the methods used for Indigenous status imputation and the adjustment of Census populations for changing identification is available in Cancer Data Commentary Number 13.
In 2017–2021, 246 cases of cervical cancer were estimated to be diagnosed among First Nations females — an average of 49 cases per year. Of these cases, 95% were diagnosed among females aged 25–74 (the target population for the National Cervical Screening Program).
In 2017–2021, First Nations females aged 30–39 years old represented the greatest proportion of cervical cancer cases for all ages (74 cases; 30% of all new cases).
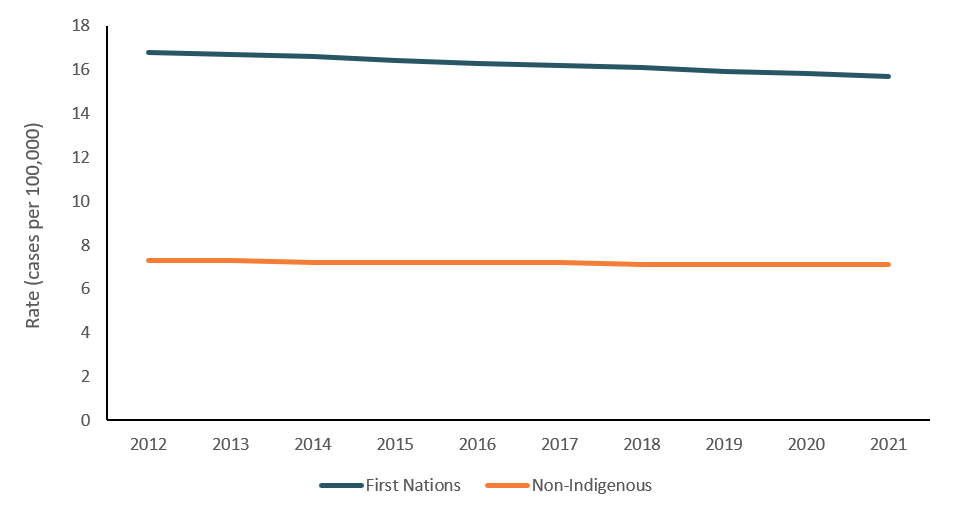
In 2017–2021, for cervical cancer, the age-standardised incidence rate among First Nations females was estimated to be more than double the rate for non-Indigenous females (15.8 compared to 7.1 cases per 100,000 females, respectively). Disparities are also observed across cervical cancer mortality and survival outcomes. The 5-year relative survival rate for cervical cancer in 2017–2021 was 66.6% for First Nations females and 76.6% for non-Indigenous females. The combination of higher incidence and lower survival rates leads to First Nations mortality rates being more than 4 times the non-Indigenous rates (6.9 deaths per 100,000 females and 1.6 deaths per 100,000 females, respectively). The observed disparities in mortality rates between First Nations females and non-Indigenous females have not increased between 2012–2016 and 2017–2021 (Figure 11).
Disparities in cervical cancer incidence may be impacted by multiple factors, including variability in the use of and access to cervical screening. Aboriginal and Torres Strait Islander women experience lower levels of participation in cervical screening (Whop et al. 2016) and this may contribute to higher incidence and mortality.
Figure 10: Cervical cancer age-standardised incidence rates among First Nations females, 2011 to 2025: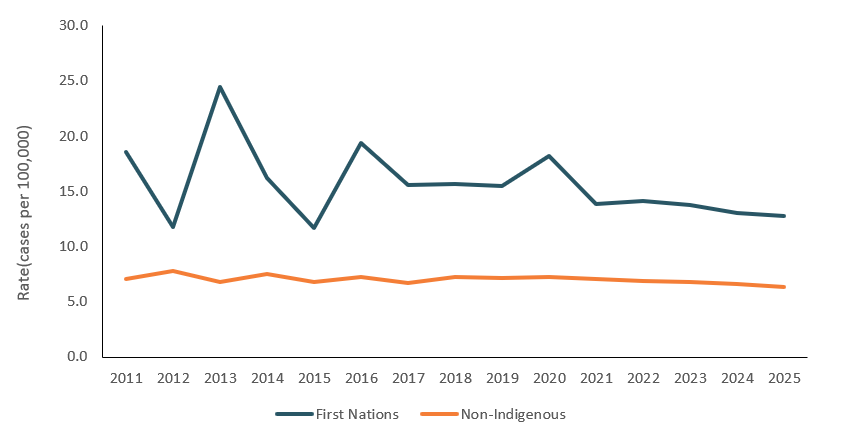
Source: AIHW Australian Cancer Database 2021
Figure 11: Trend line for cervical cancer age-standardised incidence rates among First Nations females, 2012 to 2021:
Source: AIHW Australian Cancer Database 2021
Projected timeframe until cervical cancer elimination in Australia:
In November 2021, the Minister for Health announced that a National Strategy for the Elimination of Cervical Cancer in Australia was being developed in collaboration with the Australian Centre for the Prevention of Cervical Cancer (ACPCC). The strategy aimed to inform future activities to eliminate cervical cancer as a public health problem in Australia by 2035. The elimination of cervical cancer is defined as less than four new cases of cervical cancer per 100,000 women per year (age-standardised to the World female population in 2015), which aligns with the goal established by the World Health Organization’s (WHO) Cervical Cancer Elimination Initiative.
The Cancer data in Australia report includes two main sets of projections for cervical cancer. The short-term projections use a linear regression method and provide projections up to the CdiA reporting year (that is, if the report is released in 2025, the projections will be provided to 2025). The longer-term projections use the NordPred software package to estimate cervical cancer incidence a further 10-years into the future. The NordPred software is a specially designed cancer incidence projection program written by Harald Fekjær and Bjørn Møller at the Cancer Registry of Norway, which accounts for the impacts of individual ageing, general societal changes and different birth cohorts. For more information on these projection methods, see Cancer data in Australia, Methods.
Reviewing the cervical cancer projections
For most cancers, the projections from the above-mentioned methods are published without adjustment. In general, cancer incidence rates change slowly over time, but interventions like the introduction of HPV vaccination can beget more rapid changes. Since linear regression models can struggle to accurately project data where trends are rapidly changing, it was necessary to review the projections for cervical cancer to ensure that they reflected the emergent trends. Meanwhile, the Nordpred model largely recognised these changes and factored them into the long-term projections, but not to the rate that may be expected based upon the current data. It should also be noted that there is often some incongruence between rates in 2025 and those in 2026, where the short-term projections end and the long-term projections commence.
The data visualisation below presents two sets of incidence projections for cervical cancer from 2022 onwards. The first set reflects the projected rate that is typically generated using the standard methodology. The second set represents the revised rate, which has been adjusted to align with the findings discussed below. Discussion of the rates and projections is provided alongside the visualisation.
Cervical cancer incidence rates are projected to decline by 2035
Before 2002, cervical cancer incidence rates were in steep decline before entering a period of relative stability over the next 20 years. This stability was partly the result of decreasing rates for older age groups being offset by increasing rates for several younger age groups. After years of age-standardised cervical cancer incidence rates being relatively stable, rates are estimated (projected) to decrease from 7.3 cases per 100,000 females in 2021, to 6.7 in 2025 and 5.2 cases per 100,000 females in 2035.
When age-standardised to the World female population, cervical cancer incidence rates are also predicted to decline
As mentioned earlier, the elimination of cervical cancer is defined as less than 4 cases per 100,000 women per year, when age-standardised to the World female population in 2015. Age-standardising to the global population removes the effect of age differences between countries, allowing for international comparisons and evaluation against the WHO’s elimination target.
The World population has a younger age structure than the Australian population. Age-standardising to the world population means applying the age-specific rates that were observed for each 5-year age group in Australia to the world’s population.
By 2035, in Australia, based on existing rate trends, the estimated incidence rate of cervical cancer (age-standardised to the 2015 World female population) is 4.2 cases per 100,000 females. Projections this far removed from 2035 have a relatively high degree of uncertainty and projection edits are undertaken to refine existing projections. The edits applied are subjective and will be refined over time. However, based on existing rate trends, the elimination target appears within reach and cervical cancer incidence rates appear likely to reduce to levels not previously seen.
Figure 12: Cervical cancer incidence rates, by age, 1982 to 2035, (projections from 2022)
This visualisation shows cervical cancer incidence rates for females by age group from 1982 to 2035. Rates for 2022 to 2025 are short-term projections based on linear regression, while rates for 2026 to 2035 are produced using the NordPred software package. It includes actual rates, projected rates and revisions to the projections. Adjustments are made when Human Papillomavirus (HPV) vaccination and catch-up cohorts enter an age group, where the models need to reflect the rapid decreases in incidence observed for these cohorts. All data are available in Excel in the Data section of this report.

The revised projections are based on cervical cancer incidence trends to date. It should be noted that alternative models are available for predicting cervical cancer incidence. There is no expectation that projection models will align where methodology or underlying assumptions differ. These revised projections are not intended to represent a preferred model. Rather, they present a necessary refinement to routine projections in recognition of the unique factors currently affecting cervical cancer incidence trends.
The cervical cancer projections will be reviewed annually, as new incidence data becomes available. While some discussion is included below, more detailed information about the revised projections can be found within the data visualisation.
Adjusting for the effects of the HPV vaccination cohort
In 2007, girls aged 12–13 began receiving HPV vaccinations as part of Australia’s in-school vaccination program. As this population ages and moves into older age groups, the incidence rates for those age groups decrease sharply. Around the time the national vaccination program was introduced, a catch-up program was also established for females aged 14–26, which ran from 2007 to 2009. Current trends suggest that incidence rates for cervical cancer begin decreasing sharply around 5-years prior to the entry of the in-school vaccination cohort. Adjustments are made where the short-term projections do not seem to account for this change sufficiently well.
The longer-term projections produced by the Nordpred method recognise the vaccination cohort and project reduced rates as this cohort enters an age group. However, the rate of decline predicted by this model appears slower than we would expect based upon current trends in the actual data. Therefore, the projections have been revised to decline more rapidly once the population with greater HPV vaccination rates enters an age group.
Box 1: HPV vaccination in Australia:
Human papillomavirus (HPV) refers to a group of more than 150 related viruses. Infection with HPV is a risk factor for several cancers, including cervical cancer. Risk factors for acquiring new HPV infections include younger age, younger age of first sexual activity, smoking, and having a higher number of sexual partners (del Pino et al. 2024).
HPV vaccines help prevent infection by certain types of HPV and, therefore, help to reduce the incidence of cervical cancers associated with HPV. It is estimated that HPV is the underlying cause of almost 100% of cervical squamous cell carcinomas and up to 90% of cervical adenocarcinomas (Brotherton et al. 2020).
The National HPV vaccination programme was introduced in Australia on 1 April 2007 to immunise girls aged 12–13 against HPV types 16 and 18. In 2013, the programme was extended to also immunise boys aged 12–13. A catch-up programme was introduced for girls aged 14–26 in 2007–2009, and for boys aged 14–15 in 2013–2014. From 2018 onwards, a HPV vaccine effective against an additional 5 HPV types (the next 5 most common types that cause cervical cancer after types 16 and 18) became available. It is expected that this will further reduce the prevalence of HPV infection and, therefore, cervical cancer.
While women born after 1980 were offered HPV vaccination through either the initial or catch-up programme, women in the catch-up programme may have lower vaccination rates than those women targeted by the in-school vaccination programme. For instance, as at March 2011, only 32% of all women aged 18–26 in 2007 had received a complete course of the HPV vaccine (Department of Health and Ageing, 2011). Comparatively, 75% of girls aged 12–13 had received a complete course of the HPV vaccine. Furthermore, HPV vaccination only prevents new HPV infections and cannot treat existing infection or disease. HPV vaccines, therefore, work best when given before any exposure to HPV. The impact of the vaccination programme on cervical cancer incidence will, therefore, be most noticeable among those individuals who were 12–13 from 2007 onwards (i.e., individuals born from 1995 onwards; ages 26 and below in 2021).
The population prevalence of oncogenic HPV 16/18 has declined among young women since the introduction of the National HPV Vaccination Programme (AIHW 2024). The success of the vaccination programme can also be seen in the substantial decrease in the incidence rates of cervical cancer among females aged 0–29 over the last 10 years. In 2021, the age-standardised incidence rate of cervical cancer among individuals aged 0–29 reached its lowest since 1982 (when data collection began) at a rate of 0.7 cases per 100,000 females.
With the move to HPV primary cervical screening tests and increasing coverage with HPV vaccination, the prevalence of HPV-associated cervical cancers is expected to decrease over time, which would reflect a successful HPV vaccination programme. Consequently, HPV-independent cervical cancers are likely to increase as a proportion of the total diagnosed cervical cancers.
Box 2: Cervical screening program
The National Cervical Screening Program (NCSP) is one of Australia’s 3 population-based cancer screening programs. It aims to reduce the number of cervical cancer cases and deaths by detecting precancerous abnormalities before any potential progression to cervical cancer. It is recommended that individuals in Australia aged 25 to 74 years old, who have a cervix, and have ever been sexually active, screen every 5 years.
The NCSP aims to detect cervical abnormalities (including squamous and glandular precancers) and early-stage cancers to enable timely intervention and improve cervical cancer outcomes. Research published by the AIHW (2019) showed that 72% of cervical cancers diagnosed between 2002 and 2012 in women aged 20–69 occurred in individuals who had either never screened or were lapsed screeners. Additionally, this research found that cervical cancers that did occur in women who had recently screened were less likely to cause death than cervical cancers diagnosed in women who had never screened, likely due to these cancers being detected at an earlier stage (AIHW 2019). Such findings demonstrate the effectiveness of the NCSP in preventing cervical cancer.
Cervical cancer survival:
In 2017–2021, 5-year relative survival for cervical cancer was 77%. This means that, from the time of diagnosis, women diagnosed with cervical cancer had a 77% chance of surviving for at least 5 years compared with their counterparts in the general population.
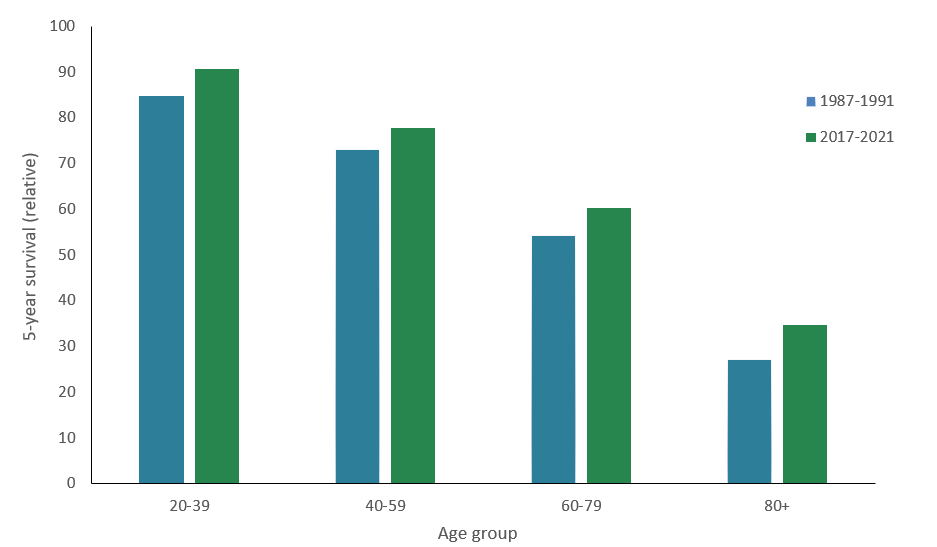
Over time, the 5-year relative survival for people diagnosed with cervical cancer has improved, from 70% in 1987–1991 to 77% in 2017–2021.
Cervical cancer survival varies by age:
The 5-year relative survival rate for cervical cancer decreases with increasing age (Figure 13). In 2017–2021, the 5-year relative survival for cervical cancer among women aged 20–39 was 91%. During the same period, the 5-year relative survival for women aged 80 or older was 35%.
Research suggests that age may act as an independent risk factor for cervical cancer survival (Quinn et al. 2019). The difference in survival across age groups may be influenced by several other factors too, including stage at diagnosis, potential comorbidity, differences in treatments received, and amenability to treatment (Mancebo et al. 2021; Quinn et al. 2019; Withrow et al. 2023).
Figure 13: Cervical cancer 5-year relative survival by age-group, 1987–1991 to 2017–2021:
Source: AIHW Australian Cancer Database 2021
Cervical cancer survival varies by histology type:
Most cervical cancers are carcinomas. There are two main types of cervical cancer carcinomas, which are named after the cells they develop from:
- Squamous cell carcinoma – the most common type of cervical cancer that develops in cells that form the lining of the cervix’s outer surface (the ectocervix).
- Adenocarcinoma – a less common type of cervical cancer that starts in the glandular cells of the cervix
Table 4: Relative 5-year survival and incidence by histology, cervical carcinomas by carcinoma type, selected years and periods:
| Cervical cancer histology | 5-year relative survival (2007–2011) | 5-year relative survival (2017–2021) | Percentage of all cervical cancers in 2001 | Percentage of all cervical cancers in 2021 |
|---|---|---|---|---|
| 1: Carcinomas | 72.2% | 77.0% | 98.0% | 97.7% |
| 1.1: Squamous cell carcinomas | 71.3% | 77.0% | 69.0% | 67.3% |
| 1.2: Adenocarcinomas | 80.6% | 81.9% | 18.8% | 25.7% |
| 1.3: Adenosquamous carcinoma | 68.3% | 69.1% | 4.8% | 0.8% |
| 1.4: Carcinosarcoma | n.p. | n.p. | 0.9% | 0.4% |
| 1.5: Neuroendocrine neoplasms | n.p. | 40.7% | 0.3% | 1.3% |
| 1.6: Other and unclassified carcinomas | 44.2% | 55.5% | 4.2% | 2.2% |
Source: AIHW Australian Cancer Database 2021
The 5-year relative survival for cervical cancer varies depending on the cancer’s histology (Table 4). In 2017–2021, the 5-year relative survival for cervical squamous cell carcinomas was 77%. The 5-year relative survival during the same period was slightly higher for cervical adenocarcinomas at 82%. More information about cervical cancer survival across histology types can be found in the Cancer incidence and survival by histology (selected cancers).
HPV is estimated to cause almost 100% of cervical squamous cell carcinomas and up to 90% of cervical adenocarcinomas (Brotherton et al. 2020). With the implementation of HPV vaccination programs (Box 1) and HPV primary cervical screening tests in Australia (Box 2), the proportion of squamous cell carcinomas is likely to decrease.