Cancer in First Nations people - overview
Data about cancer occurring in Aboriginal and Torres Strait Islander (First Nations) people is often challenging and First Nations cancer reports often lack detailed information like age breakdowns, time series, and coverage of many cancer types that is important to support appropriate service planning, policy development and research priorities. This report is AIHW’s most comprehensive and detailed collection of First Nations cancer data. The release uses innovative approaches to address significant data obstacles and to centre First Nations people in the analysis. This new data provides essential new insights into cancer among First Nations people at an unprecedented depth. Some of these important new findings are highlighted in this overview.
What we know about cancer in First Nations people
Aboriginal and Torres Strait Islander people have a higher incidence of fatal, screen-detectable and preventable cancers and are more likely to be diagnosed at more advanced stages, often with comorbidities that are more complex (Cunningham et al. 2008). Compared with non-Indigenous Australians diagnosed with the same cancer, Indigenous Australians are disadvantaged because they are usually diagnosed later with more advanced disease, are less likely to have treatment, and often have to wait longer for surgery than non-Indigenous patients (Hall et al. 2004; Valery et al. 2006). This highlights the inequities within the health system experienced by Indigenous Australians.
Context of non-Indigenous data in this report
The non-Indigenous data in this report provides additional context for interpreting First Nations cancer rates and trends. It is not intended as a benchmark or target. Because non-Indigenous rates are generally close to Australian rates, these data can help identify specific needs for First Nations people more directly. First Nations and non-Indigenous people may have similar rates for some cancers, and rates may be increasing in both populations. Similar rates do not mean a cancer is not a concern; rather, they may indicate that additional or specific strategies for First Nations people are less needed than for cancers where First Nations rates are higher.
What is new in this report
The new First Nations cancer data aims to match the depth of existing national reporting focusing specifically on First Nations peoples. It uses a new method, developed by the AIHW, which is designed to fill some of the gaps in the data, and to centre the First Nations population when comparing to the non-Indigenous population (using age standardisation). .
Key findings:
- First Nations people are more likely to be diagnosed with low-survival and rare cancers, contributing to their lower overall 5-year relative cancer survival
- First Nations cancer mortality rates have decreased over time, and at faster rates than for non-Indigenous people, starting to narrow the gap. Deaths for First Nations people decreased from 148 to 105 deaths per 100,000 people between 2011 and 2025; non-Indigenous rates decreased from 77 to 58 deaths per 100,000 over the same time.
- Lung cancer is the most frequently diagnosed cancer among First Nations people and the leading cause of cancer death, responsible for one quarter (26%) of all First nations cancer deaths. The incidence and mortality rates of liver cancer among First Nations populations are three times higher than the non-Indigenous population, and rising.
- For women with breast cancer, survival rates were similar for First Nations and non-Indigenous women with smaller tumours, suggesting that diagnosis when cancers are more progressed may contribute to First Nations lower 5-year relative breast cancer survival rates
- First Nations cervical cancer incidence rates for younger populations have moved closer to the non-Indigenous rates over time
Following general discussion of cancer in First Nations people, the following cancers are discussed in the selected cancers section.
- All blood cancers combined
- Breast cancer (females)
- Cervical cancer
- Colorectal (bowel) cancer
- Lung cancer
- Liver cancer
- Melanoma of the skin
- Oesophogeal cancer
- Pancreatic cancer
- Prostate cancer
- Rarity (cancer by)
- Uterine cancer
About the new First Nations cancer data
The new First Nations cancer data aims to match the depth of existing national reporting focusing specifically on First Nations peoples. It includes as many types of cancer as possible, acknowledging that rare and less common cancers together affect many individuals. In 2025, it is estimated that around 30% of cancers diagnosed among the First Nations population were rare or less common cancers, compared to roughly 25% in the non-Indigenous population.
Rare Cancers Australia notes several of the specific challenges presented by rare and less common cancers. These include:
- late diagnosis
- unclear prognosis
- limited research or clinical expertise
- barriers to treatment including high out-of-pocket costs, fewer treatment options, and a lack of rural and remote services
- poorer survival outcomes compared to common cancers (RCA, 2025).
Reporting cancer by age is vital but difficult for small populations, as trends can vary significantly by age group. The new First Nations data allows such insights to be examined. For example, in Australia, while overall colorectal cancer incidence is declining, it is rising among younger people. First Nations cancer data does not show the same level of decline in older ages, but rates are increasing for people in their 30s and 40s. Because the First Nations population is younger on average, these increases in youth cancers have a greater relative impact on the First Nations population.
The latest First Nations cancer data uses life tables by Indigenous status and age-adjusted rates to offer clearer insights into survival outcomes. In 2017–2021, the 5-year relative survival rate was 58% for First Nations people compared to about 76% for non-Indigenous individuals. This gap is largely due to First Nations people being more often diagnosed with lower-survival cancer types and less often with higher-survival ones. While overall survival outcomes are lower for First Nations people, some cancers show similar outcomes, especially when tumour size is considered.
Critical for establishing how cancer in the First Nations population is changing, the new data provides cancer incidence and mortality trends. In 2025, First Nations cancer age-standardised mortality is estimated at 105 deaths per 100,000 people, higher than the non-Indigenous rate of 58. However, mortality rates for First Nations people in 2011 were around 148 deaths per 100,000 people while the non-Indigenous rate was 77. The First Nations have been decreasing faster than those for the non-Indigenous population and narrowing the gap.
Incidence and mortality rates are based on data from 6 states and territories
First Nations national cancer estimates are based on the age-specific rates of the combined New South Wales, Queensland, Victoria, Western Australia, Northern Territory and Australian Capital Territory being applied to the First Nations populations of South Australia and Tasmania. South Australia and Tasmania do not have sufficient completeness of Indigenous status to report upon. In 2021, the populations from the 6 jurisdictions included accounted around 90% of the First Nations population.
More investigations are planned by the AIHW in future to refine national First Nations cancer estimates. National estimates of First Nations cases and deaths have been estimated and appear in the following section. More work will be done to refine these in future.
First Nations cancer incidence and mortality rankings
Lung cancer is the most frequently diagnosed cancer among First Nations people
In 2025, AIHW estimates there were around 3,600 cases of cancer diagnosed in First Nations people. Around 1,900 of these cases were for males while around 1,700 cases were for females (Table 1).
In 2025, prostate cancer was projected to be the most common cancer among First Nations males, breast cancer for females, and lung cancer across the First Nations population. Lung cancer was the fourth most diagnosed cancer in Australia overall. Liver cancer ranked fourth for First Nations males and ninth for Australian males (see Table 1).
Table 1: First Nations most diagnosed cancer types, by sex, 2025
First Nations Rank | Males - Cancer and Australian rank | Males -Cases | Females -Cancer and Australian rank | Females - Cases | Persons - Cancer and Australian rank | Persons -Cases |
|---|---|---|---|---|---|---|
1 | Prostate cancer (1) | 388 | Breast cancer (1) | 340 | Lung cancer (4) | 559 |
2 | Lung cancer (4) | 277 | Lung cancer (2) | 282 | Prostate cancer (1) | 388 |
3 | Colorectal cancer (3) | 200 | Colorectal cancer (4) | 133 | Breast cancer (2) | 344 |
4 | Liver cancer (9) | 106 | Uterine cancer (5) | 103 | Colorectal cancer (5) | 334 |
5 | Melanoma of the skin (2) | 82 | Melanoma of the skin (3) | 90 | Melanoma of the skin (3) | 172 |
6 | Kidney cancer (6) | 69 | Thyroid cancer (6) | 80 | Liver cancer (12) | 162 |
7 | Pancreatic cancer (8) | 62 | Liver cancer (16) | 57 | Thyroid cancer (9) | 116 |
8 | Non-Hodgkin lymphoma (5) | 58 | Pancreatic cancer (8) | 47 | Pancreatic cancer (8) | 109 |
9 | Bladder cancer (7) | 45 | Non-Hodgkin lymphoma (7) | 46 | Non-Hodgkin lymphoma (6) | 104 |
10 | Oesophageal cancer (15) | 43 | Cervical cancer (14) | 45 | Uterine cancer (10) | 103 |
Total |
| 1,894 |
| 1,673 |
| 3,567 |
Notes:
- Data up to 2021 are actuals, exclude South Australia and Tasmania and use imputation to derive Indigenous status where Indigenous status is unknown (for the reporting states and territories).
- Data for 2022 to 2025 are projections based on the data noted in Note 1. Projections are rounded and rounding may result in cases for males plus females not equaling persons.
Source: 2021 Australian Cancer Database
In 2025, approximately 1,200 First Nations individuals died from cancer, with more than one quarter of these deaths attributed to lung cancer.
In 2025, it is estimated there were around 1,200 deaths from cancer in the First Nations population. First Nations cancer mortality differs from deaths occurring in Australia more generally:
- Lung cancer was estimated to account for just over one quarter of all First Nations cancer deaths (26%), it is estimated to account for around 17% of Australian cancer deaths.
- Liver cancer is the 3rd most common cancer causing death for First Nations people, it is the 6th in Australia.
- Cervical cancer is the 7th most common cancer causing death for First Nations females but is the 20th for Australian females.
Table 2: First Nations most common cancers causing death, by sex, 2025
First Nations Rank | Males - Cancer and Australian rank | Males -Deaths | Females -Cancer and Australian rank | Females -Deaths | Persons - Cancer and Australian rank | Persons -Deaths |
|---|---|---|---|---|---|---|
1 | Lung cancer (1) | 170 | Lung cancer (1) | 143 | Lung cancer (1) | 313 |
2 | Colorectal cancer (3) | 75 | Breast cancer (2) | 69 | Colorectal cancer (2) | 107 |
3 | Liver cancer (5) | 70 | Pancreatic cancer (4) | 46 | Liver cancer (6) | 101 |
4 | Pancreatic cancer (4) | 55 | Liver cancer (10) | 31 | Pancreatic cancer (3) | 101 |
5 | Prostate cancer (2) | 52 | Colorectal cancer (3) | 31 | Breast cancer (5) | 70 |
6 | Unknown primary site (9) | 33 | Uterine cancer (8) | 26 | Unknown primary site (8) | 53 |
7 | Oesophageal cancer (11) | 27 | Cervical cancer (20) | 22 | Prostate cancer (4) | 52 |
8 | Kidney cancer (16) | 20 | Unknown primary site (6) | 20 | Oesophageal cancer (12) | 38 |
9 | Brain cancer (8) | 19 | Ovarian cancer (5) | 16 | Bladder cancer (14) | 29 |
10 | Bladder cancer (12) | 17 | Stomach cancer (13) | 14 | Kidney cancer (18) and non-Hodgkin lymphoma (7) | 27 |
Total |
| 674 |
| 539 |
| 1,213 |
Notes:
- Data up to 2021 are actuals, exclude South Australia and Tasmania and use imputation to derive Indigenous status where Indigenous status is unknown (for the reporting states and territories).
- Data for 2022 to 2025 are projections based on the data noted in Note 1. Projections are rounded and rounding may result in cases for males plus females not equaling persons.
- Ovarian cancer includes serous carcinomas of the fallopian tube.
Source: 2021 Australian Cancer Database
First Nations cancer incidence and mortality changes over time
Cancer and mortality rates among First Nations are complicated, and the reported trends contain some uncertainty. The analysis within this overview reflects a specific interpretation; additional discussion of these uncertainties can be found in Cancer data commentary 13 but are also summarized in the box below.
First Nations population changes over time
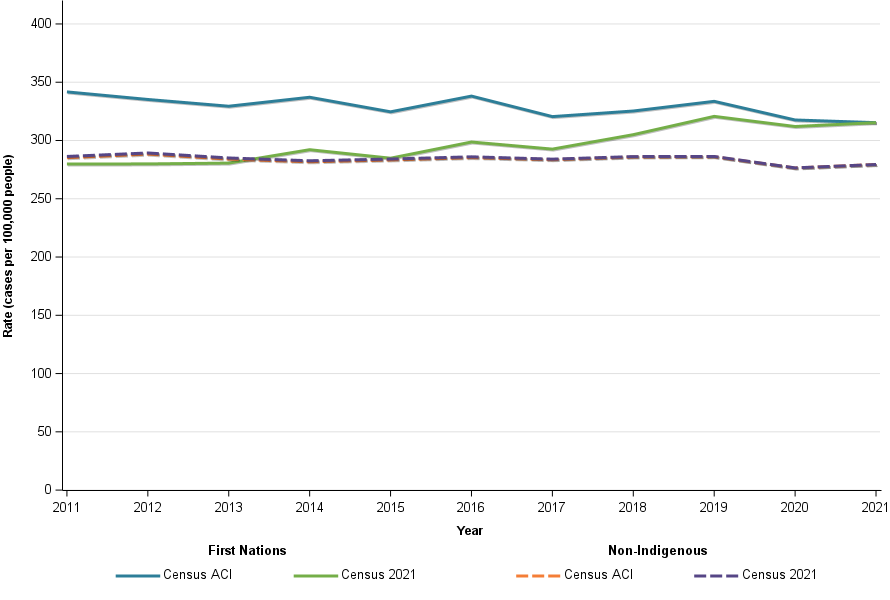
The First Nations estimated population counts are based on Australian Census counts. The First Nations population counts in the 2016 and 2021 Censuses both increased from the previous Census, with a considerable component of the change due to many more people self-identifying as being of Aboriginal and Torres Strait Islander origin. Increasing identification is also thought to be likely to occur within the cancer data. Cancer incidence and mortality rates are calculated from the count of cancer cases (the numerator) and the First Nations population estimates (the denominator). If the Census 2021 back-cast population is used, then the numerator is likely to have increasing identification while the denominator does not. The impact of this is that the increasing identification within the cancer data appears like increasing rates of cancer whereas, it is likely to be at least partly due to increasing identification.
Within this overview, the cancer incidence and mortality rates are derived using the cancer data and the Census adjusted for changing identification. When this is done, both the numerator and denominator have actual change and change in identification. There remains uncertainty regarding how similar the identification change in the numerator and denominator are. However, when used, First Nations cancer incidence and mortality trends often move away from being quite different to those for non-Indigenous people to instead being much more similar. The Census adjusted for changing identification uses the 2011 Census First Nations population rates for 2011 cancer data, 2016 Census for 2016 cancer data and the 2021 Census for 2021 cancer data. In doing so, it works on the premise that First Nations identification within the cancer data was around the same as it was for the Census of the time.
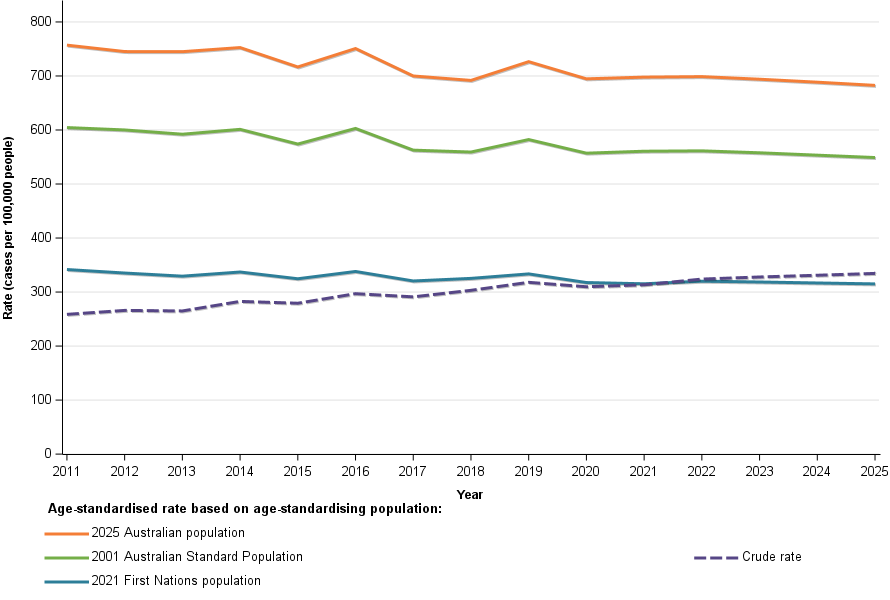
Rates have been standardised to the 2021 First Nations population; this rationale is addressed in detail at the conclusion of this paper. Further information, including the application of imputation for unspecified Indigenous status, can be found in Cancer data commentary 13.
First Nations people experience higher cancer rates, are more often diagnosed with cancers that have lower survival rates, and less often with those that have higher survival rates.
Age-standardised cancer incidence rates for First Nations people decreased from 342 cases per 100,000 people in 2011 to a projected 315 cases per 100,000 in 2025. Non-Indigenous people’s rates dropped from 285 to 281 cases per 100,000 during the same period. Although First Nations rates remain higher, the gap compared to non-Indigenous rates are slowly narrowing (Figure 1).
Low survival cancers are those with a 5-year survival rate of less than 30% across the whole Australian population. First Nations people have around twice the age-standardised rate of low survival cancers combined than non-Indigenous people. For higher survival cancers combined —defined in this report as 5-year survival 90% or higher— First Nations age-standardised incidence rates were estimated to be around 28% lower than the non-Indigenous population in 2025 (Figure 1).
Figure 1: Age-standardised cancer incidence, by Indigenous status, 2011 to 2025, persons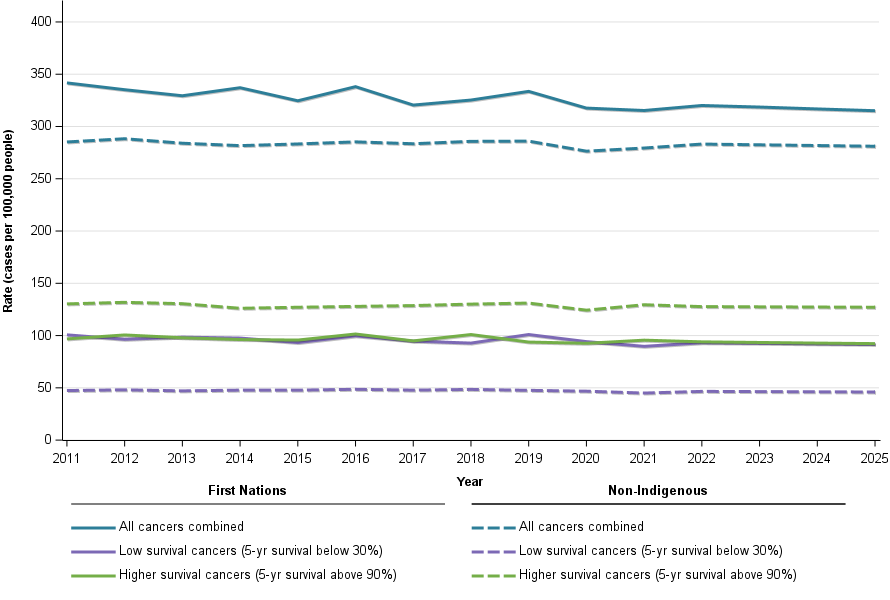
Notes:
- Data up to 2021 are actuals, exclude South Australia and Tasmania and use imputation to derive Indigenous status where Indigenous status is unknown (for the reporting states and territories).
- Data for 2022 to 2025 are projections based on the data noted in Note 1.
Source: 2021 Australian Cancer Database
First Nations cancer mortality rates are decreasing
Both First Nations and non-Indigenous cancer mortality rates are decreasing, with reductions in First Nations mortality rates appearing greater. First Nations rates decreased from 148 to 105 deaths per 100,000 people between 2011 and 2025 and non-Indigenous rates decreased from 77 to 58 deaths per 100,000 over the same time.
While First Nations people are less likely to be diagnosed with higher survival cancers, they are more likely to die from these cancers than the non-Indigenous population. In 2025, it is estimated that the rate of First Nations higher survival cancers is 92 cases per 100,000 people, well below the non-Indigenous rate of 127 cases per 100,000 people. However, the estimated mortality rate in 2025 for high survival cancers was 11.9 deaths per 100,000 people, and greater than the non-Indigenous rate of 8.8 deaths per 100,000 people.
First Nations cancer incidence rates were on average around double the non-Indigenous rate for low survival cancers combined (in 2025, First Nations low survival cancer incidence rates were 92 cases per 100,000 people and non-Indigenous were 46 cases per 100,000 people); for mortality was more than double the rate (in 2025, the estimated First Nations low survival cancer mortality rate were 58 deaths per 100,000 people and non-Indigenous were 27 deaths per 100,000 people . Low survival cancers account for most First Nations cancer deaths.
Survival time series by Indigenous status are unavailable, but mortality-to-incidence rate ratios indicate survival is improving for both groups. In 2011, First Nations people had a ratio of about 0.43, projected to drop to 0.33 by 2025. For low-survival cancers, their rate ratios changed from approximately 0.80 to 0.63.
About mortality to incidence rate ratios
The mortality to incidence rate ratio (MIR) is the age-standardised mortality rate divided by the age-standardised incidence rate. Because First Nations cancer survival time series are not available, the mortality to incidence rate ratios are used to provide some broad insights into whether cancer survival is likely to be improving for First Nations people (noting that MIRs are not true survival calculations). Where a ratio is high, the survival rate is generally likely to be low, and the opposite applies where a ratio is low. Where ratios are reducing over time, it is likely that survival rates are increasing, and the opposite applies for decreasing ratios.
Figure 2: Age-standardised cancer mortality, by Indigenous status, 2011 to 2025, persons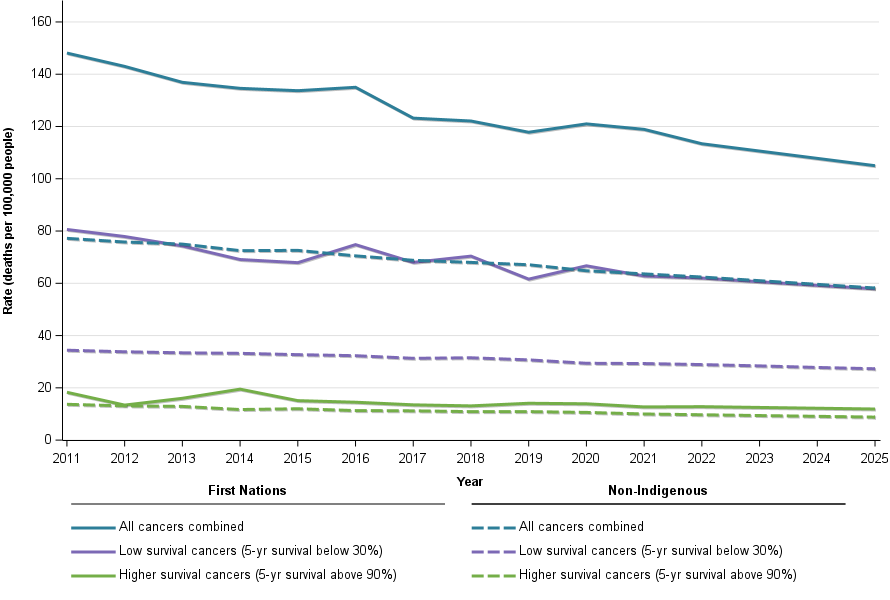
Notes:
- Data up to 2021 are actuals, exclude South Australia and Tasmania and use imputation to derive Indigenous status where Indigenous status is unknown (for the reporting states and territories).
- Data for 2022 to 2025 are projections based on the data noted in Note 1.
Source: 2021 Australian Cancer Database
Greater proportions of low survival cancers contribute to lower overall cancer survival for First Nations people
Between 2017 and 2021, the five-year relative survival rate for all cancers combined was 58% among First Nations individuals, compared to 76% in the non-Indigenous population. This disparity is greatly influenced by the distribution of cancer types within the ‘All cancers combined’ category for First Nations, which includes a higher proportion of cancers with low survival rates and a lower proportion of cancers with high survival rates.
First Nations people tend to have lower survival rates for most cancers mentioned in this report. While overall cancer survival is generally poorer, the gap between First Nations and non-Indigenous people becomes smaller when comparing survival rates for specific types of cancer.
First Nations people may experience lower cancer survival rates due to diagnoses occurring at more advanced stages.
Table 3 shows survival rates for certain cancers. Among First Nations individuals, the 5-year relative survival is lower for these cancers, and this trend is also apparent in 1-year survival rates as well. Lower 1-year survival suggests that cancers are being diagnosed at more advanced stages. Future investigations will also examine whether there are any differences in cancer histology, since this may also contribute to some of the variations in survival rates.
Table 3: 1- and 5-year relative survival rates, selected cancers, by Indigenous status, 2017 - 2021, persons
Cancer | First Nations (5-year) | Non-Indigenous (5-year) | First Nations (1-year) | Non-Indigenous (1-year) |
|---|---|---|---|---|
Lung cancer | 20.9% | 30.1% | 46.8% | 57.5% |
Breast cancer - females | 87.3% | 93.2% | 96.7% | 98.6% |
Prostate cancer - males | 93.1% | 97.1% | 98.6% | 99.4% |
Pancreatic cancer | 8.8% | 19.0% | 30.7% | 47.0% |
Liver cancer | 14.0% | 29.4% | 46.2% | 57.4% |
Cervical cancer (females) | 66.6% | 79.5% | 80.6% | 92.6% |
Acute myeloid leukaemia | 34.7% | 48.3% | 48.2% | 66.9% |
Note:
1. Non-Indigenous rates are age-adjusted to the age composition of the First Nations population included within the survival calculations.
2. Developmental life tables by Indigenous status are used to derive relative survival.
Source: 2021 Australian Cancer Database
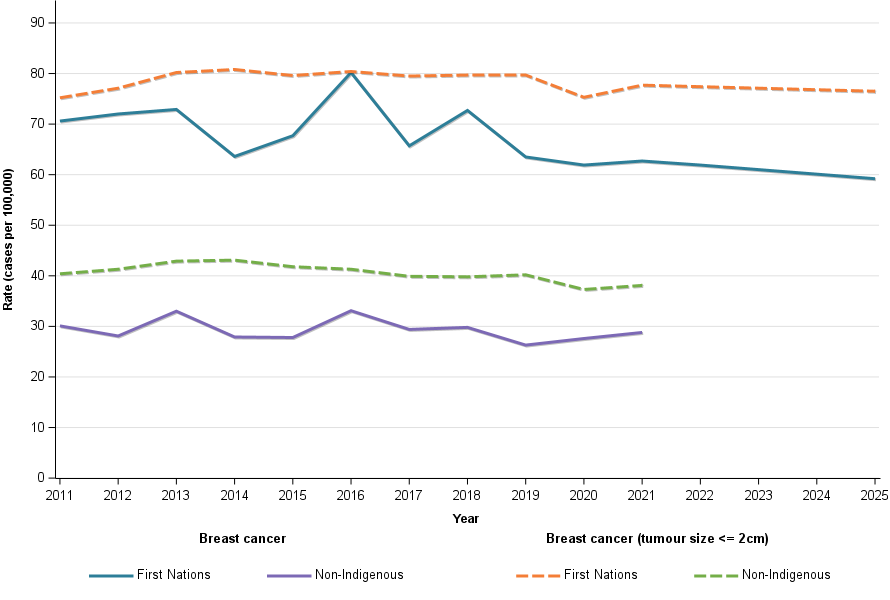
The Australian Cancer Database typically does not include information about cancer stage at diagnosis. However, data on breast cancer by tumour size is available, offering some insight into how far cancers had advanced when detected. While breast cancer incidence rates are lower among First Nations people compared to non-Indigenous Australians, this difference is mainly due to fewer diagnoses of tumours that are 2cm or smaller. Incidence rates for larger tumours are similar between both groups.
For females, breast cancer 5-year relative survival for the First Nations population is 87% and it is 93% for non-Indigenous females. Table 4 highlights that when tumour size is considered, the First Nations cancer survival rates are no more than 3 percentage points lower. For breast cancer, the 6-percentage point difference in 5-year survival appears to be influenced by the greater proportion of non-Indigenous females being diagnosed with breast cancers with a smaller tumour size. Survival rates where the tumour size is unknown are very different and will contribute to the difference in breast cancer survival. However, if the closeness of survival where tumour size is known suggests quite close survival for similar sized tumours, the First Nations tumour sizes in unknown tumour size are likely to be larger.
Table 4: 1- and 5-year relative survival rates, breast cancer by tumour size, by Indigenous status, 2017 - 2021, females
Cancer | First Nations (5-year) | Non-Indigenous (5-year) | First Nations (1-year) | Non-Indigenous (1-year) |
|---|---|---|---|---|
Breast cancer | 87.3% | 93.2% | 96.7% | 98.6% |
Tumour size <= 2cm | 99.5% | 99.6% | 100% | 100% |
Tumour size >2cm and <= 5cm | 93.0% | 94.4% | 99.5% | 100% |
Tumour size > 5cm | 82,6% | 85.6% | 97.3% | 98.2% |
Tumour size unknown | 53.5% | 70.2% | 83.4% | 90.8% |
Note:
1. Non-Indigenous rates are age-adjusted to the age composition of the First Nations population included within the survival calculations.
2. Developmental life tables by Indigenous status are used to derive relative survival.
Source: 2021 Australian Cancer Database
First Nations cancer mortality rates have decreased over time
In general, the time-series trends of cancer incidence are quite similar for both First Nations and non-Indigenous populations. Cancer mortality rates among First Nations people have also declined over time, much like in the non-Indigenous population. The reduction in First Nations cancer mortality rates between 2011 and the projected figures for 2025 suggests that the gap in mortality has somewhat narrowed, though it still remains large. In 2025, the rate is expected to be roughly twice as high as that of the non-Indigenous population (Figure 3).
Figure 3: Age-standardised cancer incidence and mortality, by Indigenous status, by sex, 2011 to 2025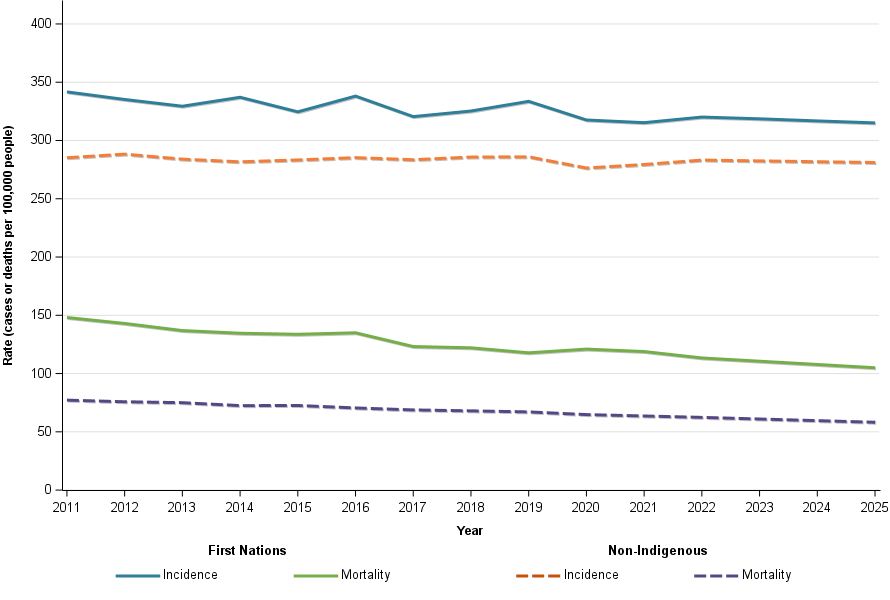
Notes:
- Data up to 2021 are actuals, exclude South Australia and Tasmania and use imputation to derive Indigenous status where Indigenous status is unknown (for the reporting states and territories).
- Data for 2022 to 2025 are projections based on the data noted in Note 1.
Source: 2021 Australian Cancer Database
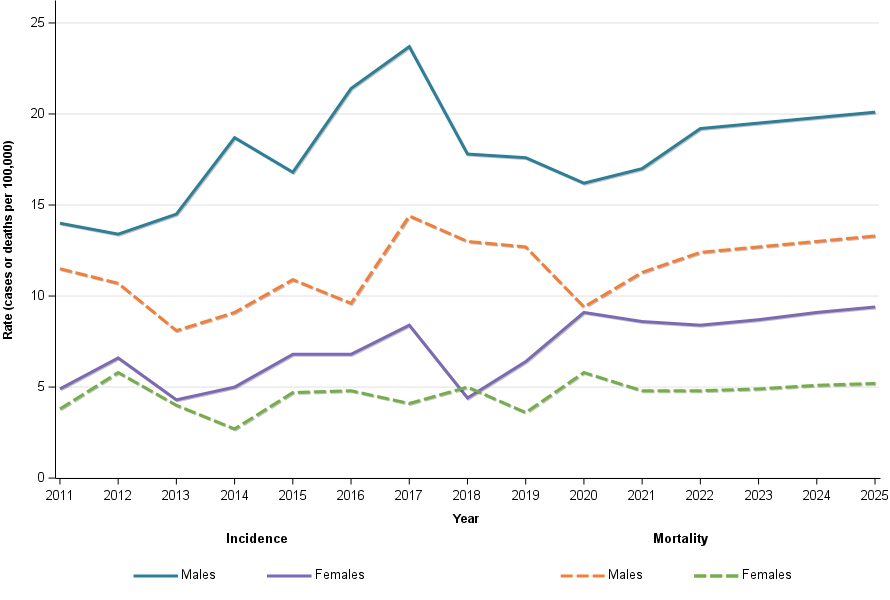
Cancer incidence and mortality trends for First Nations men and women are similar, both showing declines from 2011 to 2025. Mortality rates have decreased more than incidence rates, indicating improved survival. In 2011, mortality-to-incidence ratios were about 0.47 for males and 0.41 for females; by 2025, they are projected to drop to 0.35 and 0.31, respectively (Figure 4).
Figure 4: Age-standardised cancer incidence and mortality rates, First Nations population, by sex, 2011 to 2025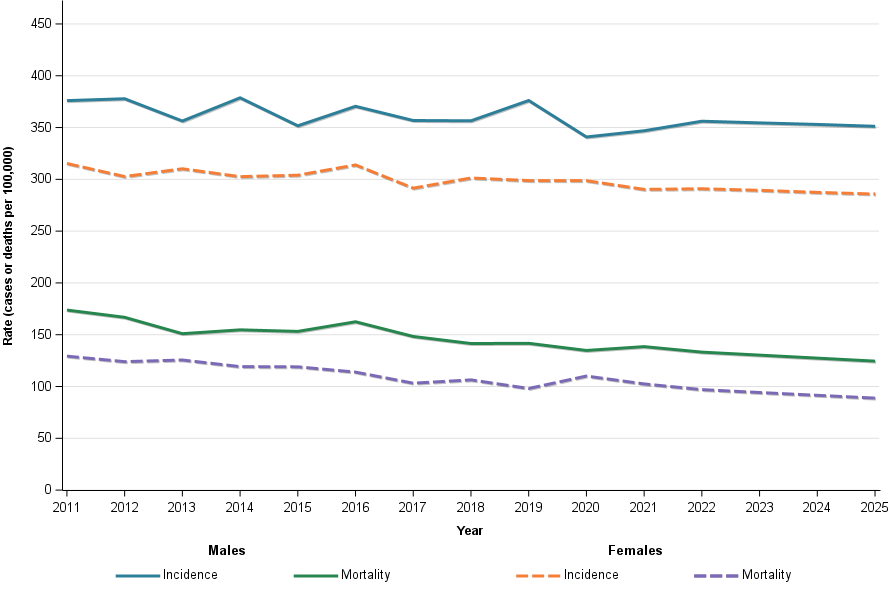
Notes:
- Data up to 2021 are actuals, exclude South Australia and Tasmania and use imputation to derive Indigenous status where Indigenous status is unknown (for the reporting states and territories).
- Data for 2022 to 2025 are projections based on the data noted in Note 1.
Source: 2021 Australian Cancer Database
Cancer incidence, mortality and survival for selected cancers
First Nations lung cancer mortality rates decreased over time
Male lung cancer incidence rates have declined from 2011 to 2025, while female rates have been steady and are slightly rising. These patterns mirror the Australian population overall, with opposing trends by sex resulting in stable total lung cancer incidence. Meanwhile, mortality rates for both sexes have been decreasing (Figure 5).
Figure 5 Age-standardised cancer incidence and mortality rates, First Nations people, by sex, 2011 to 2025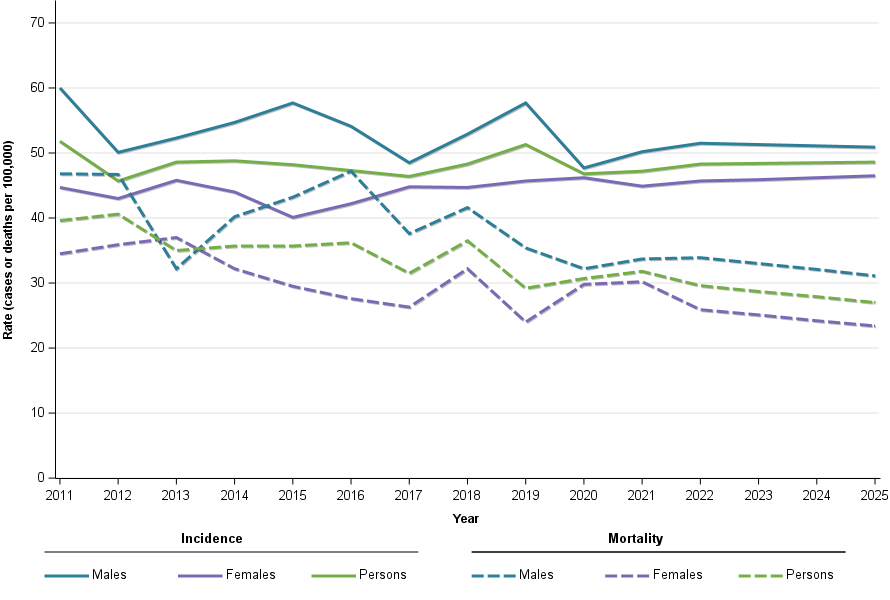
Notes:
- Data up to 2021 are actuals, exclude South Australia and Tasmania and use imputation to derive Indigenous status where Indigenous status is unknown (for the reporting states and territories).
- Data for 2022 to 2025 are projections based on the data noted in Note 1.
Source: 2021 Australian Cancer Database
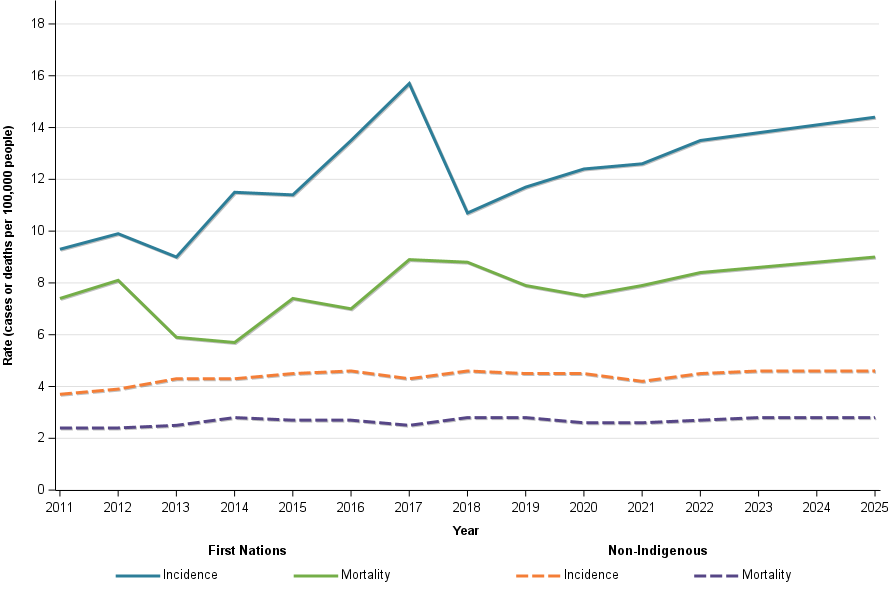
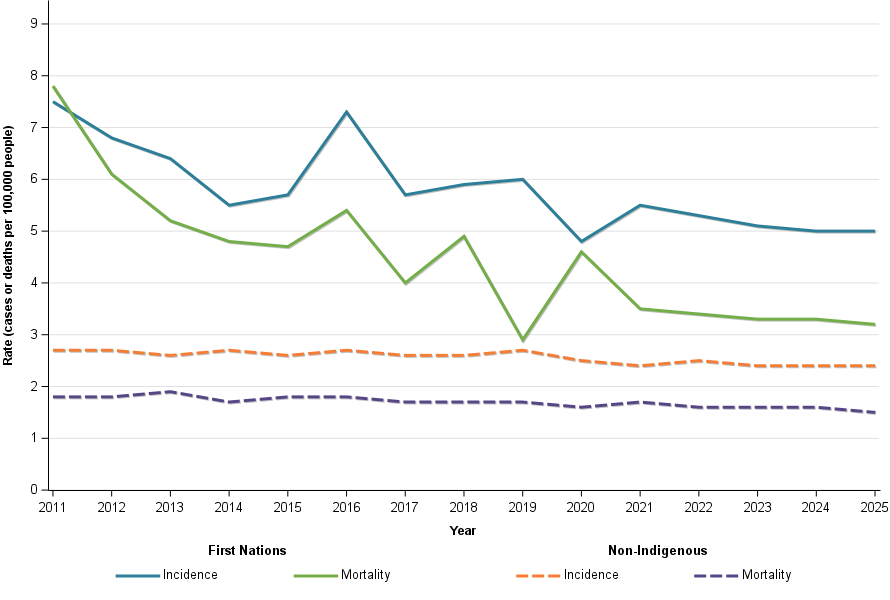
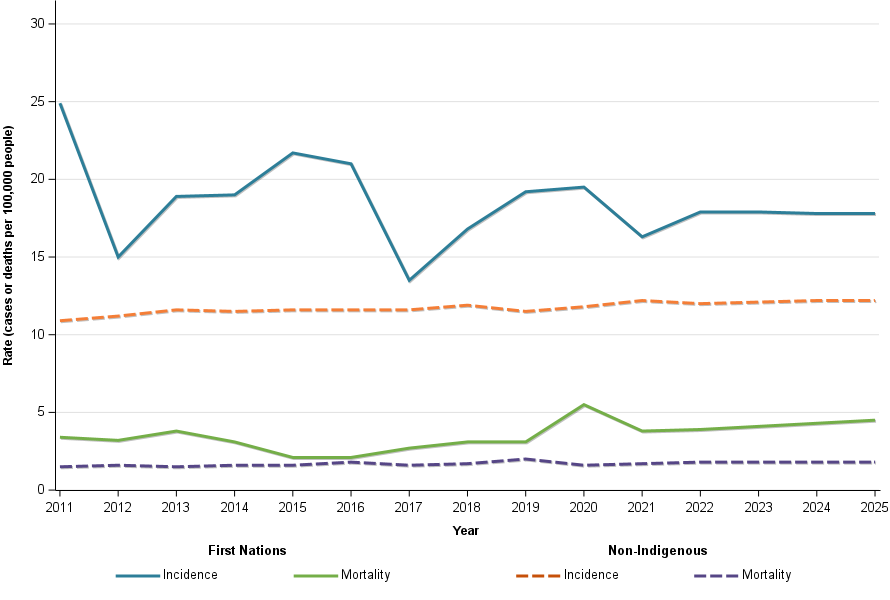
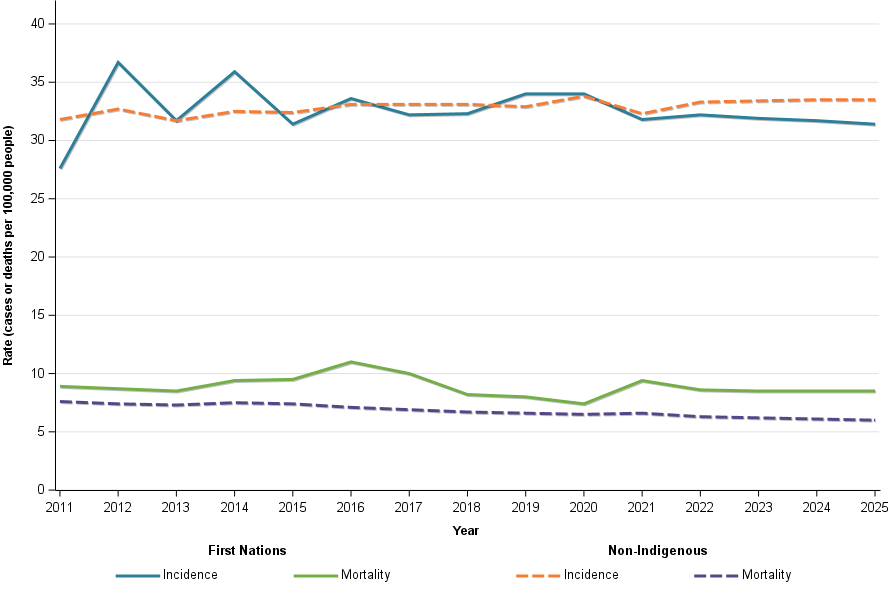
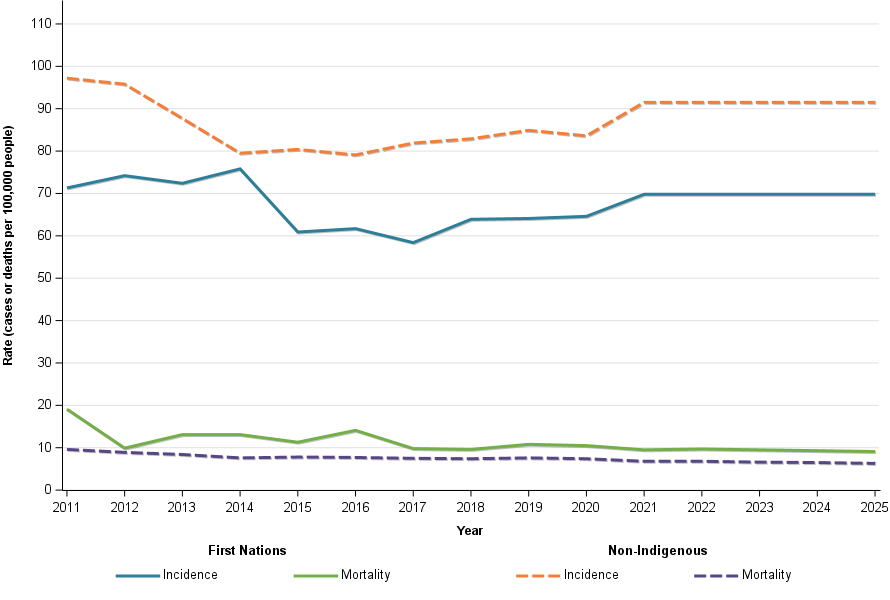
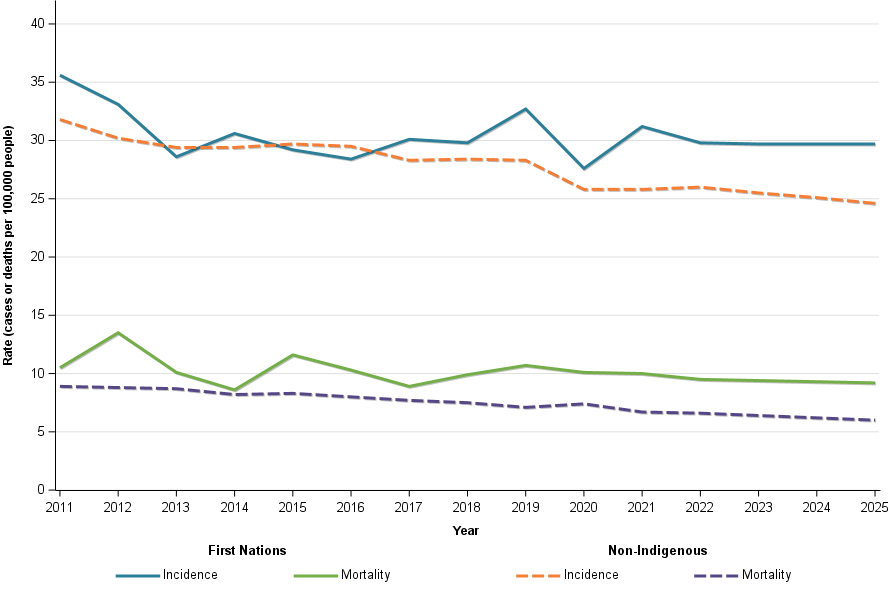
The lung cancer incidence and mortality trends of the First Nations and non-Indigenous populations are quite similar. That is, relatively stable to slightly decreasing incidence and decreasing mortality rates. The incidence and mortality lung cancer rates for First Nations people are however over twice as high for First Nations people and so too are the mortality rates.
Figure 6 Age-standardised cancer incidence and mortality rates, by Indigenous status, 2011 to 2025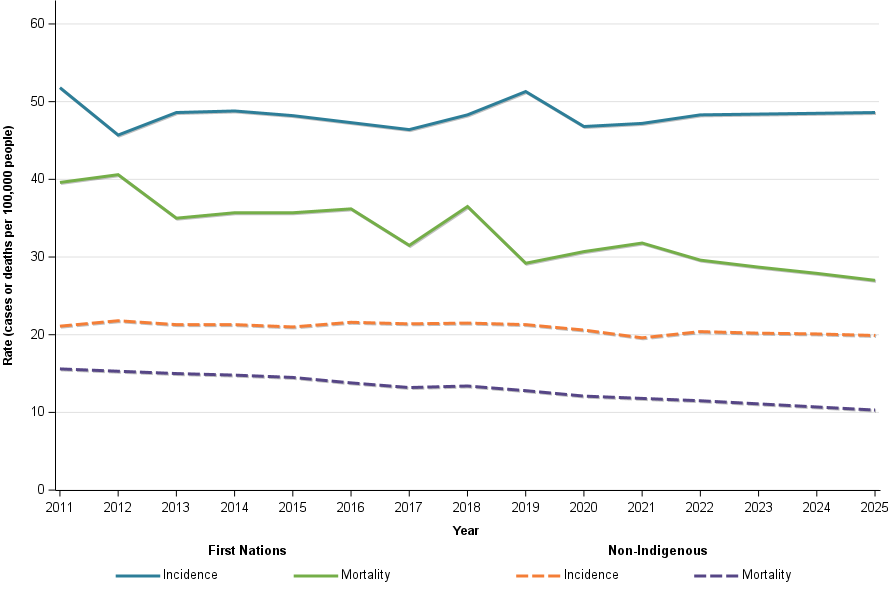
Notes:
- Data up to 2021 are actuals, exclude South Australia and Tasmania and use imputation to derive Indigenous status where Indigenous status is unknown (for the reporting states and territories).
- Data for 2022 to 2025 are projections based on the data noted in Note 1.
Source: 2021 Australian Cancer Database
The disparity between First Nations and non-Indigenous lung cancer incidence rates becomes apparent from the 30-39 age group and older
Lung cancer rates rise with age. For all groups under 30, incidence is less than 1 case per 100,000 people. Among those aged 30–39, First Nations have over twice the rate of non-Indigenous people (3.9 vs 1.7 per 100,000). In the 40–49 group, First Nations rates are more then four times higher (36 vs 8 per 100,000), and First Nations 40s rate is closer to the non-Indigenous rate for people in their 50s than in their 40s. By their 50s, First Nations reach 134 cases per 100,000, just over the non-Indigenous rates a decade older. In their 60s and 70s, First Nations also exceed the non-Indigenous population 10 years older (Table 5).
Table 5: Lung cancer age-specific incidence rates (cases per 100,000 persons), by Indigenous status, 2025
Age group | First Nations | Non-Indigenous |
|---|---|---|
30 to 39 years | 3.9 | 1.7 |
40 to 49 years | 36.4 | 8.0 |
50 to 59 years | 133.7 | 42.9 |
60 to 69 years | 319.1 | 126.0 |
70 to 79 years | 504.7 | 256.3 |
80 years and over | 366.0 | 293.0 |
Notes:
- Data up to 2021 are actuals, exclude South Australia and Tasmania and use imputation to derive Indigenous status where Indigenous status is unknown (for the reporting states and territories).
Source: 2021 Australian Cancer Database
First Nations lung cancer 5-year relative survival is around a quarter less than the non-Indigenous population
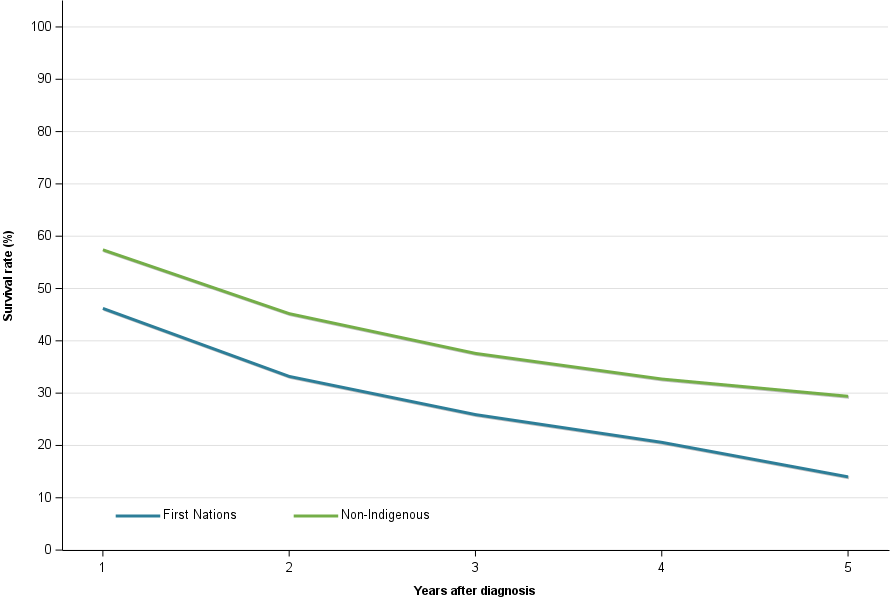
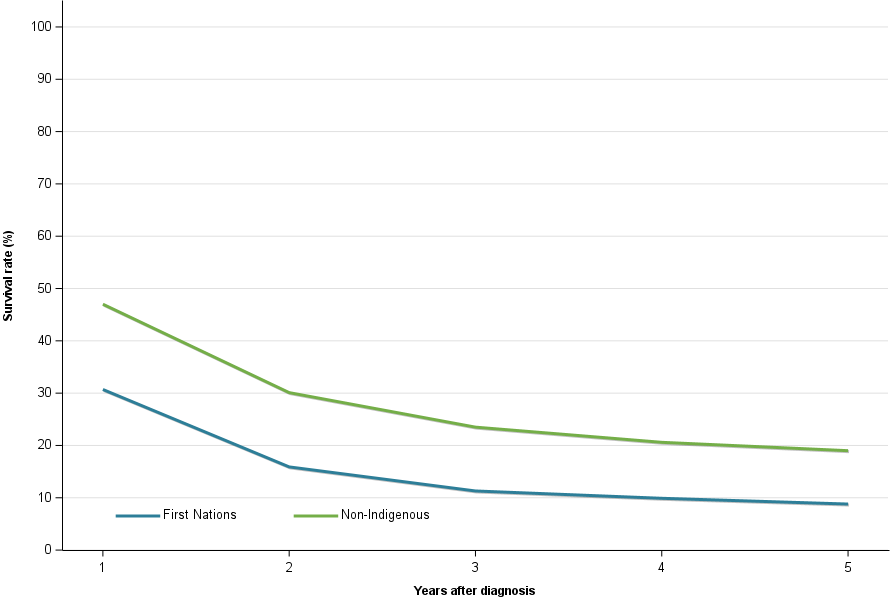
Lung cancer is a low survival cancer. High lung cancer incidence rates for First Nations people are also accompanied by lower survival rates than for the non-Indigenous population. In 2017–2021, lower relative survival is apparent for all survival periods from 1-year (47% compared to 58%) to 5-year (21% compared to 30%).
Figure 7: Lung cancer 5-year relative survival, by Indigenous status, persons, 2017–2021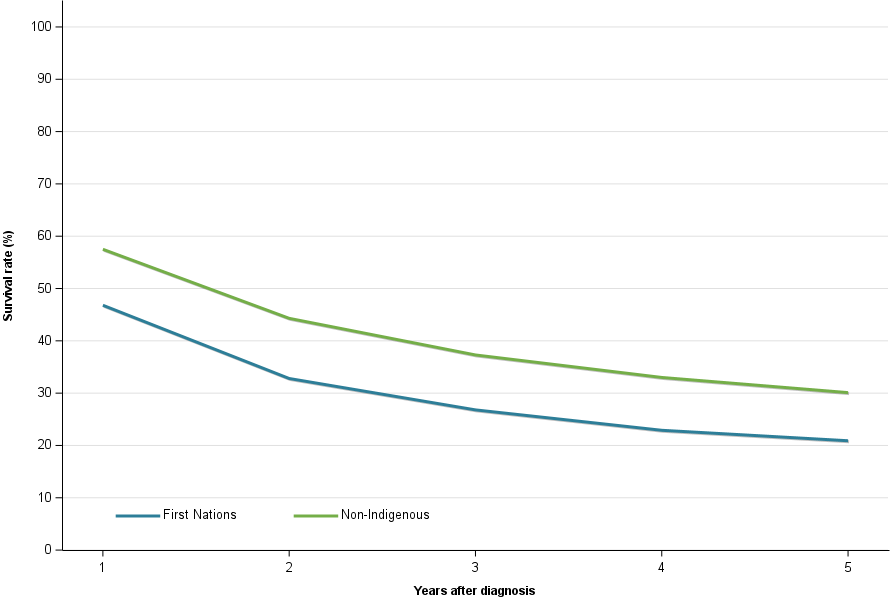
Note:
1. Non-Indigenous rates are age-adjusted to the age composition of the First Nations population included within the survival calculations.
2. Developmental life tables by Indigenous status are used to derive relative survival.
Source: 2021 Australian Cancer Database