How are pancreatic cancer rates changing?
Cancer data commentary no. 3
This commentary discusses trends in pancreatic cancer incidence, mortality and survival, in particular, changes that have occurred since around 2000.
The pancreas is located near the stomach; it produces enzymes that aid digestion and hormones that regulate blood sugar levels. Pancreatic cancer occurs when abnormal cells in the pancreas multiply out of control and form a tumour.
Pancreatic cancer has very low survival rates and is becoming more commonly diagnosed. Research indicates that the poorer outcomes associated with pancreatic cancer are primarily due to its presentation at an advanced stage. Early stages of pancreatic cancer do not usually produce symptoms, so it is generally advanced when it is diagnosed (AIHW 2012).
Terms used
Incidence rates refer to the rate of pancreatic cancer cases diagnosed.
Mortality rates refer to the rate of death from pancreatic cancer.
Projections are estimates for the most recent years (2017–2020 for incidence and 2019–2020 for mortality). Estimates are derived based on trends from the previous 10 years of actual data. Where this commentary discusses rates based on projections, the rates are described as ‘estimated’.
For those less familiar with statistical methods and terms, some assistance in their use is provided within the commentary. Please see the methods section of Cancer data in Australia for more detailed information.
Pancreatic cancer trends
The estimated number of pancreatic cancer cases diagnosed per year has more than doubled in 20 years
From 1982, the number of pancreatic cancer cases diagnosed each year was steadily increasing; from 2002, the number of cases continued to increase but overall, increases were greater. Between 1982 and 2002, the number of pancreatic cancer cases diagnosed increased by around 60% (from 1,200 cases in 1982 to 1,900 in 2002). It is estimated that the number of pancreatic cancer cases diagnosed in 2020 will be more than double those of 2002 (estimated 3,900 cases in 2020) (Figure 1). This increase in incidence from 2002 is attributable to general population growth, an ageing population and pancreatic cancer becoming more commonly diagnosed across various age groups.
Figure 1: Pancreatic cancer cases diagnosed, persons, 1982–2020
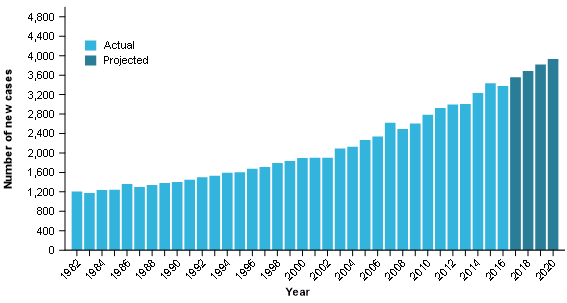
Source: AIHW Australian Cancer Database 2016
The ageing population places upwards pressure on pancreatic cancer case numbers
The Australian population continues to increase but the growth is not uniform across age groups. With life expectancy increasing, more people are living to older ages than in the past and older populations are growing at a faster pace than younger populations and the overall population growth.
Older populations experience higher rates of pancreatic cancer. The combination of the size of older populations increasing at greater rates and pancreatic cancer being more common at older ages contributes to the number of cases diagnosed increasing at greater rates than general population growth. A clearer understanding of the influence of the ageing population upon the number of pancreatic cancer cases diagnosed over time can be gained through the following crude and age-standardised incidence rate time series.
Pancreatic cancer incidence rates are increasing
About crude rates – interpreting time series
The crude rate of cancer is the rate of cancer within the population. The crude rate of cancer will remain the same where the rate of cancer increases at the same rate as population growth.
Given that pancreatic cancer more commonly occurs in older people and the size of older populations is increasing at a faster rate than general population growth, there is a regular upwards pressure on crude rates.
Crude incidence rates for pancreatic cancer increased from 7.9 cases per 100,000 persons in 1982 to 9.8 cases per 100,000 people in 2002; most of the increase during this time is attributable to impacts of an ageing population. By 2020, crude rates are estimated to reach 15 cases per 100,000; this increase is attributable to both the ageing population and pancreatic cancer becoming more commonly diagnosed across various age groups (Figure 2).
About age-standardised rates – interpreting time series
Like crude rates, age-standardised rate time series focus on changes to cancer rates. Unlike crude rates, they remove the impact of changes to the age composition of the population (such as impacts due to the ageing population).
An increase in age-standardised rates indicates that overall cancer rates are increasing and there are ages for which the cancer is becoming more commonly diagnosed (and vice versa for decreasing age-standardised rates).
Whether an age-standardised rate is increasing, decreasing or remaining stable, it only indicates overall movement. Some rates among individual age groups may not be moving in the same direction as the overall age-standardised cancer rates.
Between 1982 and 2002, age-standardised incidence rates were stable and ranged between 9.6 cases per 100,000 people and 10.3 cases per 100,000 people (Figure 2).
Age-standardised incidence rates began to increase from 2002. It is estimated that age-standardised incidence rates for pancreatic cancer in Australia will be 12.5 cases per 100,000 persons by 2020 (Figure 2).
Figure 2: Pancreatic cancer age-standardised and crude incidence rates, persons, 1982–2020
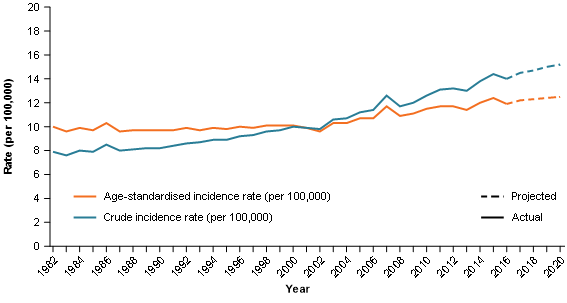
Source: AIHW Australian Cancer Database 2016
The median age at diagnosis has fallen
The median age at diagnosis had been increasing from 1982.These increases slowed from the late 90’s and began to decrease from 2008 (the median age was 69.6 in 1982, increasing to a peak of 73.9 in 2008 and by 2016 it was 72.8) (Figure 3).
The median age at death from pancreatic cancer has moved in a relatively similar manner in that there has been a general stabilisation from original increases; it differs in that there has not been a drop in median age at death (Figure 3).
Comparability of median age at diagnosis and median age at death
Please note that median age at diagnosis and median age at death are derived from different data sources. The median age at diagnosis time series is more sensitive to change as it is calculated to a month whereas median age at death is only calculated to a year. Comparisons between the two may be impacted by the difference in sensitivity to some extent.
Figure 3: Pancreatic cancer median age at diagnosis and median age at death, persons, 1982–2018
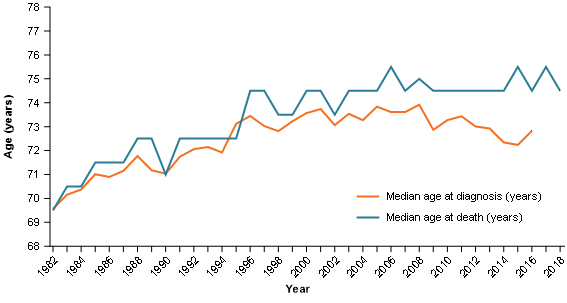
Note: Median age of diagnosis and death are obtained from different data sources. Median age at diagnosis can be calculated to a month while median age at death can only be calculated to a year.
Source: AIHW Australian Cancer Database 2016 and AIHW National Mortality Database
Despite increases in incidence, mortality rate trends remain relatively consistent
Between 1982 and 2020, crude mortality rates ranged between 7.4 cases per 100,000 persons in 1983 and an estimated 12.8 cases per 100,000 persons in 2020. The ageing population is the predominant driver for increasing crude mortality rates (Figure 4).
Between 1982 and 2020, age-standardised mortality rates ranged from 9.2 cases per 100,000 persons in 1982 to 10.4 cases per 100,000 persons in 2017 (Figure 4). While the more recent mortality rates are generally on the higher end of the pancreatic cancer mortality rate range, they have not increased to the same degree as age-standardised incidence rates.
The widening of the gap between incidence and mortality rates indicates improvements in survival rates and the risk data provided later in this commentary help visualise the improvements.
Figure 4: Age-standardised and crude mortality rates, pancreatic cancer, persons, 1982–2020
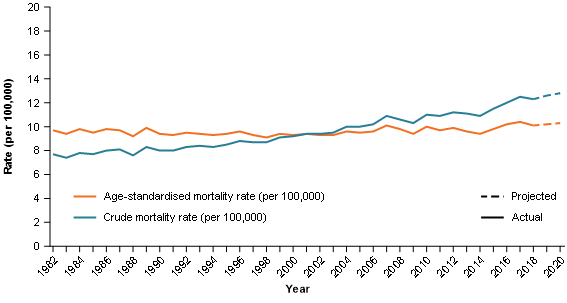
Source: AIHW National Mortality Database
Survival rates remain low but have improved
About relative survival
An observed cancer survival rate is the rate of survival of those diagnosed with cancer. An observed survival rate considers only whether the person has survived for the period in question. It is limited to the extent that it does not take into account the fact that some deaths may have occurred due to causes other than the relevant cancer.
A relative survival rate adjusts the observed survival rate to account for deaths that may be expected to occur in the general population. A relative cancer survival rate is the survival rate of people diagnosed with cancer relative to the survival rate for the general population. A rate of 100% indicates there is no difference between the survival of those diagnosed with cancer and the survival of the general population.
All survival rates referred to in this commentary are relative survival rates. Confidence intervals are available in the supplementary tables.
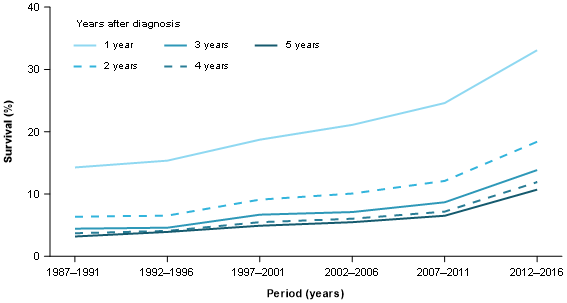
Survival rates for pancreatic cancer are amongst the lowest of all cancers. The 5-year survival rate for all cancers combined (that is, the survival rate of people diagnosed with any type of cancer) in 2012–2016 was around 69%; the equivalent 5-year survival rate for pancreatic cancer was 10.7%.
The 5-year survival rate of 10.7% remains low but it has been improving (6.5% in 2007–2011) and is around 3 times the survival in1987–1991 (3.2%) (Figure 5).
Shorter-term survival rates have improved over time and greater improvement is evident in more recent years. For instance, between 2007–2011 and 2012–16, 1-year survival improved by over 8 percentage points (from 24.6% to 33.1%) (Figure 5).
Figure 5: Relative survival rates, 1–5 years, pancreatic cancer, persons, 1987–1991 to 2012–2016
Source: AIHW Australian Cancer Database 2016
Survival is improving for younger and older populations
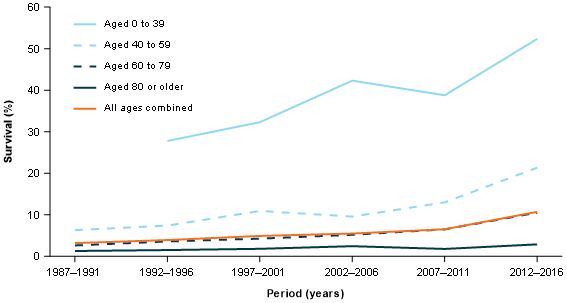
Survival rates for pancreatic cancer decrease as age at diagnosis increases. In 2012–2016 the 5-year survival for people aged 0 to 39 was 52%; the equivalent rate for people aged over 80 was 2.9% (Figure 6).
5-year survival rates have been improving for younger and older age groups. In 1997–2001, the 5-year survival for people aged 0–39 was 32%; by 2012–2016 it had increased to 52%. Across the same time periods, for people aged 40–59 years, survival increased from 11% to 21% and for people aged 60–79, survival has increased from 4.3% to 10.5% (Figure 6).
Of the 16,000 total cases in 2012–2016, around 8,600 (54%) were diagnosed in people aged 60 to 79 years. The 5-year survival rate for pancreatic cancer (all ages) continues to be very close to that of the 60–79 age group. For example, the 5-year survival rate for people aged 60–79 was 10.5% in 2012–2016 and 10.7% for pancreatic cancer overall (all ages combined) (Figure 6).
Figure 6: 5-year relative survival rates, by age, pancreatic cancer, persons, 1987–1991 to 2012–2016
Source: AIHW Australian Cancer Database 2016
Pancreatic cancer incidence risk is increasing
About risk adjusted for competing mortality – time series
Pancreatic cancer risk is either the risk of being diagnosed with (incidence) or dying from (mortality) pancreatic cancer by a specified age.
Risk estimates are adjusted for competing mortality. A fundamental aspect of risk adjusted for competing mortality is that it considers the likelihood of reaching a given age and then considers the likelihood of diagnosis with (or death from) the cancer.
Given that life expectancy in Australia is increasing, more people are reaching the ages at which pancreatic cancer is more commonly diagnosed. Within the risk time series, risk increases to some extent because more people are more likely to survive to older ages.
Where risk is low and estimates are more volatile, analysis of risk is discussed using the average over a period of time rather than single years (for example, the average risk from 2011 to 2020).
Risk by the age of 40
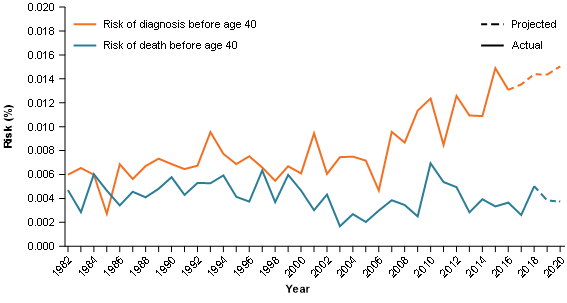
The risk of being diagnosed with pancreatic cancer by the age of 40 has been increasing (average risk of 1 in 14,300 for the 1991–2000 period, to 1 in 11,900 in 2001–2010 and 1 in 7,800 in 2011–2020) (Figure 7).
While the risk of being diagnosed with pancreatic cancer by the age of 40 is reaching its highest levels in 2011–2020, this is not the case for the risk of dying from pancreatic cancer. The average risk of death for the 2011–2020 period is 1 in 25,500. This is an increase on the average risk over 2001–2010 (1 in 29,900) but is lower than the average risk of death for the 1991–2000 period (1 in 20,300) (Figure 7). The increasing gap between the risks of diagnosis and death reflects the improvement in survival for younger people diagnosed with pancreatic cancer.
The risk of being diagnosed with pancreatic cancer is increasing but it remains a relatively low risk for younger populations. To provide some context by comparison with a couple of cancers more commonly associated with ages 40 and under, the average risk of being diagnosed with colorectal cancer by the age of 40 between 2011–2020 is 1 in 550; for melanoma of the skin it is 1 in 301.
Figure 7: Risk of diagnosis and risk of death, by the age of 40, pancreatic cancer, persons, 1982–2020
Source: AIHW Australian Cancer Database 2016 and AIHW National Mortality Database
Risk by age 70
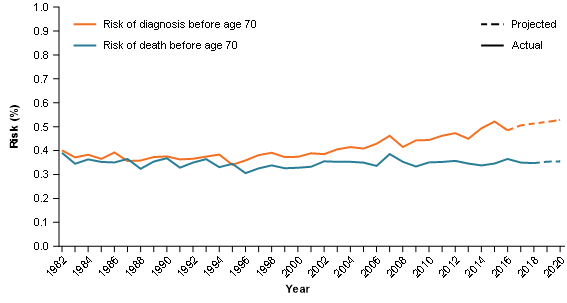
Since 1982, the median age of diagnosis has generally remained around the age of 70. The risk of being diagnosed with pancreatic cancer by the age of 70 has trended upwards since 2002 (1 in 260 in 2002 to an estimated 1 in 189 in 2020). Over the same time, the risk of death by the age of 70 remained similar (1 in 281 in 2002 to an estimated 1 in 282 in 2020) (Figure 8).
Figure 8: Risk of diagnosis and risk of death, by the age of 70, pancreatic cancer, persons, 1982–2020
Source: AIHW Australian Cancer Database 2016 and AIHW National Mortality Database
Can the data provide insights into the potential reasons behind changing pancreatic cancer rates?
More information and data is required to better understand the potential drivers affecting pancreatic cancer incidence, mortality and survival trends in Australia. This section discusses the available data trends and highlights some possible reasons for the observed changes.
The possibilities considered in this section include:
- improvements in cancer detection
- changes in risk factors
- improvements in cancer treatment
- changes in the proportion of different histological types of pancreatic cancer (noting that mortality by histology is not currently available).
Changes in histology type
Histology describes the type of cells in which cancer originates. Symptom patterns and survival outcomes vary based on histology type. Histology groupings presented in this commentary are based on the histological groups described in Cancer incidence in five continents (Brayet al. 2017). See Appendix A for more details.
The histological types for pancreatic cancer include adenocarcinoma, unspecified malignant neoplasms, unspecified carcinomas, neuroendocrine neoplasms, other specified carcinomas, sarcomas and other specified malignant neoplasms. Sarcomas and other specified malignant neoplasms are not discussed further due to the small number of cases diagnosed (4 cases in total in 2016) but are included in totals.
Please note that changes in the proportion of cases diagnosed by histology type may change over time to some degree due to changes in coding practices (for example, some proportion of adenocarcinoma increases over time may be due to reductions in unspecified carcinomas).
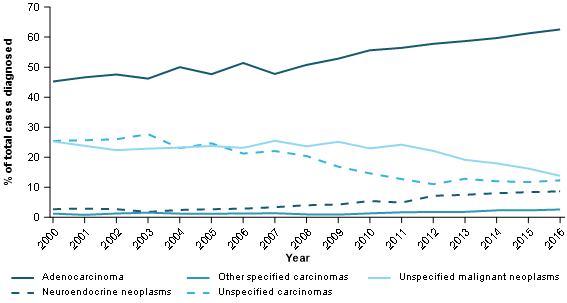
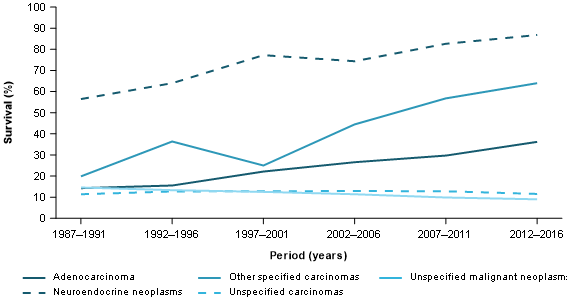
While acknowledging changes in coding practices make it difficult to establish the degree to which different histology types may be becoming more commonly diagnosed, neuroendocrine neoplasms increasingly appear to make up a greater portion of the total number of pancreatic cancer's diagnosed (Figure 9). Neuroendocrine neoplasms also have the highest survival rates of all pancreatic cancer histological types (neuroendocrine neoplasms had a 5-year survival of 69% in 2012–2016) (Figure 10).
Neuroendocrine 5-year survival in 2012–2016 improved by around 10 percentage points from 2007–2011 (from 59% to 69%). Improvements in survival for pancreatic cancer’s most common histology type, adenocarcinomas, are key to improvements in pancreatic cancer survival rates. Adenocarcinoma has very low 5-year survival rates but they have also improved (from 4.7% in 2007–2011 to 6.7% in 2012–2016) (Figure 10).
In 1987–1991, the adenocarcinoma 5-year survival rate was 1.9% and the overall pancreatic cancer survival rate was 3.2%. In 2012–2016, the respective rates were 6.7% and 10.7% (Figures 5 and 10). Improvements in adenocarcinoma survival are key to the improvements in pancreatic cancer survival overall. The increasing difference between the overall pancreatic survival rate and the adenocarcinoma rate is suggestive that histology types with higher survival are contributing more towards overall pancreatic cancer survival rates.
Figure 9: Proportion of pancreatic cancer cases diagnosed by histology type, persons, 1982–2016
Source: AIHW Australian Cancer Database 2016
Figure 10: 5-year relative survival, pancreatic cancer, by histology type, persons, 1987–1991 to 2012–2016
Source: AIHW Australian Cancer Database 2016
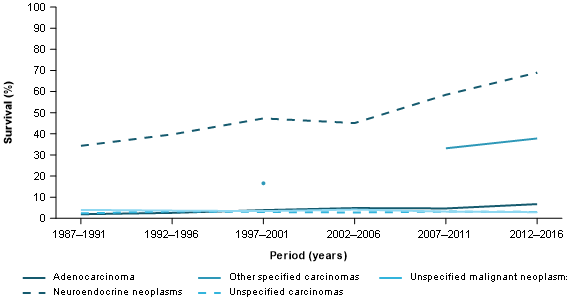
Focussing on shorter-term survival for the most common histology type, adenocarcinoma 1-year survival improved from 30% in 2007–2011 to 36% in 2012–2016 (Figure 11).
Figure 11: 1-year relative survival, pancreatic cancer, by histology type, persons, 1987–1991 to 2012–2016
Source: AIHW Australian Cancer Database 2016
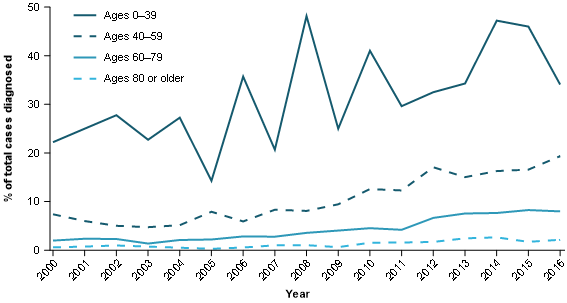
As previously discussed, survival rates for pancreatic cancer decrease with increasing age. Higher survival rates for younger ages (Figure 6) are also influenced by histology to some degree. In particular, the higher survival neuroendocrine neoplasms are proportionally more common in younger age groups (Figure 12).
Figure 12: Proportion of pancreatic cancers diagnosed with neuroendocrine neoplasm histology type, by age group, persons, 2000–2016
Source: AIHW Australian Cancer Database 2016
Exploring survival rates by age group can provide insights into whether the higher survival rates observed for neuroendocrine neoplasms are only due to it having a younger age profile. Comparisons of the 2012–2016 5-year survival rates for people diagnosed at age 60–79 show that the survival rate is much higher for those diagnosed with neuroendocrine neoplasms (64%) than adenocarcinomas (7.1%) (AIHW 2020, unpublished). This highlights that the higher survival rates for neuroendocrine neoplasms are not solely due to a younger age profile.
Improvements in cancer detection
Improvements in cancer detection would be expected to generally result in increasing incidence rates (for a period of time), increasing survival rates and potentially younger age at diagnosis (as the cancer is diagnosed earlier than it would have otherwise been). Mortality rates would be expected to either decrease or at least not increase proportional to incidence rates.
There are no early detection tests for pancreatic cancer. Pancreatic cancer trends do however exhibit some similarities to trends arising from improvements in cancer detection. As national data on stage at diagnosis are not currently available for pancreatic cancer, it is not possible to determine whether the cancer is being diagnosed at earlier stages.
Increase in the prevalence of risk factors for pancreatic cancer
Risk factors associated with pancreatic cancer include smoking, overweight/obesity, age, family history, diabetes, chronic pancreatitis, liver cirrhosis and stomach infections (Cancer Australia 2020). An increase in the prevalence of these risk factors may lead to increases in pancreatic cancer incidence.
Each risk factor will be changing to varying degrees within the population, the extent to which these changes impact on pancreatic cancer rates cannot be known with any certainty. Focussing on several key risk factors, smoking rates are declining while overweight/obesity and diabetes are increasing. If the key risk factors for pancreatic cancer are changing over time, it may lead to changes in incidence rates and possibly the age at diagnosis may change over time as a result.
The ageing population's impact on incidence and mortality counts and crude rates is discussed earlier. The ageing population will also place upwards pressure on median age at diagnosis and downwards pressure on survival rates (because survival rates decrease with increasing age at diagnosis).
More effective treatment
More effective treatments would be expected to result in increases in survival rates, decreases in mortality and increases in median age at death. Increases in rates of survival by stage at diagnosis (which is not available nationally for pancreatic cancer) would indicate that any improvements in survival are likely to be due to improvements in treatment rather than pancreatic cancers being diagnosed at earlier stages on average.
National Pancreatic Cancer Roadmap
Cancer Australia is working with the Department of Health to develop a National Pancreatic Cancer Roadmap to improve outcomes and survival for people with pancreatic cancer. The Roadmap will identify key priority areas for action over the next five years, across the continuum of pancreatic cancer care and pancreatic cancer research. The roadmap is expected to be developed by December 2021. More information about the roadmap is available on the Cancer Australia website.
Where can I find more data on pancreatic cancer?
Data used to inform this commentary are available on the Data page.
A more complete range of pancreatic cancer data is available within the Cancer data in Australia report. including by sex. General incidence, mortality and survival trends discussed in this paper are common across the sexes although males have higher incidence and mortality rates (survival rates are generally similar).
The Cancer data in Australia report is updated annually but note that the data to inform this commentary were obtained from the Australian Cancer Database, National Mortality Database and associated projections as at the time this commentary was released. For this reason, the estimates presented in this commentary may not be consistent with the estimates presented in Cancer data in Australia after it has been updated.
Attachment A
| Histology group | ICD-O-3.1 histology codes |
|---|---|
Carcinomas | 801–857 |
Adenocarcinomas | 814, 816, 819–823, 825–842, 848–855, 8570–8574, 8576–8579 |
Neuroendocrine neoplasms | 8013, 8041–8045, 815, 824 |
Other specified carcinomas | 8046, 809–813, 817–818, 843–847, 856, 8575 |
Unspecified carcinomas | 8010–8012, 8014–8039 |
Sarcomas | 880–893, 899, 904, 9120–9139, 9141–9249, 954–958 |
Other specified malignant neoplasms | 858–879, 894–898, 900–903, 906–911, 925–953 |
Unspecified malignant neoplasms | 800 |
Note: Only the first 3 digits are given except when the 4th digit is necessary.