General information about the data - Cancer incidence in Australia by country and region of birth
The following provides a broad overview of some issues to be aware of and general information but more expansive information about data quality is within Appendix A:
- Not all records within the Australian Cancer Database had the country of birth (COB) recorded (often referred to as ‘Not stated’) and the COB was imputed for these records. Any bias in ‘Not Stated’ records may impact the reliability of imputation and COB and ROB rates.
- The rate of ‘Not Stated’ differs considerably by cancer and has been increasing for most cancers in more recent years. Rates of ‘Not Stated’ are available in Appendix B.
- Unless noted otherwise, all rates mentioned within this paper are age-standardised. Rates are standardised to the World Health Organisation World Standard Population. Rates standardised to the Australian 2001 Standard Population are available in the Data section and data visualisation. Information about age-standardisation is available in Appendix C.
- This report is accompanied by an online data visualisation to allow users to make comparisons of the top 20 cancers by sex and years for selected countries of birth (COBs) and regions of birth (ROBs). It also presents rates standardised to the World Health Organisation World Standard Population and the Australian 2001 Standard Population along with 95% confidence intervals.
- Only countries of birth (COBs) and regions of birth (ROBs) with, on average, at least 20,000 people for the 2006–2020 period have been included within this release of country and region of birth data. Details about the population sizes, by COB and ROB are provided in Appendix D. The ROBs of Central Asia and Melanesia are not included in cancer comparisons in this report but instead have their own sections.
- The data visualisation and Data section of this report do not provide rates where the counts are based on less than 10 cases but case counts are provided for the leading 20 cancers in the period. Discussion within the report only focusses on where a COB or ROB has at least 20 cases diagnosed within the 2006–2020 period. While this helps prevent discussion focussing on high rates for a COB/ROB with a small population where there would be greater uncertainty of rates, on occasion it may prevent a larger population with very low cancer incidence being discussed.
- For the report, the leading 20 cancers for each COB and ROB for the 2006–2020 period are provided. If a cancer is not within the leading 20 cancers for the reporting period, it is not reported. The 20 leading cancers by COB and ROB for the 2006–2010, 2011–2015 and 2016–2020 reporting periods are also available in the Data section and data visualisation.
- The report generally avoids noting a region/country of birth as having the highest rate. Due to concerns around precision of rates, it discusses in more general terms such ROBs and COBs as being in higher/lower incidence tiers or relatively high/low incidence. The report discusses rates generally but confidence intervals are available in the data visualisation and Data section.
- Incidence rates for 2022 from the International Agency for Research on Cancer (IARC) are often used to discuss the rates that occur within the actual country. The information is used for general information about whether the risk apparent within the COB or ROB is also apparent in the country within which people were born.
- Note that some ROBs are comprised of only one COB (for example, Australia, New Zealand, Ireland) and are presented in both contexts.
- Within this report, Australia includes External Territories, Polynesia excludes Hawaii, the United Kingdom includes the Channel Islands and Isle of Man, Serbia and Montenegro have been combined for data quality purposes, Chinese Asia includes Mongolia, China excludes Special Administrative Regions (SARS) and Taiwan.
The sex composition may differ between ROBs and COBs and influence comparisons to some extent. For example, where two COBs have the same prostate cancer incidence for males, a COB with 60% of its population as male will have higher prostate cancer incidence rates for persons than a population with 40% as male. Figure 1 provides the sex composition by COB for the 2006–2020 period.
Figure 1: Composition of resident populations in Australia, by country of birth and sex, 2006–2020
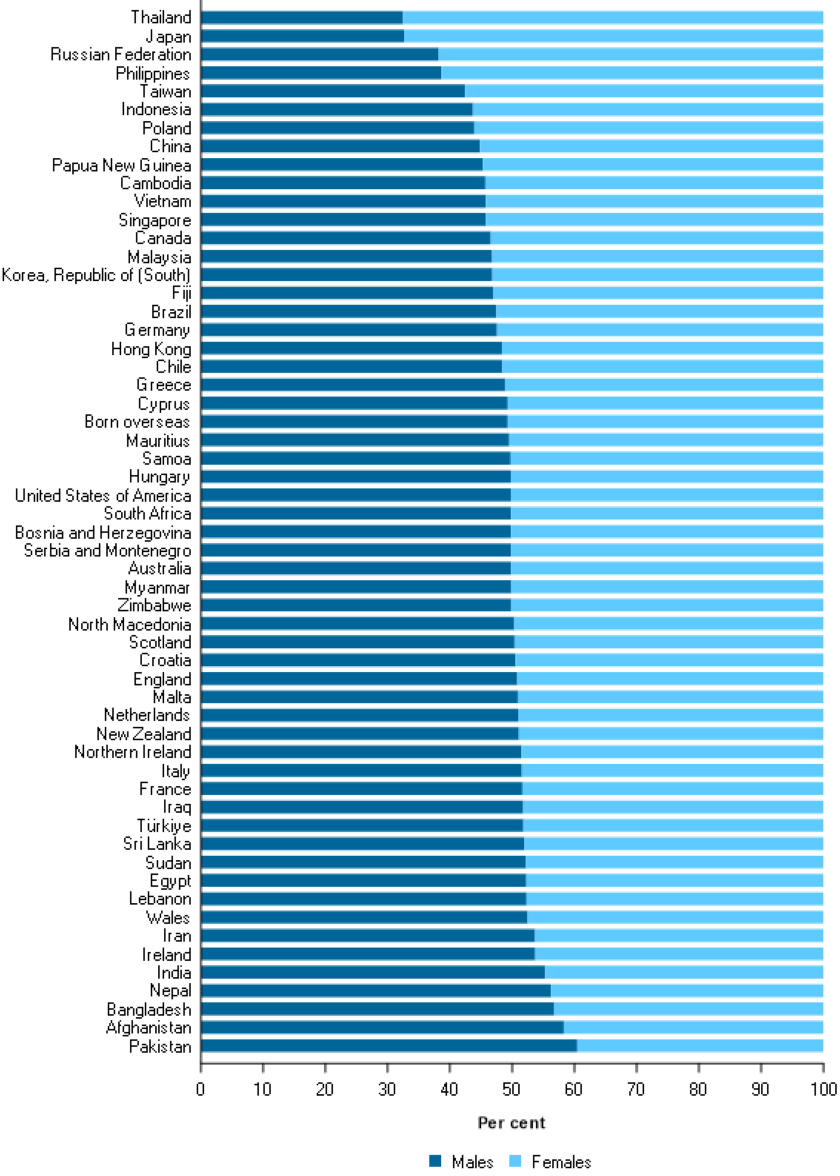
Source: Australia's population by country of birth 2024, Australian Bureau of Statistics