Methods
Age-adjusted survival
Comparisons of cancer survival rates over time may be affected by changes in the age composition of those diagnosed. For example, if more older people are diagnosed with cancer over time and older people have lower survival rates, improvements in survival over time may be offset by the increasingly older age of people diagnosed with cancer.
In order to calculate age-adjusted survival we first choose a fixed period, called the base period, and take note of the age composition of the people who were diagnosed with the cancer of interest during that period. We calculate age-adjusted survival for other periods by assuming that the age composition of patients in the other period is the same as that of the base period. Thus the age-adjusted survival is effectively the survival that would have occurred had there been no change in age composition from the base period.
Age-adjusted survival is different to age-standardised survival. An age-standardised rate uses the same standard population for all cancers and sexes (including persons). Using a standard population allows meaningful comparisons between different cancers, sexes and across time. In contrast, age-adjusted survival rates use a population relevant to the specific cancer (or cancer group) and sex to allow meaningful comparisons across time. Age-adjusted survival rates are only intended to enhance the understanding of how survival has changed over time for the specific cancer and sex and are not directly comparable with other cancers or sexes.
CdiA does not currently report on age-standardised survival.
Age-standardised rates (ASR)
A crude rate provides information on the number of, for example, new cases of cancer or deaths from cancer by the population at risk in a specified period. No age adjustments are made when calculating a crude rate. Since the risk of cancer heavily depends on age, crude cancer incidence and mortality rates are not as suitable for looking at changes over time or making comparisons between different population groups if there are differences in those populations’ age structures.
More meaningful comparisons can be made using ASRs, with such rates adjusted for age in order to facilitate comparisons between populations that have different age structures – for example, between Indigenous Australians and other Australians. This standardisation process effectively removes the influence of age structure on the summary rate.
There are two methods commonly used to adjust for age: direct and indirect standardisation. In this report, the direct standardisation approach presented by Jensen and colleagues (1991) is used. To age-standardise using the direct method, the first step is to obtain population numbers and numbers of cases (or deaths) in age ranges – typically 5-year age ranges. The next step is to multiply the age-specific population numbers for the standard population (in this case, the Australian population as at 30 June 2001) by the age-specific incidence rates (or death rates) for the population of interest. The next step is to sum across the age groups and divide this sum by the total of the standard population to give an ASR for the population of interest. Finally, this is expressed per 100,000 population in this report.
In addition to rates age-standardised to the 2001 Australian Standard Population, the CdiA report also offers rates age-standardised to the year of release. The basic trend analysis between the two rates is often similar. However, the 2025 population is overall, much older than the 2001 population. Cancer is more common in the older populations and accordingly, the 2025 age-standardised rates are often higher than the 2001 and are more relevant to cancer today. The 2001 Australian Standard Population is available as the current Australian standard. World Health Organisation and Segi age standardised incidence rates are also available in the summary data visualisation as well as Excel data tables.
Age-specific rates
Age-specific rates provide information on the incidence of a particular event in an age group relative to the total number of people at risk of that event in the same age group. It is calculated by dividing the number of events occurring in each specified age group by the corresponding ‘at-risk’ population in the same age group and then multiplying the result by a constant (for example, 100,000) to derive the rate. Age-specific rates are often expressed per 100,000 population.
Australian Cancer Database
All forms of cancer, except basal and squamous cell carcinomas of the skin, are notifiable diseases in each Australian state and territory. This means there is legislation in each jurisdiction that requires hospitals, pathology laboratories and various other institutions to report all cases of cancer to their central cancer registry. An agreed subset of the data collected by these cancer registries is supplied annually to the AIHW, where it is compiled into the ACD. The ACD currently contains data on all cases of cancer diagnosed from 1982 to 2021 for all states and territories.
Cancer reporting and registration is a dynamic process, and records in the state and territory cancer registries may be modified if new information is received. As a result, the number of cancer cases reported by the AIHW for any particular year may change slightly over time and may not always align with state and territory reporting for that same year.
For more information on the ACD please see the ACD 2021 Data Quality Statement.
Late registrations of cancer
Late registrations are likely to occur to some extent and accordingly incidence counts and rates may be understated to some extent.
International Classification of Diseases for Oncology (ICDO)
Cancers were originally classified solely under the ICD classification system, based on topographic site and behaviour. However, during the creation of the Ninth Revision of the ICD in the late 1960s, working parties suggested creating a separate classification for cancers that included improved morphological information. The first edition of the ICD-O was subsequently released in 1976 and, in this classification, cancers were coded by both morphology (histology type and behaviour) and topography (site).
Since the First Edition of the ICD-O, a number of revisions have been made, mainly in the area of lymphoma and leukaemia. The current edition, the Third Edition (ICD-O-3), was released in 2000 and is used by most state and territory cancer registries in Australia, as well as by the AIHW in regard to the ACD.
National Mortality Database
The AIHW National Mortality Database (NMD) contains information provided by the Registries of Births, Deaths and Marriages and the National Coronial Information System – and coded by the ABS – for deaths from 1964 to 2023. Registration of deaths is the responsibility of each state and territory Registry of Births, Deaths and Marriages. These data are then collated and coded by the ABS and are maintained at the AIHW in the NMD.
In the NMD, both the year in which the death occurred and the year in which it was registered are provided. For the purposes of this report, actual mortality data are shown based on the year the death occurred, except for the most recent year (namely 2023) where the number of people whose death was registered is used. Previous investigation has shown that the year of death and its registration coincide for the most part. However, in some instances, deaths at the end of each calendar year may not be registered until the following year. Thus, year of death information for the latest available year is generally an underestimate of the actual number of deaths that occurred in that year.
In this report, deaths registered in 2020 and earlier are based on the final version of cause of death data; deaths registered in 2021, 2022 and 2023 are based on revised and preliminary versions, respectively, and are subject to further revision by the ABS.
The data quality statements underpinning the AIHW NMD can be found on the following ABS website pages:
- ABS quality declaration summary for Deaths, Australia
- ABS quality declaration summary for Causes of death, Australia.
For more information on the AIHW NMD see Deaths data at AIHW.
Population Data
Throughout this report, population data were used to derive rates of, for example, cancer incidence and mortality. The population data were sourced from the ABS using the most up-to-date estimates available at the time of creating this report.
To derive its estimates of the resident populations, the ABS uses the 5-yearly Census of Population and Housing data and adjusts it as described here:
- All respondents in the Census are placed in their state or territory, Statistical Local Area and postcode of usual residence; overseas visitors are excluded.
- An adjustment is made for persons missed in the Census.
- Australians temporarily overseas on Census night are added to the usual residence Census count.
Estimated resident populations are then updated each year from the Census data, using indicators of population change, such as births, deaths and net migration. More information is available from the ABS website.
The 2025 to 2035 population estimates were sourced from the Centre of Population Population Statement: Population Projections by Age and Sex, 2023-24 to 2034-35.
Prevalence
Limited-duration prevalence is expressed as N-year prevalence throughout this report. N-year prevalence on a given index date – where N is any number 1, 2, 3 and so on – is defined as the number of people alive at the end of that day who had been diagnosed with cancer in the past N years. For example:
- 1-year prevalence is the number of living people as at 31 December who were diagnosed in the calendar year (for example, 1-year prevalence for 2021 is the number of people alive at 31 December 2021 who were diagnosed with the specified cancer in 2021).
- 5-year prevalence is the number of living people who were diagnosed in the past 5 calendar years to 31 December (for example, 5-year prevalence for 2021 is the number of people alive at 31 December 2021 who were also diagnosed with the specified cancer in 2017, 2018, 2019, 2020 or 2021).
Note that prevalence is measured by the number of people diagnosed with cancer, not the number of cancer cases. An individual who was diagnosed with two separate cancers will contribute separately to the prevalence of each cancer. However, this individual will contribute only once to prevalence of all cancers combined. For this reason, the sum of prevalence for individual cancers will not equal the prevalence of all cancers combined.
Prevalence projections
The CdiA includes 1-, 5- and 10-year prevalence projections. The following section details how the prevalence projections are calculated.
1-year prevalence
1-year prevalence for a selected cancer for year X is the number of people alive at the end of year X and diagnosed in year X. In this example, 2022 is used for year X, actual data only exists up to 2021 and 2022 prevalence therefore relies on projected estimates.
To calculate the 1-year prevalence, the two main elements required are an estimate of the people diagnosed in the year 2022 and the rate of those people estimated to be alive at the end of year 2022.
For each cancer, sex and 5-year age group:
- Calculate counts of people diagnosed for the last 10 years (2012 to 2021).
- Calculate the number of these people in step A who were alive at the end of the respective years. These figures equal the prevalence figures for 2012 to 2021.
- Calculate the rate of people who survived for each year (step A / step B). This will be referred to as the prevalence rate/s.
- For reporting by age group, calculate the proportion of people who moved into an older age group between the date of diagnosis and the end of the year (for example, for age group 55-59 years of age, it would be the number of 59 year olds who turned 60 between the time they were diagnosed and the end of the year of diagnosis. This figure would be calculated as a rate of the people in the 55-59 age group). For convenience, this will be referred to as the ‘ageing up rate’.
Using the estimated resident populations for each year (by age group and sex and for each cancer):
- Using the estimated resident populations for the years 2012 to 2021 and the number of people diagnosed in each year (step A), calculate the rate of people diagnosed in each year (that is, people diagnosed in the year divided by the population).
Linear regression is used in the following steps. The process for linear regression is described in the next section (Projections – Estimating the incidence of cancer). However, instead of cases diagnosed, this regression is used to project the number of people diagnosed (as it is possible for a person to be diagnosed with more than one cancer case in a given period). As with all aspects of the calculations, it is undertaken for each cancer, sex and age group.
- Using the rate of people diagnosed between 2012 and 2021, use linear regression to estimate the rate of people who are projected to be diagnosed in the year 2022. Apply this rate to the estimated resident population for 2022 to estimate the number of people diagnosed in 2022.
- Using the prevalence rates for 2012-2021 (Step C), use linear regression to estimate the 1-year prevalence rate for 2022.
- The 1-year prevalence for 2022 will then be equal to the estimated prevalence rate (step G) multiplied by the estimated number of people diagnosed (step F).
For age group reporting, the following is also undertaken:
- Using the average ageing up rate between 2012 and 2021 (the average of step D) for each age group cancer and sex, apply this to 1-year prevalence for the respective age groups/sex/cancer. This will provide the number of people estimated to be changing age groups for each age group.
- For each age group within the prevalence, remove the number of people moving to the next age group and add these to the older age group. This step is undertaken in 2-year, 3-year and 4-year etc. prevalence but for convenience is only discussed in 1-year prevalence.
2-year prevalence
While 2-year prevalence is not reported, it is a step within the 5-year and 10-year prevalence calculations.
To calculate 2-year prevalence:
- Calculate the 2-year prevalence for 2012-2021. For 2021, this will be people diagnosed in 2020 or 2021 and alive on December 31, 2021. For the earliest year (2012 in this example) it will be people diagnosed in 2011 or 2012 and alive on December 31, 2022. Within this step, the 2-year prevalence includes counts of those diagnosed in each of the years. Where a person is diagnosed with the selected cancer in multiple years, their most recent diagnosis will be used.
- Repeat step K but remove the requirement for people to be alive at the end of the relevant years. This will establish an annual time series of people diagnosed within 2-years.
- Two-year prevalence time series is provided in step K and the two-year number of people diagnosed is obtained in Step L. From these steps, remove those who were diagnosed in the most recent year. This will leave those who were:
- diagnosed and alive the following year, and
- the total number of people diagnosed in that year.
Both figures exclude those who were diagnosed in the following year. - Find the rate of people alive at the end of the following year (that is, alive on December 31) as a proportion of all those diagnosed. This provides the prevalence rate for the population alive to the end of the following year. For 2021, it will be those diagnosed in 2020 and alive at the end of 2021. For 2012, it will be those diagnosed in 2011 and alive at the end of 2012. While the 2-year original prevalence was 2012-2021, the time series is effectively 2011-2020 rates of people who survived to the end of the following year.
- For the people in step N, establish the proportion of people who went up an age group (repeating step D with the amount being the proportion of those who moved to the older age group between the date of diagnosis and the end of the following year).
- Use linear regression on the 2011-2020 rates of people who were alive at the end of the following year to estimate the rate of people diagnosed in 2021 and alive at the end of 2022. Apply this rate to the number of people actually diagnosed in 2021 to obtain the number of people diagnosed in 2021 but alive at the end of 2022.
- For 2-year prevalence for 2022, add the estimated number of people diagnosed in 2021 and alive at the end of 2022 to the 1-year prevalence.
The prevalence projections are additive. The 5-year prevalence figure will effectively be built from adding the following:
- The estimated number of people diagnosed in 2022 and estimated to be alive at the end of the year (steps A to J)
- The number of people actually diagnosed in 2021 and estimated to be alive at the end of 2022 (steps K to Q)
- The number of people actually diagnosed in 2020 and estimated to be alive at the end of 2022
- The number of people actually diagnosed in 2019 and estimated to be alive at the end of 2022
- The number of people actually diagnosed in 2018 and estimated to be alive at the end of 2022
The process outlined in steps K to Q are repeated to obtain estimates for points 3, 4, and 5. The difference being that instead of generating 2-year prevalence, the 3-, 4- and 5-year prevalence are independently generated. The 2-year prevalence rate establishes the rate of people alive the year after the diagnosis year. The 5-year prevalence rate establishes the rate of people diagnosed in the year and were alive for the year and at the end the year four years into the future.
There is one final step. For 5-year and 10-year reporting, an adjustment is undertaken. The linear regression of rates can be used to calculate the prevalence estimates for 2021 (that is, the last year of actual data). This number is compared with the actual prevalence number in 2021. The difference between the estimate and the actual prevalence is applied to the prevalence projections for 2022.
Projections - Estimating the incidence of cancer
Please note that no adjustments have been made to the projections to account for the potential impact of COVID.
Estimates of national incidence in 2022–2025 were estimated by projecting the sex- and age-specific incidence rates observed in Australia during 2012–2021. The time series were stratified by the following variables:
- sex
- 5-year age group (0–4, …, 85–89, 90+)
- 4-character ICD-O-3 topography code (C00.0, …, C80.9)
- 4-digit ICD-O-3.1 histology code (8000, …, 9992).
For each time series, the process was as described below:
- least squares linear regression was used to find the straight line of best fit through the time series
- if the slope was positive, the straight line of best fit was extrapolated to obtain the estimate of the 2022 rate
- if the slope was negative, the time series floor was set to 0
- the estimated incidence rates for 2022 were then multiplied by the Estimated Resident Populations for 2022 to obtain the estimated incidence numbers.
Note the following:
- estimates were made for Australia as a whole, not for individual jurisdictions
- for the majority of cancers, instead of using the topography and histology codes to define the cancer groups, ICD-10 codes were used (for example breast or melanoma of the skin as well as groupings such as head and neck cancers which is a consolidation of cancers of the lip, tongue, mouth, salivary glands, oropharynx, nasopharynx, hypopharynx and other sites in the pharynx).
- the 10 years of incidence data used as the baseline were 2012–2021 (please see the Technical notes for information about exceptions)
- for populations, the ABS Estimated Resident Populations were used for 2012–2024, and the 2025 population estimates were sourced from the Centre of Population.
- The method for projecting cancer incidence rates relies on the assumption that incidence trends are likely to provide a useful basis to project future cancer incidence rates and counts. For prostate cancer, this has not been the case in more recent years. Prostate cancer incidence trends now use the latest available incidence rates by age, applied to the relevant populations by age, to arrive at projected incidence and counts (please see the Technical notes for information about prostate cancer projections for the 2025 CdiA).
- For cancer projections, the linear regression model has difficulties where there is a cohort with different characteristics, and particularly where these characteristics can lead to sudden and quick change to incidence trends. The human papillomavirus (HPV) is the leading risk factor for cervical cancer. A HPV vaccination program at schools for 12- to 13-year-old girls commenced in 2007 and also with the introduction there was also a catch-up program for older females. Given the HPV vaccination, a cohort with lower cervical cancer incidence rates appeared probable as the younger populations enter ages of higher cervical cancer risk. Investigations indicate that cervical cancer incidence rates decrease when people who were around 18 at the time of vaccination program commenced enter an age group. People aged 18 in 2007 will be 32 in the first year of projections (2022) and 36 in the final year of projections. The cervical cancer incidence rates for the relevant age groups are adjusted to decrease by 10% per year after the most recent year of actual data or first year of projections when the cohort enters an age group. The age groups with adjusted projections were the 30 to 34 (all projection years) and the 35 to 39 age group (projections adjusted from 2024). The cervical cancer estimates will undergo manual consideration of actual data each year and be revised based on the findings within the most recent data.
- For the 2024 report, 2020 was the most recent year for national cancer data, and the cancer incidence projections for the years 2021 to 2024 were based upon 2011 to 2020 incidence trends. In 2020, the number of cases for several cancer types were much lower than previous years. As the reductions coincided with COVID-19 restrictions, they were assumed to be more related to restricted access to medical services than cancer-related changes. Accordingly, for the select cancers where rates were unusually low, 2020 was excluded from the years from which projections were derived and instead 2010 to 2019 was used to inform these projections. These cancers were: breast cancer, melanoma of the skin, colorectal cancer, colon cancer, rectosigmoid junction cancer, rectal cancer, appendiceal cancer, retroperitoneal and peritoneal cancer, and thyroid cancer.
- With the 2025 release, 2021 becomes the most recent year of national cancer data available, and cancer incidence projections from 2022 to 2025 are based upon 2012 to 2021 incidence trends. While 2020 was excluded in the 2024 release for the select cancers above, it has been included in the projections for 2025. The inclusion of the 2020 year in the projections for all cancers in the 2025 release is because, with the 2021 data, there is the opportunity for cancer trends to ‘bounce back’ and see additional cases diagnosed in 2021 (the ‘usual’ cases for 2021 plus some ‘extra’ cases that may have otherwise been diagnosed in 2020). For any cancer where this occurs, to exclude the 2020 year would see the bounce-back year/s included but not the unusually low year of 2020, and projections would likely be overstated. The inclusion of the lower than usual result (in 2020) and the higher than usual result (in 2021) would effectively offset each other to some extent. For the cancers where bounce-back didn’t occur at all, or didn’t occur fully, the 2020 year may be less associated with restricted access to medical services and should be included within the trends from which to inform future cancer incidence rates and counts.
Projections - Estimating the mortality of cancer
This method is the same as the incidence projections with the exceptions that:
- the 10-year baseline for incidence is 2012–2021 while the baseline for mortality from the NMD is 2014–2023 and the baseline for mortality from the ACD is 2012–2021.
Relative survival
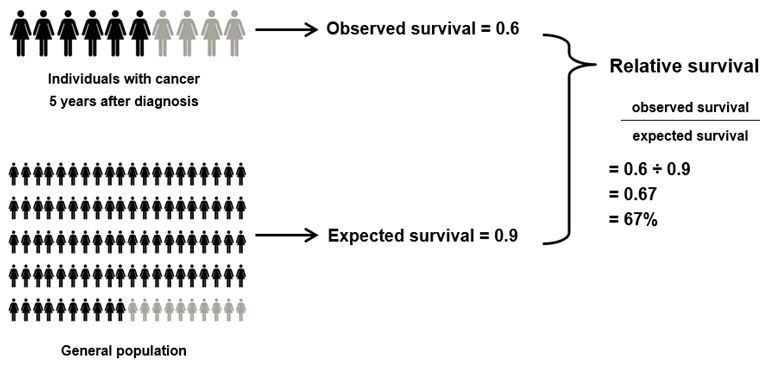
Relative survival is a measure of the survival of people with cancer compared with that of the general population. It is the standard approach used by cancer registries to produce population-level survival statistics and is commonly used as it does not require information on cause of death. Relative survival reflects the net survival (or excess mortality) associated with cancer by adjusting the survival experience of those with cancer for the underlying mortality that they would have experienced in the general population.
Relative survival is calculated by dividing observed survival by expected survival, where the numerator and denominator have been matched for age, sex and calendar year.
Observed survival refers to the proportion of people alive for a given amount of time after a diagnosis of cancer; it is calculated from population-based cancer data. Expected survival refers to the proportion of people in the general population alive for a given amount of time and is calculated from life tables of the entire Australian population. (Ideally these life tables should be restricted to the population of Australians who do not have cancer but such life tables are unavailable. It is standard practice around the world to use life tables for the entire population.)
A simplified example of how relative survival is interpreted is shown in Figure G1. Given that 6 in 10 people with cancer are alive 5 years after their diagnosis (observed survival of 0.6) and that 9 in 10 people from the general population are alive after the same 5 years (expected survival of 0.9), the relative survival of people with cancer would be calculated as 0.6 divided by 0.9, which is 0.67. This means that individuals with cancer are 67% as likely to be alive for at least 5 years after their diagnosis as are their counterparts in the general population.
Figure M1: Simplified example of how relative survival is calculated
The survival statistics in this report were produced using a modified version of a SAS program written by Dickman (2004) and employed the period method (Brenner and Gefeller 1996) with 1-year intervals. Observed survival was calculated from data in the ACD. Expected survival was calculated using the Ederer II method whereby matched people in the general population are considered to be at risk of death until the corresponding cancer patient dies or is censored (Ederer and Heise 1959).
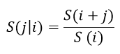
Calculation of conditional relative survival
Conditional survival is the probability of surviving j more days, given that an individual has already survived i days. It was calculated using the formula:
where
S(j|i) is the probability of surviving at least j more days given that the person has already survived at least i days
S(i + j) is the probability of surviving at least i + j days
S (i) is the probability of surviving at least i days
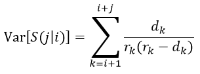
Confidence intervals for conditional survival were calculated using a variation of Greenwood's (1926) formula for variance (Skuladottir & Olsen 2003):
 where
where
dk is the number of deaths
rk is the number at risk during the kth interval.
The 95% confidence intervals were constructed assuming that conditional survival estimates follow a normal distribution.
Risk
We use 19 age groups, numbered 1 to 19. Age group i (i = 1 to 18) is 5 years wide and comprises all ages in the interval (5i - 5, 5i). Age group 19 comprises all ages 90 and above. The cancer under consideration is referred to as “the cancer”. This could be a specific cancer, a group of related cancers or all cancers combined. There are two different measures of risk, one adjusted for competing mortality and one not adjusted. For brevity, these are called the adjusted risk (AR) and unadjusted risk (UR). The full notation is as follows, where D is for diagnosis and M is for mortality.
ARD(5i) = adjusted risk of being diagnosed with the cancer before age 5i (i = 1 to 18),
ARD(∞) = adjusted lifetime risk of being diagnosed with the cancer,
ARM(5i) = adjusted risk of dying from the cancer before age 5i (i = 1 to 18),
ARM(∞) = adjusted lifetime risk of dying from the cancer,
and similarly for URD and URM.
For each age group i, the following three rates are used in the risk formulas.
Di = rate of first ever diagnosis of the cancer (the first in one's life, not the first in age group i),
Mi = rate of death from the cancer,
Ai = rate of death from all causes (including the cancer),
Note that the denominator of Di is the general population, not the population of people who have never been diagnosed with the cancer.
Risk not adjusted for competing mortality
As this measure of risk is not adjusted for competing mortality, the formulas are relatively simple and do not involve Ai. The formulas come from Day (1987).
URD(5i) = 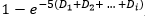 , i = 1, 2, ..., 18
URD(∞) = 1.
URM(5i) = 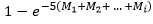 , i = 1, 2, ..., 18
URM(∞) = 1.
Note that the lifetime risks are necessarily 1. Not adjusting for competing mortality is equivalent to the scenario where it is impossible to die of any cause other than the cancer. Hence every person must eventually be diagnosed with the cancer and eventually die from it. This is why it is not informative to report unadjusted lifetime risks.
Risk adjusted for competing mortality
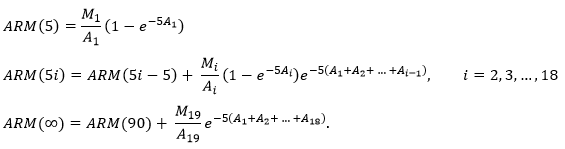
The formulas in this section come from Fay et al. (2003). The risk of diagnosis is as follows.
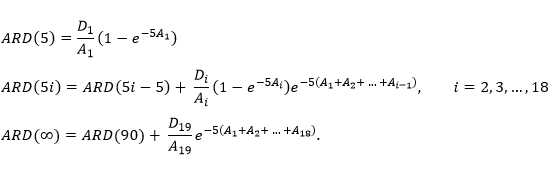
The formula for risk of death is the same as above except that Mi replaces Di throughout.
Use of a proxy to calculate risk of diagnosis
In order to calculate the risk of diagnosis we need the age-specific rates, Di, at which people are being diagnosed with the cancer for the first time in their lives. This requires knowledge of each person’s cancer history from birth. As the Australian Cancer Database (ACD) starts from the beginning of 1982, this is impossible for most age groups and will remain impossible for many decades to come. In order to estimate the risk of diagnosis we need a satisfactory proxy for Di.
The best available estimate of Di is obtained by using the entire history of the ACD. That is, instead of counting first ever diagnoses (which is impossible) we count “first from 1/1/1982” diagnoses. However, using such an estimate would mean that we couldn’t produce a consistent time series of risks. This is because each estimate in the time series would be based on a different amount of “lookback time” for previous diagnoses. The estimate in 1982 would be based on at most one year of lookback time, the estimate in 1983 would be based on up to two years of lookback time, and so on.
In order to enable the production of a time series of risks, the AIHW has chosen to use a lookback time of up to one calendar year for both the adjusted and unadjusted risks of diagnosis. That is, for the year for which the risks are being calculated, lookback goes back to the 1st of January of that year. Using this method we are in fact counting the number of people (not cancers) diagnosed in the year under consideration, irrespective of whether they have been diagnosed with the same cancer in a previous year. AIHW analysis has shown that this method provides a satisfactory estimate of Di, except for the group “all cancers combined”. No suitable period of lookback time was identified for this group. As such, AIHW does not produce a time series of risk of diagnosis for all cancers combined. However, the best available estimate for the latest year of data available is produced. This estimate is based on lookback to the beginning of 1982. Based on the analysis referred to above, this estimate is likely to be a few percentage points higher than the true value.