Overview of cancer in Australia, 2025
The following provides a brief summary of some notable trends in the latest cancer data. More comprehensive data is available throughout the Cancer data in Australia report for the cancers summarised as well as many other cancers. Information about colorectal cancer (bowel cancer), cervical cancer and breast cancer screening is available within the Cancer Screening page.
Key findings
- Close to one million of Australia's population will have been diagnosed with cancer in the last 10 years
- Cancer is becoming more commonly diagnosed in people in their 30s and 40s
- Cancer mortality rates have been decreasing for people aged in their 30s and 40s
- Cancer survival rates continue to increase
- Males remain more likely to be diagnosed with cancer
- Cancer accounts for around 3 of every 10 deaths in Australia
Cancer overviews are provided on this page for each of the following cancers
- Prostate cancer
- Breast cancer
- Melanoma of the skin
- Colorectal cancer
- Lung cancer
- Neuroendocrine neoplasms
- Pancreatic cancer
- Blood cancers
- Gynaecological cancers
- Brain cancer
- Thyroid cancer
- Rare cancers (cancer by rarity)
Please note that when survival rates are discussed in the summary that these are relative survival rates. Age-standardised incidence and mortality rates are standardised to the 2025 Australian population. All rates are age-standardised unless they are for specific age groups or are otherwise specified. All cancers combined incidence data excludes basal and squamous cell carcinomas of the skin. When discussing histology types, NOS is the abbreviation for ‘not otherwise specified’. The presence of NOS after a term generally indicates that a diagnosis is not as specific as it could theoretically be. For example, there are many kinds of adenocarcinoma but often the diagnosis is simply “adenocarcinoma”. This is referred to as “adenocarcinoma NOS”.
Note: Some cancer incidence projections have changed more considerably from the 2024 report estimates
The AIHW projects cancer incidence, mortality and prevalence to estimate counts and rates for the years where complete national data are not yet available, based on trends for the previous 10 years (for example, 2012–2021). Each year, AIHW updates the projections and includes a new year of data. In this release, actual data from 2020 and 2021 (during the COVID-19 pandemic) have been included in the projections for some cancers for the first time. Because of this, changes to estimates for previous years are greater than usual for some cancers, including (but not limited to) breast cancer, melanoma of the skin, colorectal cancer and colon cancer. For further information, please see the Methods section.
All cancers combined
Close to one million of Australia's population will have been diagnosed with cancer in the last 10 years
It is estimated there will be around 969,000 people alive at the end of 2025 and have been diagnosed with cancer over the last 10 years. This is a crude rate of 3,480 people alive and diagnosed with cancer in the last 10 years per 100,000 people or 3.5% of the population. The equivalent figures in 2000 were 410,000 people, 2,141 per 100,000 and 2.1% of the population. Part of the increase will be due to a larger population as well as an ageing population. When adjusted for age, the rate increases from 2,649 to an estimated 3,463 people alive and diagnosed with cancer in the last 10 years per 100,000 people. When age-adjusted, the 2025 rate is around 30% higher than in 2000 and will be due to increasing incidence and higher survival rates.
In 2000, there were around 88,000 cases of cancer diagnosed in Australia. By 2025, it is estimated there will be around 170,000 cases of cancer diagnosed in Australia. This represents an increase of around 93% over 25 years, with the majority of the increase due to increases in population size and increasing numbers of people reaching older ages for which cancer rates are higher.
Had the cancer incidence rates from 2000 for the various age groups remained constant between 2000 and 2025 there would be around 162,000 cases of cancer diagnosed in Australia in 2025 – an increase of around 74,000 cases. This number is reflective of increases due to population size and the ageing population alone. The additional 8,000 cases to arrive at the estimated 170,000 cases is indicative of the increase due to increasing cancer rates. Overall, around 95% of the estimated increase of cancer incidence increase between 2000 and 2025 levels is attributable to population increase and the ageing population alone.
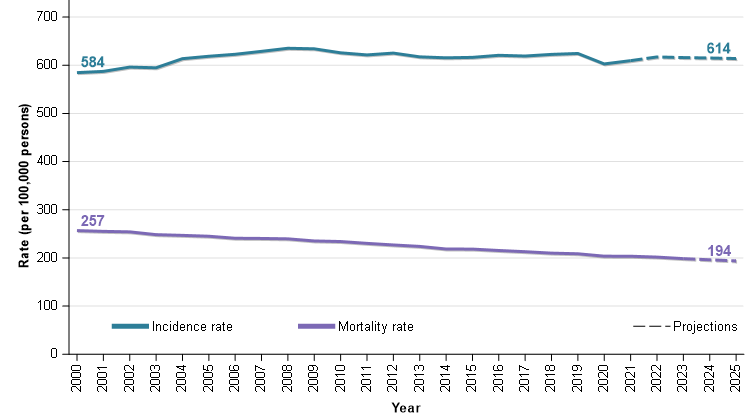
The age-standardised cancer incidence rate increased from 584 cases per 100,000 people in 2000 to an estimated 614 cases per 100,000 people in 2025. Over the corresponding period, age-standardised cancer mortality rates decreased from 257 deaths per 100,000 people to an estimated 194 deaths per 100,000 people (Figure 1). Increasing cancer survival rates increase the gap between incidence and mortality rates.
Figure 1: Age-standardised cancer incidence and mortality rates, persons, 2000–2025
Notes
- Rates are standardised to the 2025 Australian population.
- 2024 and 2025 are projections for mortality and 2022 to 2025 are projections for incidence.
Source: AIHW Australian Cancer Database 2021 and National Mortality Database
Cancer is becoming more commonly diagnosed in people in their 30s and 40s
Cancer occurs across all ages but is more common in older ages; in 2025 an estimated 88% of cancers diagnosed will occur in people aged 50 or older. However, cancer incidence rates for the young are increasing. This section focuses on cancer incidence of the populations aged 30 to 49. These age groups account for around 84% of the 20,000 cancer cases estimated to be diagnosed in the population under 50 in 2025.
Cancer incidence rates for people in their 30s and 40s have been increasing. The rates increased between 2000 to 2025 from 121 to an estimated 135 cases per 100,000 people for people in their 30s, driven by higher rates of colorectal cancer and thyroid cancer (Table 1).
For people in their 40s, rates have increased from 280 to 313 cases per 100,000 people. Cancers strongly contributing to this rise are thyroid, breast, prostate, colorectal, and kidney cancer. Table 1 provides an overview of some of the cancers contributing to the increasing rates as well as the cancers that are more common within these age groups.
| Cancer type / group | Ages 30-39 - Rate in 2000 | Ages 30-39 - Rate in 2025 | Ages 30-39 - Change in rates | Ages 40-49 - Rate in 2000 | Ages 40-49 - Rate in 2025 | Ages 40-49 - Change in rates |
|---|---|---|---|---|---|---|
| Breast cancer | 22.1 | 22.7 | 0.6 | 76.8 | 81.1 | 4.3 |
| Cervical cancer | 5.6 | 5.1 | -0.5 | 5.6 | 8.5 | 2.9 |
| Colorectal cancer | 6.3 | 18.9 | 12.6 | 24.9 | 31.3 | 6.4 |
| Kidney cancer | 2.0 | 3.6 | 1.6 | 7.0 | 11.8 | 4.8 |
| Liver cancer | 0.3 | 0.7 | 0.4 | 2.1 | 2.5 | 0.4 |
| Lung cancer | 2.1 | 1.8 | -0.3 | 11.4 | 8.9 | -2.5 |
| Melanoma of the skin | 31.4 | 18.4 | -13.0 | 50.5 | 44.6 | -5.9 |
| Pancreatic cancer | 0.5 | 1.3 | 0.8 | 3.2 | 5.0 | 1.8 |
| Prostate cancer | 0.1 | 0.3 | 0.2 | 4.9 | 12.5 | 7.6 |
| Testicular cancer | 7.3 | 9.8 | 2.5 | 4.1 | 5.3 | 1.2 |
| Thyroid cancer | 7.0 | 15.8 | 8.8 | 9.6 | 20.1 | 10.5 |
| Uterine cancer | 1.2 | 3.0 | 1.8 | 5.3 | 8.4 | 3.1 |
| All cancers combined | 120.6 | 134.7 | 14.1 | 280.4 | 312.9 | 32.5 |
Source AIHW Australian Cancer Database 2021
Cancer mortality rates have been decreasing for people aged in their 30s and 40s
Even though cancer incidence rates have been increasing, cancer mortality rates have generally been decreasing for people aged in their 30s and 40s. For people in their 40s, cancer mortality rates have been steadily decreasing between 2000 and 2025 (60 deaths per 100,000 people to an estimated 37 deaths per 100,000 people). The cancer mortality rate also decreased for people aged in their 30s over this time (18 deaths per 100,000 people to an estimated 11 deaths per 100,000 people).
The incidence rate increases for various cancers noted in Table 1 were not generally accompanied by corresponding mortality rate increases. The most notable exception to this was colorectal cancer for people in their thirties where the mortality rate increased by one death per 100,000 people (1.8 to an estimated 2.8 deaths per 100,000 people). Uterine cancer mortality rates are lower than colorectal but have increased from 0.2 deaths to an estimated 0.5 deaths per 100,000 people for people in their 40s between 2000 and 2025 (or 0.4 to 1.1 deaths per 100,000 females). The Cancer mortality by age data visualisation provides more information about the changing mortality rates of cancers for people in their 30s and 40s.
Cancer survival rates continue to increase
The 5-year survival for cancer in 1987–1991 was 50% and by 2017–2021, the rate had increased to 72%.
Even with decreasing mortality rates and increasing survival, the number of deaths from cancer has been increasing. In 2000, there were 36,000 deaths from cancer, and by 2025 the number of deaths from cancer is estimated to have increased by 47% to 53,500 people. Had mortality rates from 2000 not improved and remained constant, there would have been an estimated 71,000 deaths from cancer in 2025.
Males remain more likely to be diagnosed with cancer
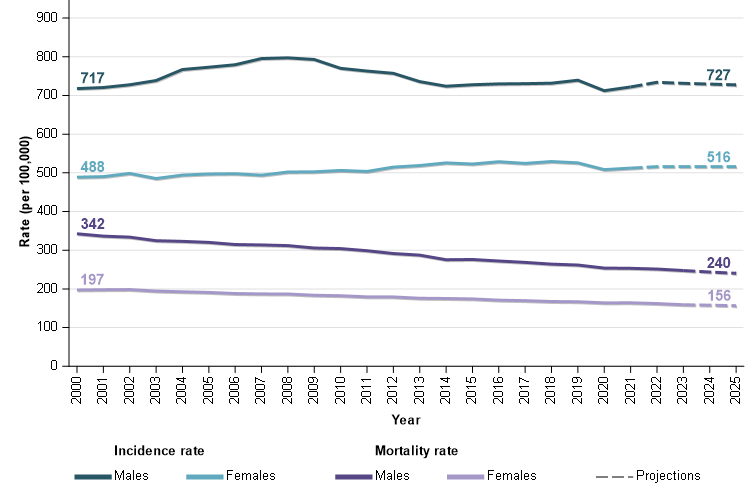
Males continue to be more likely to be diagnosed with cancer although the difference in age-adjusted incidence rates between the sexes in 2025 is less than it was in 2000. In 2025, the age-adjusted cancer incidence rate for males is estimated to be 727 cases per 100,000 males, which has increased from 717 cases per 100,000 males in 2000. For the same period, the equivalent rate for females increased from 488 cases per 100,000 females to 516 cases per 100,000 females.
Age-adjusted cancer mortality rates for males and females have decreased between 2000 and 2025. The age-adjusted mortality rates for males decreased from 342 deaths per 100,000 males to an estimated 240 deaths per 100,000 males. The decrease in the age-adjusted mortality rate for females over the same period was 197 deaths per 100,000 females to 156 deaths per 100,000 females. Similar to cancer incidence, the difference in cancer mortality rates between the sexes remains large in 2025 but is less than it was in 2000 (Figure 2).
Figure 2: Age-standardised cancer incidence and mortality rates, by sex, 2000–2025
Notes
- Rates are standardised to the 2025 Australian population.
- 2024 and 2025 are projections for mortality and 2022 to 2025 are projections for incidence.
- Prostate cancer incidence rates increased in the early 2000s before decreasing. The rate changes strongly influenced all cancers combined rates for males. More information about prostate cancer incidence is available in Cancer data commentary 9.
Source: AIHW Australian Cancer Database 2021 and National Mortality Database
Between 1997–2001 and 2017–2021, the 5-year survival rate for females increased from 63% to 73%. The corresponding survival rates for males improved from 57% to 71%. The greater improvements in survival for males and small increases in incidence rates leads to decreases in the gap between male and female mortality rates.
COVID-19 lockdown and the reduction of cancer cases
In 2020, the number of cases of cancer diagnosed decreased for the first time since 1996 with 148,600 cases diagnosed in 2020, compared with 149,400 cases diagnosed in 2019. This is different to the pattern between 2000 and 2019 where the number of cancer cases diagnosed increased, on average, 3,200 cases per year (Figure 3). The number of cases diagnosed in 2020 was less across the most common cancers, with decreases of around 1,000 cases for both colorectal cancer and melanoma of the skin. There was also a decrease of just over 500 for breast cancer and a small increase for prostate cancer (166 cases) compared with prostate cancer increases of around 1,000 cases in previous years.
These decreases coincide with the onset of COVID-19 and associated restrictions and lockdowns. It is known that the Breastscreen Australia was closed for around a month and people were less willing to visit medical practitioners.
It could be speculated that, if the decrease of cases in 2020 was due to decreased access to medical services, there may be many more cases diagnosed when access begins to return to normal. There were around 4,900 more cancer cases diagnosed in 2021 than 2020. Only in 2004 has there been a greater annual increase (5,000 cases). Prostate cancer accounted for around 3,000 of the 4,900 case increase while breast cancer was around 850 cases higher. Both of these are more than had occurred in the recent years before 2020 with prostate cancer being considerably higher.
Figure 3: Cancer cases diagnosed, persons, 2000–2021

Source: AIHW Australian Cancer Database 2021
Cancer accounts for around 3 of every 10 deaths in Australia
In 2025, it is estimated that cancer will be responsible for around 3 of every 10 deaths in Australia. The percentage has increased gradually from 17% in 1971 but has been relatively stable between 28% and 30% for almost all years since the turn of the century.
The rate of deaths from cancer varies considerably by age (Figure 4). In 2025, cancer is estimated to be responsible for around 45% of deaths in the population aged 60 to 69. The 0 to 9 age group has the smallest percentage of deaths from cancer and is estimated to be responsible for 5.8% of all deaths (from any cause) for the age group in 2025. In the 1970’s the proportion of deaths that were caused by cancer for this age group did not exceed 4%.
Figure 4: Percentage of deaths from cancer, by age group, 1971–2025

Note
- 2024 and 2025 are projections.
Source: National Mortality Database
Prostate cancer is Australia's most commonly diagnosed cancer
In 2025, prostate cancer is estimated to be the most commonly diagnosed cancer for males and for Australia overall. With an estimated 29,000 cases diagnosed in 2025, prostate cancer is estimated to account for 30% of the cancers to be diagnosed in males for the year.
Since 2000, prostate cancer incidence rates have been more volatile than any other cancer (see Cancer commentary 9). The projections for prostate cancer incidence therefore have more uncertainty than for other cancers. However, if the most recent prostate cancer incidence rates were to remain and occur in future years, there would be around 35,000 cases of prostate cancer diagnosed in 2035.
In 2021, over 96% of prostate cancers diagnosed were adenocarcinomas. The 5-year survival rate for this type of prostate cancer in 2017–2021 was 98% and strongly influenced the overall prostate cancer 5-year survival rate of 96% for the period.
While prostate cancer survival rates are high, exceptions exist such as neuroendocrine neoplasms. In 2021, 0.2% of prostate cancers diagnosed were neuroendocrine neoplasms. The 5-year survival rate for these prostate cancers in 2017–2021 was 12%.
Prostate cancer mortality rates have been decreasing this century. Prostate cancer mortality rate reductions began in the mid-1990s, several years after the introduction of prostate specific antigen testing. In 1994, prostate cancer mortality rates were 63 deaths per 100,000 males. In 2025, it is estimated that prostate cancer mortality rates will be 33 deaths per 100,000 males, just over a half of the peak mortality rate.
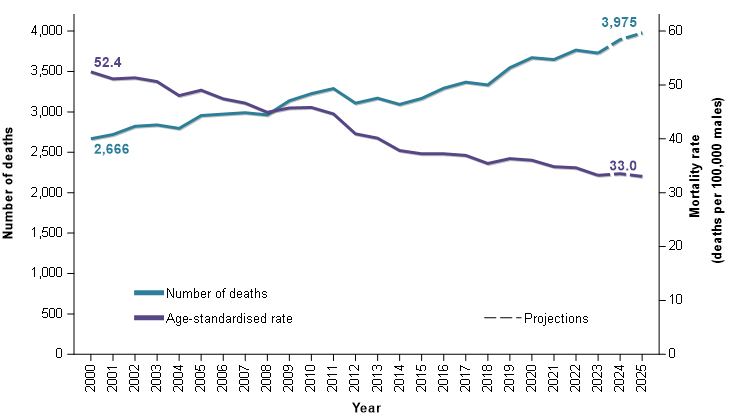
While the mortality rates have been decreasing, the number of deaths from prostate cancer continue to rise (Figure 5). In 2000, there were 2,700 deaths from prostate cancer and it is estimated there will be 4,000 in 2025. Population growth in combination with an ageing population exceeds reductions in age-standardised mortality rates to result in increasing numbers of deaths from prostate cancer.
Figure 5: Prostate cancer deaths and age-standardised mortality rate, 2000–2025
Notes
- Rates are standardised to the 2025 Australian population.
- 2024 and 2025 are projections.
Source: National Mortality Database
More than 20,000 cases of breast cancer are estimated to be diagnosed in 2025
Breast cancer is the most commonly diagnosed cancer for females in Australia.
It is estimated there will be around 20,000 breast cancer cases diagnosed in females in 2025. This is around 27% of the estimated cancers diagnosed in females. It is the most commonly diagnosed cancer in Australia for persons aged 20 to 39 and persons aged 40 to 59.
Breast cancer age-standardised incidence has increased from 134 cases per 100,000 females in 2000 to an estimated 140 cases per 100,000 females in 2025. A large portion of this increase occurred around 2013 when breast cancer screening was expanded to include women aged 70 to 74.
Breast cancer 5-year survival improved from 75% in 1987–1991 to 93% in 2017–2021.
While survival rates for breast cancer overall are high, there is substantial variation in survival for different types of breast cancer. For females, carcinomas were the most common type of breast cancer accounting for 99% of all breast cancer cases in 2021. The main types of breast carcinoma were ductal carcinomas (84% of all breast cancer cases) followed by lobular carcinomas (13%). There are different types of ductal carcinomas which have varied survival rates. The most common type of ductal carcinoma, the infiltrating duct carcinoma (NOS) (72% of all breast cancers in 2021), had a 5-year survival of 93% in 2017–2021. For the same period, other less common ductal carcinomas had much lower 5-year survival rates (for example, inflammatory carcinomas (56%) and metaplastic carcinomas (78%).
In 2025, it is estimated that around 3,300 females will die from breast cancer; in 2000, around 2,500 females died from breast cancer. Like many other cancers, the increasing number of deaths is attributable to increasing population size and the ageing population. Age-adjusted breast cancer mortality rates have been decreasing for females and were around 31 deaths per 100,000 females in 2000 compared to an estimated 22 deaths per 100,000 females in 2025.
Breast cancer by tumour size incidence and survival data is now available within this report (from 2004 for incidence and 2012–2016 for survival). A considerable number of records have an unknown breast cancer tumour size and this impacts the ability to interpret the incidence trends. However, the survival figures provide an indication of the importance of early detection, with relative survival rates being: 100% where the tumour size was less than or equal to 2cm, 95% where the tumour size was 2cm to 5cm, and 84% where the tumour size was 5cm or more (Table 2).
| Tumour size | 2004 cases diagnosed | 2021 cases diagnosed | 2012–2016 5-year relative survival | 2017–2021 5-year relative survival |
|---|---|---|---|---|
| Tumour size <= 2cm | 6,598 (64% of known size) | 8,976 (63% of known size) | 99.4% | 100.2% |
| 2cm < tumour size <= 5cm | 3,301 (32% of known size) | 4,465 (31% of known size) | 91.5% | 94.6% |
| Tumour size > 5cm | 464 (4.5% of known size) | 850 (5.9% of known size) | 79.7% | 83.9% |
| Total (known tumour size) | 10,363 | 14,291 | n.p. | n.p. |
| Tumour size unknown | 1,876 (15% of all cases) | 4,562 (24% of all cases) | 65.2% | 70.5% |
| All | 12,239 | 18,853 | 91.2% | 92.7% |
Note
n.p. = not published
Source: AIHW Australian Cancer Database 2021
Melanoma of the skin incidence rates have been increasing for older ages but decreasing for younger
Melanoma of the skin age-standardised incidence rates have increased from 54 cases per 100,000 people in 2000 to an estimated 63 cases per 100,000 people in 2025. In 2025, it is estimated that 34% of melanoma of the skin cancer cases will be diagnosed on the trunk of the body, 26% on the upper limbs (including shoulder), 19% on the lower limbs (including hip) and 7.7% on the scalp and neck.
The proportion of melanoma of the skin diagnosed by site varies by sex. For example, in 2025 it is estimated that 25% of melanoma of the skin cases are diagnosed on the lower limbs (including hip) for females while for males it is 14%. Conversely, the trunk accounts for 39% of the cases for males and 26% for females.
In 2025, melanoma of the skin incidence rates for females are estimated to be 50 cases per 100,000 females in 2025 compared to 78 cases per 100,000 males.
Melanoma of the skin incidence rates have been decreasing for people under 40 since the late-1990s. Incidence rates for people aged 40 to 49 ranged between 42 and 54 cases per 100,000 people since the mid-1990s. Rates for people aged 50 and over continue to rise, although there was a decrease in 2020 which is also the year where COVID restrictions were in place.
The ‘Slip Slop Slap’ campaign was a very large skin cancer awareness and prevention campaign commencing from the early 1980s. In 2025, the population aged under 40 were born after or around the ‘Slip Slop Slap’ campaign and have spent their lives in an environment where skin cancer awareness has been greater. Skin cancer awareness and prevention advice continues today. While populations over 40 have increasing incidence rates, the rate increases are greater for the oldest populations who are likely to have spent more of their lives in times when there was less skin cancer awareness.
After many years of increasing, melanoma of the skin mortality age-adjusted rates reached 8.0 deaths per 100,000 people in 2013. In 2025, the age-standardised mortality rate is estimated to be 5.3 deaths per 100,000 people. The reduction in mortality rates is also accompanied by reductions in the number of deaths from melanoma (1,625 deaths in 2013 and an estimated 1,455 in 2025).
Since 1997–2001, 5-year melanoma of the skin survival rates have been a little over 90%. The melanoma of the skin 5-year survival rate for 2017–2021 was 94% and is the highest rate recorded for melanoma of the skin.
For the first time, melanoma of the skin by Breslow thickness incidence and survival data is available within this report (from 1989 for incidence and from 1997–2001 for survival). Breslow thickness is the measurement, in millimetres, of how deeply a melanoma has grown into the skin from the surface. The melanoma of the skin by Breslow thickness has decreasing proportions of unknown Breslow thickness over time and this may impact on Breslow time series. Where Breslow thickness is known, the proportion of melanoma of the skin by Breslow in 2021 is similar to that in 1989. The melanoma of the skin by Breslow thickness shows decreasing survival with increasing size (Table 3).
In October 2024, the Federal Government announced a budget allocation of just over $10 million for the development of a Roadmap for a National Targeted Skin Cancer Screening Program (the Roadmap). The Roadmap will set out an evidence-based program for screening that will target those in the population at highest risk of developing skin cancer. The AIHW are working in collaboration with Melanoma Institute Australia and the Roadmap teams to develop the data collection and monitoring requirements for a skin cancer screening program. For more information about the Roadmap, please visit Roadmap for a National Targeted Skin Cancer Screening Program.
| Breslow thickness | 1989 cases diagnosed | 2021 cases diagnosed | 1997–2001 5-year relative survival | 2017–2021 5-year relative survival |
|---|---|---|---|---|
| Breslow <= 1mm | 3,331 (67% of known Breslow) | 9,606 (68% of known Breslow) | 100.0% | 101.2%* |
| 1mm < Breslow <= 2mm) | 832 (17% of known Breslow) | 1,937 (14% of known Breslow) | 90.5% | 94.9% |
| 2mm < Breslow <= 4mm | 551 (11% of known Breslow) | 1,361 (9.7% of known Breslow) | 77.1% | 82.0% |
| Breslow > 4mm | 277 (5.5% of known Breslow) | 1,135 (8.1% of known Breslow) | 60.9% | 65.7% |
| Total (known Breslow) | 4,991 | 14,039 | n.p. | n.p. |
| tumour size unknown | 747 (13% of all cases) | 995 (6.6% of all cases) | 63.5% | 62.9% |
| All | 5,738 | 15,034 | 91.9% | 94.3% |
Notes
*Please note that the above are relative survival rates and for these, survival of more than 100% is possible. A relative survival rate of 50% would mean the survival is 50% compared to the general population. The survival rate of 101%, means that the diagnosed group’s survival was slightly higher than the general population. More information about the different survival measures are available in the Cancer survival data visualisations.
n.p. = not published
Source: AIHW Australian Cancer Database 2021
Colorectal cancer incidence rates have been decreasing overall but increasing in the young
With around 14,800 cases estimated, colorectal cancer is estimated to be the fifth most commonly diagnosed cancer in Australia in 2025. At the beginning of the century, it was the most diagnosed cancer in Australia.
Since 2000, colorectal cancer incidence rates have decreased more than any other cancer. Age-standardised incidence rates peaked in 2001 at 86 cases per 100,000 people and are estimated to have decreased to an estimated age-standardised rate of 53 cases per 100,000 people in 2025.
Five-year survival for colorectal cancer increased from 56% in 1992–1996 to 72% in 2017–2021. Decreasing incidence combined with improvements in survival have led to reducing mortality rates. The age-standardised mortality rate for colorectal cancer decreased from 35 deaths per 100,000 people in 2000 to an estimated 19 deaths per 100,000 people in 2025.
Colorectal cancer is far more common in the older population than the young. In 2025, around 7.2% of colorectal cancers are estimated to be diagnosed in people aged under 40. In 2000, only around 2.2% of colorectal cancers were diagnosed in people aged under 40. The increasing proportion occurred because, while colorectal cancer is decreasing overall and for older populations, colorectal cancer incidence is increasing for the young.
Incidence rates for younger populations remain much lower than for older populations but the trends are very different. Age groups under 40 years old have seen increases in incidence rates of colorectal cancer, particularly since around 2005. Incidence rates for 40–49-year-olds increased from 22 cases per 100,000 people in 2005 to an estimated 31 cases in 2025. Over the same period, incidence rates decreased from 201 cases per 100,000 people to 131 cases per 100,000 people for the population aged 50 and over.
Some portion of the increasing rates for the younger population is attributable to neuroendocrine neoplasms but increases also occur for adenocarcinomas in the 20–39 age group. The increase for neuroendocrine neoplasms more generally may be explained by various factors such as increasing incidence of this malignancy, improvements in imaging technologies, increased use of endoscopy and colonoscopy, increased awareness in clinical practice and the introduction of the 2010 World Health Organisation classification for neuroendocrine tumours (Wyld D et al. 2019).
Cancer survival rates are higher for younger populations than older. In 2017–2021, survival was 98% for 0–19-year-olds, between 70–80% for age groups 20–39, 40–59 and 60–79 years old, and 61% for people aged 80 years and older.
Colorectal cancer sites and types diagnosed differ by age. Some of these differences are discussed below but much more comprehensive information is available in the cancer by histology and cancer by subsite data visualisations and spreadsheets.
Colorectal cancer can originate in the broad areas of the colon, rectum or the rectosigmoid junction (which is the limit separating the sigmoid colon and the rectum). In 2025, it is estimated that most cases of colorectal cancer will be in the colon (70% of all colorectal cancer cases), followed by the rectum (23%) and lastly the rectosigmoid junction (6.7%). The appendix, which is part of the colon, is not a common site of colorectal cancer in the overall population (estimated 5.6% of cases in 2025). However, the majority of colorectal cancer cases in the youngest age groups are located in the appendix (estimated 100% of cases in 0–14-year-olds and an estimated 81% of cases in 15–24-year-olds in 2025).
The majority of colorectal cancers diagnosed were carcinomas (95% of all colorectal cancers in 2021). In the general population, the most common type of colorectal carcinoma diagnosed was adenocarcinomas (87%) followed by neuroendocrine neoplasms (5.5%). However, neuroendocrine neoplasms were very common in younger age groups accounting for 100% and 84% of colorectal cancer cases in 0–14 and 15–24-year-olds respectively.
Colorectal survival outcomes differ by age and type. Figure 6 presents the survival rates for a small selection of histologies by age group for 2017–2021. Adenocarcinomas had a 5-year survival of 74% in 2017–2021 while neuroendocrine neoplasms had 89% survival. However, the difference in survival for neuroendocrine neoplasms is partly due to proportionally more cases of this cancer being in younger age groups, who tend to have higher survival than older age groups. More extensive statistics are available in the cancer by histology data visualisation and Excel data.
Figure 6: Colorectal cancer 5-year relative survival by specified histologies, by age group, 2017–2021
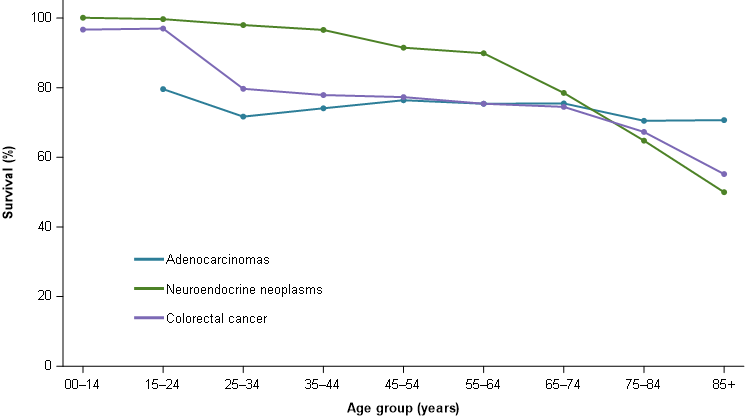
Source: AIHW Australian Cancer Database 2021
Lung cancer is responsible for more deaths than any other cancer
With around 15,100 cases estimated, lung cancer is estimated to be the fourth most commonly diagnosed cancer in Australia in 2025. Of the 5 most common cancers in Australia, its survival rates are the lowest (5-year survival of 27% in 2017–2021 for lung cancer with colorectal cancer survival the next lowest at 72%).
While lung cancer is a low survival cancer, 5-year survival rates have improved over time. Survival increased from 9.7% in 1992–1996 to 23% in 2017–2021 for males and from 12% to 33% for females. Survival differs by age group with 5-year survival at 90% for 20–24-year-olds, 80% for 25–29, 60% for 30–34, between 29% and 38% for age groups between 40 and 74, and only 9% for those aged 85 and over in 2017–2021.
Lung cancer age-standardised incidence rates have been fairly stable at 57 cases per 100,000 people in 2000 and an estimated 55 cases in 2025. The national rates for persons are however comprised of very different trends for males and females. Males have seen strong and enduring decreases from 85 cases per 100,000 males in 2000 to an estimated 60 cases per 100,000 males in 2025. In contrast, females have seen an increase from 36 cases per 100,000 females in 2000 to an estimated 51 cases per 100,000 females in 2025.
The increasing incidence rates of this low survival cancer have seen lung cancer account for increasing proportions of cancer deaths for females. In 2000, lung cancer accounted for around 15% of cancer deaths in females and is estimated to be 17% in 2025. Conversely, lung cancer represented 22% of all cancer deaths for males in 2000 and this has reduced to 17% in 2025.
In 2025, it is estimated that around 9000 people will die of lung cancer in Australia. This is the most common cause of cancer-related death. Age-standardised mortality rates for males have decreased substantially from 74 deaths per 100,000 males in 2000 to an estimated 39 deaths per 100,000 males in 2025. Lung cancer mortality rates remain lower for females than for males, but in contrast to males have increased from 30 deaths per 100,000 females in 2000 to a peak of 32 deaths in 2010 before decreasing to an estimated 27 deaths per 100,000 females in 2025.
In 2011 – 2016, the 5-year survival rate for those diagnosed with Stage 1 lung cancer was 68%, 32% for Stage 2, 17% for Stage 3 and 3.2% for Stage 4. In 2011, of the records where stage could be derived, Stage 1 accounted for 16% of cases, Stage 2 9%, Stage 3 16% and Stage 4 for 59%.
The National Lung Cancer Screening Program (NLSCP) was launched in July 2025. The program aims to achieve better health outcomes for Australians by detecting lung cancer early and saving lives. The program screens for lung cancer in high-risk individuals using low-dose computed tomography (low-dose CT) scans. People are eligible for the program if they are aged between 50 and 70 years and:
- show no signs or symptoms suggesting you may have lung cancer (that is, you are asymptomatic)
- currently smoke or have quit smoking in the past 10 years
- have a history of tobacco cigarette smoking of at least 30 pack-years.
The Australian Institute of Health and Welfare will provide data about the NLSCP as it becomes available.
Cancer screening programs
Population-based screening is an organised, systematic and integrated process of testing for signs of cancer or pre-cancerous conditions in populations without obvious symptoms. Programs target specific populations and/or age groups where evidence shows screening to be most effective.
The Cancer Screening page includes monitoring reports for the National Bowel Cancer Screening Program, the National Cervical Cancer Screening Program and BreastScreen Australia.
Pancreatic cancer is the 3rd most common cancer-causing death
In 2000, the age-standardised pancreatic cancer incidence rate was around 14 cases per 100,000 people and by 2025 it is estimated to be around 17 cases per 100,000 people. Pancreatic cancer survival rates are low (5-year relative survival of 14% in 2017–2021) and the increasing incidence and low survival has led to pancreatic cancer to be the cancer responsible for the 3rd most deaths in 2025 (around 4,000 deaths estimated and an age-standardised mortality rate of around 15 deaths per 100,000 people). For people in their 60s and 70s, only lung cancer is responsible for more cancer deaths (around 5,200 estimated deaths for lung cancer and 2,200 for pancreatic cancer).
Between 2000 and 2025, the number of deaths from cancer has increased by around 47% (36,000 to an estimated 54,000 deaths). The increase in deaths is due to the increasing population size and ageing population When adjusted for age, the cancer mortality rates have decreased from 257 to an estimated 194 deaths per 100,000 people between 2000 and 2025. During the same time, the number of deaths from pancreatic cancer has more than doubled (1,700 to an estimated 4,000 deaths) and age-standardised mortality rates increased from around 13 deaths per 100,000 people to around 15 deaths per 100,000 people.
While pancreatic cancer survival rates remain low, the 2017–2021 5-year survival rate of 14% is more than 4 times higher than the 1987–1991 equivalent rate of 3.1%. Pancreatic cancer survival rates are not low for all types of pancreatic cancer and can vary quite considerably. For example, in 2021, around 68% of pancreatic cancers were adenocarcinomas and 9.2% were neuroendocrine neoplasms. The 5-year survival rate for the adenocarcinomas in 2017–2021 was 9.0% while for the neuroendocrine neoplasms, the rate was 76%.
Neuroendocrine neoplasm incidence rates have been increasing
Cancers may be classified by cancer site such as lung cancer or breast cancer. Cancers may also be classified by histology, which describes the types of cells in which the cancer originates.
Neuroendocrine neoplasms (NENs) are a histologically based group of cancers, originating in neuroendocrine cells which are found throughout the body. Neuroendocrine cells receive signals from the nervous system and respond by making, storing, and secreting a variety of peptides and hormones to help control many of the body’s functions. NENs occur where neuroendocrine cells become malignant, they can occur anywhere in the body, in all types of organs as well as in soft tissues.
Between 2000 and 2025, the age-standardised incidence rate for NENs has increased from 14 to 21 cases per 100,000 people. It is estimated there will be around 5,700 NENs cases diagnosed in 2025. For context, this is more than the 7th most commonly diagnosed cancer in Australia (kidney cancer) and at a crude rate of 21 cases per 100,000 people, collectively NENs would be categorised as a common cancer.
In 2021, NENs account for around 3.1% of all cancers diagnosed but are relatively more common in younger populations with around 7.8% of cancers for people under the age of 20 being NENs. There are more lung cancer NENs than any other cancer site (1,800 cases in 2021), followed by colorectal cancer (825 cases) and then small intestine cancer (476 cases). Respectively, NENs account for 14%, 5.5% and 55% of the aforementioned cancers.
NENs include neuroendocrine carcinomas, neuroendocrine tumours, mixed neuroendocrine and non-neuroendocrine neoplasms and non-epithelial neoplasms. In 2021, these types of NENs respectively accounted for 50%, 46%, 2% and 2% of the total NENs but the general composition may change depending on the cancer site. As occurs for cancer more generally, the 5-year survival for NENs varies considerably by cancer site and histological type. Table 4 provides the 5-year relative survival for the most commonly diagnosed cancer sites by NENs type, as well as the cancer overall (that is, NENs and all other histologies). NENs carcinomas survival is much less than tumours and the table highlights that cancer survival for a cancer site can differ considerably depending on the histological type.
| Cancer site/type | NENs carcinomas | NENs tumours | Mixed neuroendocrine and non-neuroendocrine | Non-epithelial neuroendocrine neoplasms | All NENs | All cancer types |
|---|---|---|---|---|---|---|
| All cancers | 22.5% | 90.5% | 38.4% | 92.7% | 53.0% | 71.6% |
| Lung cancer | 9.7% | 91.2% | 14.9% | n.p. | 23.2% | 27.3% |
| Colorectal cancer | 47.4% | 97.1% | 55.1% | n.p. | 89.4% | 71.6% |
| Small intestine cancer | 73.0% | 89.5% | n.p. | n.p. | 87.5% | 69.3% |
| Non-melanoma skin cancer (rare types) | 56.6% | n.p. | n.p. | n.p. | 56.6% | 72.8% |
| Pancreatic cancer | 43.7% | 86.0% | n.p. | n.p. | 76.0% | 13.5% |
| Unknown primary site | 19.9% | 51.3% | n.p. | n.p. | 29.6% | 13.2% |
| Stomach cancer | 29.3% | 92.4% | n.p. | n.p. | 78.9% | 39.5% |
Note
n.p. = not published
Source: AIHW Australian Cancer Database 2021
Blood cancers account for over 10% of the cancer diagnosed
All blood cancers combined is the aggregate of many different types of blood cancer. While all blood cancers combined is useful for detailing the overall number of cases and general survival of these cancers in Australia, different types of blood cancer often have different incidence and mortality trends and survival rates.
In 2025, it is estimated that around 20,000 people will be diagnosed with a blood cancer (58% in males). The most common type of blood cancer in 2025 is estimated to be non-Hodgkin lymphoma followed by multiple myeloma and then chronic lymphocytic leukaemia.
Blood cancers accounted for an estimated 12% of all cancer cases in 2025. However, blood cancers were particularly common in the 0–19-year-old age group accounting for an estimated 40% of all cancer cases. While not a common cancer in the general population, acute lymphoblastic leukaemia was the most common cancer diagnosed in 0–19-year-olds (estimated to account for 19% of all cancer cases for the age group in 2025).
Age-standardised incidence rates for blood cancer increased from 66 cases per 100,000 in 2003 to an estimated 73 cases in 2025. Males have had consistently higher rates of all blood cancers combined than females (estimated 90 compared to 57 cases per 100,000 males and females respectively in 2025).
Five-year survival increased slightly from 67% in 2012–2016 to 70% in 2017–2021. In 2017–2021, survival was over 90% for age groups 0–19 and 20–39 and then decreased with increasing age group from 85% in 40–59-year-olds to 70% in 60–79-year-olds to 44% for those aged 80 years older. There is substantial variation in survival between different types of blood cancer. Blood cancers with comparatively higher 5-year survival in 2017–2021 were immunoproliferative cancers (93%), Hodgkin lymphoma (89%), and chronic lymphocytic leukaemia (88%). Lower survival blood cancers included acute myeloid leukaemia (27%) and myelodysplastic syndromes (38%).
Age-standardised blood cancer mortality decreased from 26 deaths per 100,000 people in 2007 to an estimated 22 deaths per 100,000 people in 2025. This decrease was seen in both males and females although males had consistently higher mortality rates.
The Cancer data in Australia report contains a considerable amount of data on blood cancers. More specifically, it provides a greater depth of incidence and survival rates. For example, Hodgkin lymphoma incidence and survival statistics are accompanied by statistics on types of Hodgkin lymphoma such as nodular lymphocyte predominant Hodgkin, classic Hodgkin lymphoma and the subtypes nodular sclerosis classic Hodgkin lymphoma, lymphocyte-rich classic Hodgkin lymphoma, mixed cellularity classic Hodgkin lymphoma and lymphocyte-depleted classic Hodgkin lymphoma. The Blood cancer by histology data visualisations provide more detailed blood cancer statistics.
Around 10% of female cancer deaths are from gynaecological cancers
Gynaecological cancers include cervical cancer, ovarian cancer, placental cancer, uterine cancer, vaginal cancer, vulvar cancer, and cancer of other female genital organs. Gynaecological cancer is estimated to account for around 9.4% of cancers diagnosed in females in 2025 and around 9.8% of female deaths from cancer.
In the following paragraphs, ovarian cancer and serous carcinomas of the fallopian tube are discussed rather than ovarian cancer. This is because the time series for this cancer appears to better reflect ovarian cancer as it is more traditionally understood while ovarian cancer trends are complicated by the changed understanding of where many serous carcinomas originate (see Cancer data commentary 5 for more information).
Gynaecological cancer incidence rates ranged between 49 and 53 cases per 100,000 females between 1982 and 1994 before decreasing to a low of 45 cases per 100,000 females in 2003. Decreases in cervical cancer incidence drove the reduction where rates decreased from 14 to 7.7 cases per 100,000 females between 1994 and 2003. The National Cervical Cancer Screening program was introduced in 1991 and led to falls in cervical cancer incidence and mortality due to the program’s ability to detect pre-cancerous abnormalities that may, if left, progress to cancer.
Infection with human papillomavirus (HPV) is the main risk factor for cervical cancer. Since 2007, females aged 12–13 have received vaccination against human papillomavirus (HPV) as part of a national vaccination program. Around the time the national vaccination program was introduced, a catch-up program was also established for females aged 14–26, which ran from 2007 to 2009. Cervical cancer incidence rates have been noticeably decreasing when the population aged around 18 in 2007 enters an age group. For example, the 25–29 age group incidence rates started to decrease in 2014 (9.3 cases per 100,000 females in 2013 to an estimated 0.5 in 2025) and the 30–34 age group from around 2020. Twenty-five year olds in 2014 would be around 18 years of age in 2007 while 30-year-olds in 2020 would be around 17 in 2007. Should the trends continue, as these younger populations age and represent greater proportions of the population, cervical cancer incidence rates should decrease considerably.
Since 2003, gynaecological cancer incidence has gradually increased to an estimated 49 cases per 100,000 females in 2025. Uterine cancer has largely influenced this change and increased from 20 to an estimated 24 cases per 100,000 females between 2003 and 2025. Uterine cancer incidence had been increasing before this time and has been steadily and gradually increasing since 1989 (16 cases per 100,000 females).
Five-year survival for gynaecological cancers has improved from 63% in 1987–1991 to 71% in 2017–2021. There is substantial variation in survival between different types of gynaecological cancers. The gynaecological cancers with the highest survival in 2017–2021 were placental (95%), and uterine (83%). Lower survival gynaecological cancers include ovarian cancer and serous carcinomas of the fallopian tube (49%) and vaginal cancer (53%). The 5-year survival rates for ovarian cancer and serous carcinomas of the fallopian tube have improved over time, increasing from 36% in 1987–1991.
The age-standardised mortality rate for gynaecological cancer has declined from 18 deaths per 100,000 females in 2000 to an estimated 16 deaths per 100,000 females in 2025. Age-standardised mortality rates for cervical cancer decreased from 3.2 deaths per 100,000 females in 2000 to an estimated 1.8 deaths in 2025. Age-standardised mortality rates for uterine cancer increased from 3.3 deaths per 100,000 females in 2000 to an estimated 4.8 deaths in 2025.
In 2025, ovarian cancer and serous carcinomas of the fallopian tube are estimated to account for around 27% of the gynaecological cancers diagnosed. With survival lower than other gynaecological cancers, and an estimated 1,064 deaths in 2025, ovarian cancer and serous carcinomas of the fallopian tube are estimated to account for 46% of the 2,300 deaths from gynaecological cancer in 2025.
Brain cancer 5-year survival remains below 30% but have improved over time
Brain cancer incidence rates from 2000 to 2025 ranged between 7.4 and 8.5 cases per 100,000 people. Males had higher incidence rates than females throughout this period. In 2025, the incidence rate for males is estimated to be 9.5 cases per 100,000 males and the rate for females is estimated to be 5.8 cases per 100,000 females (persons is estimated to be 7.6 cases per 100,000 people).
Survival vastly differs by age; in 2017–2021, 5-year survival for brain cancer was 63% for 0–19-year-olds, 70% for 20–39-year-olds, 29% for 40–59-year-olds, 8.9% for 60–79-year-olds and 1.8% for people aged 80 years and over.
Overall, brain cancer survival improved from 21% in 1987–1991 to 24% in 2017–2021. Brain cancer survival rates over time are often impacted by changes in the age composition of those diagnosed with brain cancer. In particular, greater proportions of older people have been diagnosed as time has progressed and older people tend to have lower survival rates. When adjusted for age, 5-year survival for brain cancer has more than doubled from 11% in 1987–1991 to 24% in 2017–2021.
The mortality rate for brain cancer ranged from 5.9 to 7.0 deaths per 100,000 people between 2000 and 2025. Close to the average mortality rate of 6.3 deaths per 100,000 people for this century, the estimated mortality rate for brain cancer in 2025 is 5.9 deaths per 100,000 people.
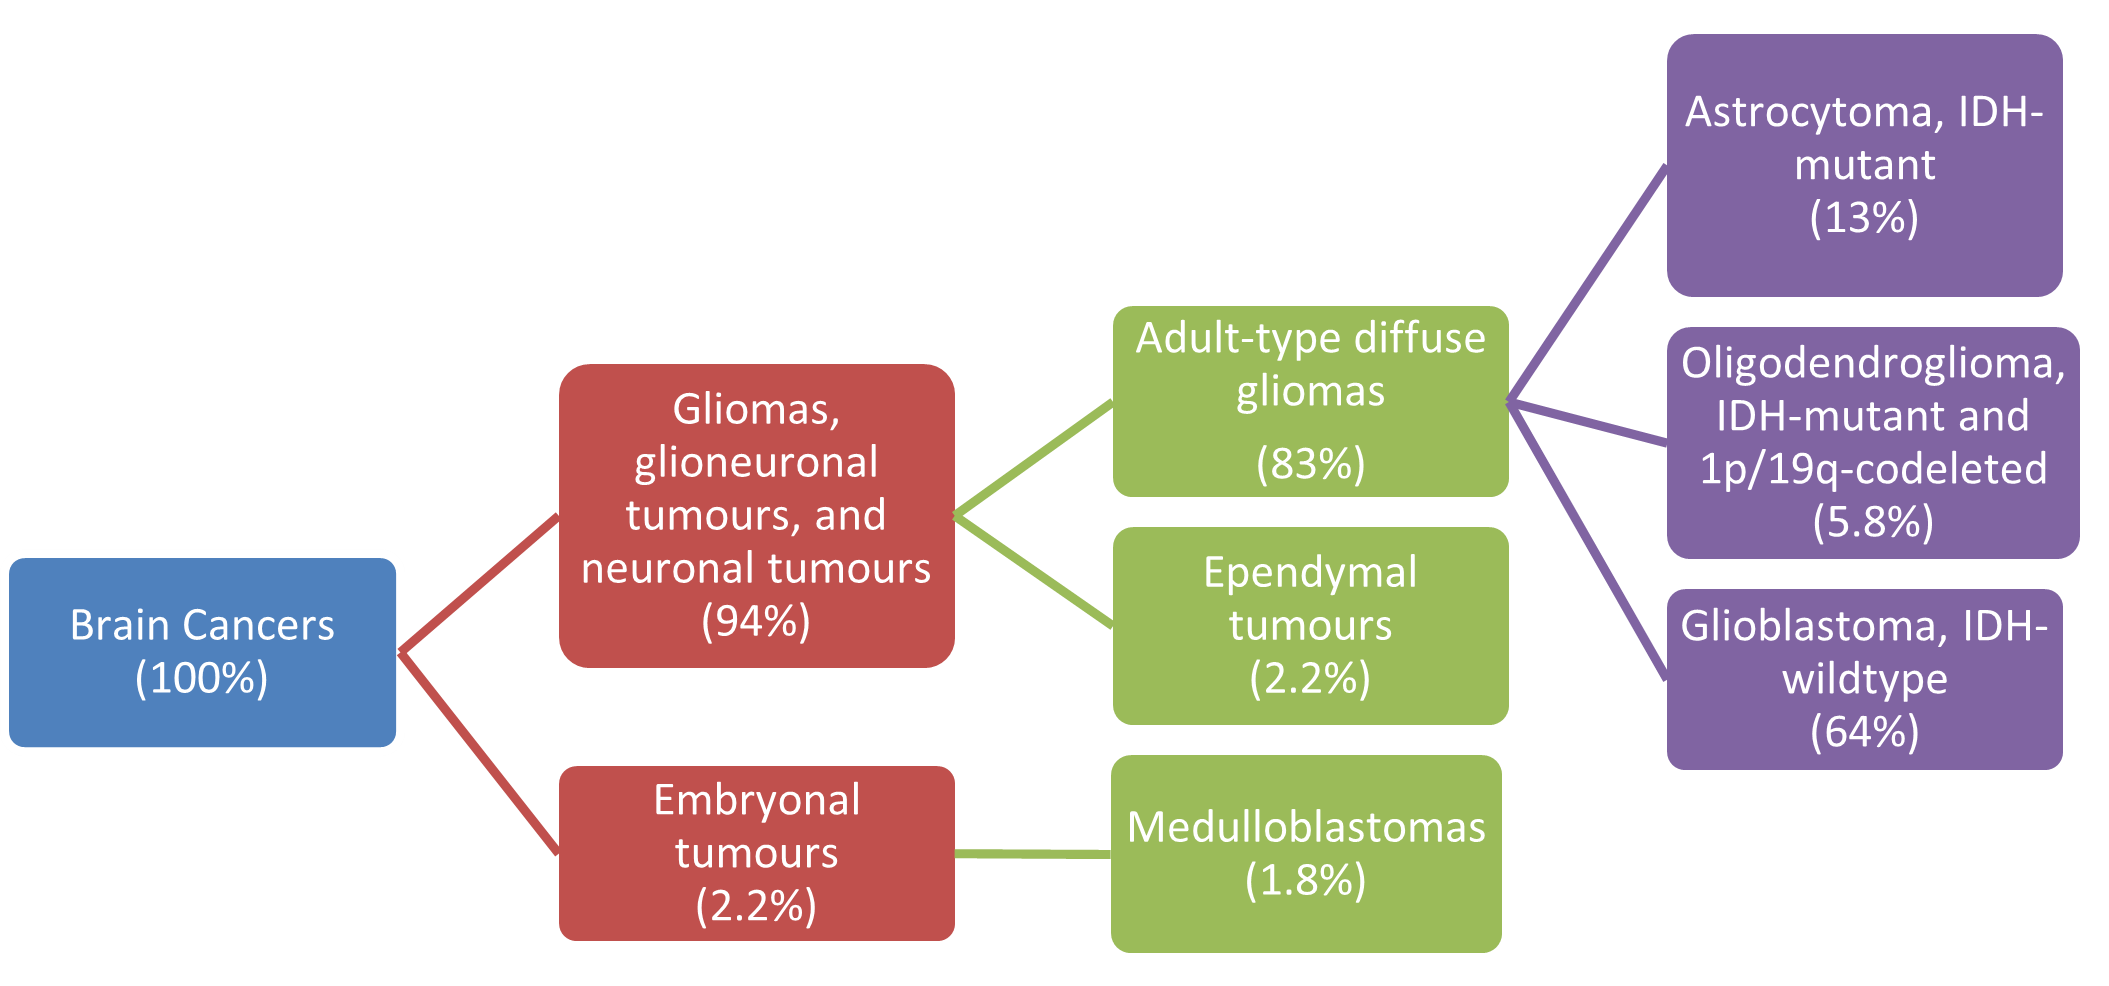
The most common types of brain cancer were gliomas, glioneuronal tumours and neuronal tumours, which accounted for 94% of brain cancers diagnosed in 2021. Embryonal tumours only accounted for 2.2% of brain cancers in the general population but 27% of brain cancers in 0–19-year-olds. Survival varies considerably for different types of brain cancer. ‘Glioblastomas, IDH-wildtype’ accounted for 64% of all brain cancers in 2021 and had a 5-year relative survival of only 6.3% in 2017–2021. ‘Oligodendroglioma, IDH-mutant and 1p/19q-codeleted’ accounted for 5.8% of brain cancer cases and had 86% survival.
Figure 7: Brain cancer incidence, selected types, persons, 2021
Source: AIHW Australian Cancer Database 2021
Males are over-represented in thyroid cancer deaths
Thyroid cancer is a common cancer, particularly among females. In 2025, it is estimated that around 4,355 cases will be diagnosed, approximately 69% of which will be in females.
The incidence of thyroid cancer increased from 8.5 cases per 100,000 females in 2000 to an estimated 21 cases in 2025. While lower, the incidence rates for males have also increased from 3.3 cases to an estimated 10.0 cases per 100,000 males over the same period. The increase in thyroid cancer may be due to an increase in medical surveillance and the introduction of new diagnostic techniques such as neck ultrasonography (Vaccarella et al. 2016).
While thyroid cancer is common, it is a high survival cancer resulting in relatively few deaths. Five-year survival is higher for females than males (98% and 94% in 2017–2021 respectively).
Despite an increase in the incidence rate, the mortality rate for thyroid cancer has been broadly stable since 2000, between 0.5 and 0.7 cases per 100,000 people. However, males are overrepresented in deaths from thyroid cancer. While it is estimated that only around 31% of thyroid cancer cases in 2025 will be in males, around half of the deaths are estimated to be males (90 of the 179 deaths in 2025).
Around 12% of cancers diagnosed are rare cancers
Rare Cancers Australia and RARECARENet defines a cancer to be ‘rare’ if it has an incidence rate of less than 6 cases per 100,000 people per year. If the incidence rate is greater than or equal to 6 cases per 100,000 people per year but less than 12 cases per 100,000 people per year, the cancer is ‘less common’. ‘Common’ cancers are defined as those with an incidence rate of 12 or more cases per 100,000 people per year. Crude incidence rates are used to define cancer rarity.
Cancers can change rarity over time. For instance, cancers that changed from rare to less common between 2000 and 2025 were chronic lymphocytic leukaemia, liver cancer, multiple myeloma, non-melanoma skin cancer, myeloproliferative neoplasms and oesophageal cancer. Cancers that changed from less common to common were bladder cancer, kidney cancer and pancreatic cancer. Thyroid cancer was the only cancer to go from rare to common between 2000 and 2025.
For last year’s report, sex specific cancer rarity was based on the rate for the specific sex. For this year’s release and for consistency with all other cancers, the rarity is based on the rate within the whole population (for persons). Focussing on 2025, this changes rarity for the following cancers:
- Ovarian cancer and serous carcinomas of the fallopian tube are categorised as a less common cancer when considered by the population rate but a common cancer for females.
- cervical cancer is a rare cancer within the population but less common for females.
- testicular cancer is a rare cancer within the population and less common for males.
In 2025, uterine cancer is a common cancer, irrespective of whether the rarity is based on the population or that occurring in females. However, uterine cancer changes from a less common cancer in 2000 to a common cancer by 2025 when rarity is based on the population rate; it would have consistently been a common cancer for females.
Rare cancers are individually rare, but collectively are estimated to account for 12% of all cancer cases diagnosed in 2025. Less common cancers are estimated to account for around 13% of cancer cases in 2025 and common cancers for around 74% of cases. While rare and less common cancers are estimated to collectively account for 26% of cases in 2025, they are estimated to account for 36% of cancer deaths in 2025 (Table 5).
| Type | Number of cases | Percent of all cancer cases | Number of deaths | Percent of all deaths |
|---|---|---|---|---|
| Rare cancers | 20,446 | 12% | 7,460 | 15% |
| Less common cancers | 22,138 | 13% | 10,262 | 21% |
| Common cancers | 124,345 | 74% | 31,512 | 64% |
Notes:
- Rare cancers are those with incidence rates of less than 6 cases per 100,000 people. Less common cancers are those with incidence rates of at least 6 and less than 12 cases per 100,000 people. Common cancers are those with incidence rates of 12 or more cases per 100,000 people (with rarity based on estimated rates from 2025).
- Individual cancers were grouped based on rarity and the numbers of new cases were summed accordingly. Unknown primary site and cancer of other and ill-defined sites are excluded from cancer rarity classification.
- The sum of cancers by rarity for mortality will not equal all cancers combined estimated as stated from either the NMD or ACD as the individual cancers in the cancer rarity estimates were sourced from whichever of the NMD or ACD are recommended for use.
- Non-melanoma skin cancer rarity classification is derived from cancer incidence rates that exclude basal and squamous cell carcinomas of the skin. For consistency, non-melanoma skin cancer mortality also excludes basal and squamous cell carcinomas of the skin.
- The sum of cancers by rarity will not equal all cancers combined incidence totals from the ACD as the small number of bone cancers outside of C40-C41 ICD-10 coding are coded to bone cancer as well as the relevant ICD-10 site.
- Cancer incidence and mortality counts and proportions may change depending on the cancers included within analysis.
Source: AIHW Australian Cancer Database 2021 and National Mortality Database
Cancer rarity classifications using the International Classification of Diseases – Tenth Revision (ICD-10)
Histology refers to the cells or soft tissue in which cancer originates. ICD-10 coding generally relates to the site of the body. The cancer by rarity information within this report understates the number of cancers classified as rare in Australia compared to if histology was used to classify rarity – at present ICD-10 is used. The following helps to illustrate how cancer rarity would change when using histology information.
Prostate cancer is a common cancer. Using the ICD-10 framework, all 26,500 prostate cancer cases in 2021 were counted as common cancers. However, there are different types of prostate cancer when considered by histology – these include acinar adenocarcinoma and adenocarcinoma (NOS), infiltrating duct carcinoma (NOS), small cell carcinoma and mixed acinar-ductal carcinoma and many other types. In 2021, around 25,300 of the 26,500 prostate cancers were acinar adenocarcinoma and adenocarcinomas (NOS) and these would remain as classified as common cancers in a histology framework for cancer rarity. Each of the other mentioned prostate cancers would be categorised as rare cancers.
The prostate cancers are different types and their outcomes differ but the ICD-10 considers these only as 'prostate cancer' and a 'common cancer'. If histology were used, there would be several hundred other cases of prostate cancer categorised as rare cancers in 2021. Similarly, all other common and less common cancers such as breast cancer, lung cancer, liver cancer and so on, would likely see a portion of the cancer types by histology categorised as rare cancers.
Each year in the CdiA, the number of cancers sites reported by histology has been increasing. Once all sites have their histology structure mapped for reporting, it will be possible to consider cancer rarity reporting by histology within this report.
Rare Cancers Australia notes several of the specific challenges presented by rare and less common cancers. These include:
- late diagnosis
- unclear prognosis
- limited research or clinical expertise
- barriers to treatment including high out-of-pocket costs, fewer treatment options, and a lack of rural and remote services
- poorer survival outcomes compared to common cancers (RCA, 2025).
Between 1987–1991 and 2017–2021, rare cancers in Australia have not recorded the same degree of improvement in survival outcomes as less common or common cancers. The 5-year survival for the common cancer group increased by around 23 percentage points, the less common cancer group increased by around 15 percentage points and rare cancers by around 14 percentage points. When considered in terms of percentage increases, rare cancers 5-year survival increased by around 29% while common and less common cancers each increased by around 41% (Table 6).
Cancers can change rarity classification over time. Please note that the survival by rarity for Table 6 represents the survival rates for rarity based on 1987 cancer rates and rarity classifications.
Survival rates by rarity for 2017–2021 based on 2025 rarity would see rare cancers survival as 63%, less common cancers at 49% and common cancers as 78%. Future survival rates will be able to consider whether the rare cancers of today, overall, improve more slowly than more common cancers. Less common cancers continue to include a higher proportion of cancers with lower survival rates such as brain cancer and liver cancer.
| Type | Survival 1987–1991 | Survival 2017–2021 |
|---|---|---|
| Rare cancers | 49% | 63% |
| Less common cancers | 37% | 53% |
| Common cancers | 56% | 80% |
Notes:
- Rare cancers are those with incidence rates of less than 6 cases per 100,000 people. Less common cancers are those with incidence rates of at least 6 and less than 12 cases per 100,000 people. Common cancers are those with incidence rates of 12 or more cases per 100,000 people.
- Rarity for this table used ICD-10 structure for cancers and 1987 rates to classify the rarity group for individual cancers.
- Non-melanoma skin cancer rarity classification is derived from cancer incidence rates that exclude basal and squamous cell carcinomas of the skin.
Source: AIHW Australian Cancer Database 2021
The following visualisation helps to understand cancer incidence by rarity over time. Caution is recommended interpreting the data as a time series. Changes in rates may be due to a cancer changing its rarity classification (for example, a rare cancer's rates increase and thereby becomes a less common cancer). The information does however illustrate that common cancers consistently represent the majority of cancers diagnosed in Australia. It also shows that while individually rare, rare cancers collectively consistently represent over 10% of the cancers diagnosed in Australia.
Figure 8 - Cancer incidence rates and counts, by cancer rarity groups (ICD-10), persons, 1982 to 2025
Figure 8 provides the incidence rates and counts by rarity groups. Across time, common cancers make up the majority of cancer cases but collectively, the rare and less common routinely represent around 1/3 and 1/5 of cancers across time.

Table 7: Cancer sites and types by rarity, cases crude and age-standardised incidence rates, 1982 to 2025
This table provides the list of cancers by rarity across time. A full list of cancer incidence rates is available in Excel within the Data Section.
