Improving the understanding of ovarian cancer statistics
Cancer data commentary No. 5
Ovarian cancer incidence rates have been decreasing, with some larger decreases in more recent years. Without additional context, it appears as though the real world risk of being diagnosed with ovarian cancer in Australia is reducing. However, the rate decreases are perhaps more due to research that has led to some cancers previously thought to be ovarian in origin now being considered cancers of the fallopian tube.
This commentary provides information to help understand ovarian cancer trends.
The issue impacting ovarian cancer data
Histology and cancer site
Fundamental to understanding the issue impacting ovarian cancer statistics is a familiarity with the terms ‘cancer histology’ and ‘cancer site’. Histology describes the types of cells in which cancer originates, while cancer site describes the site of the body where the cancer originates. A high grade serous carcinoma is an example of a histology while the ovaries are an example of a site.
Research improves the understanding of primary site of diagnosis
It was first recognised in 2001 that a high percentage of so-called ovarian high grade serous carcinomas (HGSCs) in women with certain genetic mutations actually begin in the fallopian tube rather than the ovary (Colgan et al. 2001; Piek et al. 2001). Further research indicated that the fallopian tube is also the primary site of HGSCs that are not associated with those mutations (Garg 2013). In 2015 the International Collaboration on Cancer Reporting guidelines for assigning the primary site of HGSCs were updated to reflect this new understanding (McCluggage et al. 2015). These influential guidelines have affected practice in pathology laboratories and hence cancer registries.
The impact of the research on ovarian cancer rates
Following the research, we would expect ovarian cancer rates to decrease to some extent. This is not because there is a real world reduced risk but because some cancers that would have previously been recorded as ovarian will be recorded as cancers of the fallopian tube.
The impact of the changes in the data on the ovarian cancer time series
Ovarian cancer time series are likely to be measuring different things at different points in time. Where decreasing rates occur, there may be uncertainty as to whether the apparent decreases are due to fewer real world cases or because more cases historically thought to be ovarian in origin are being recorded as cancers of the fallopian tube.
Defining the terms ‘historical understanding’ and ‘current understanding’
For the rest of this commentary, the term ‘historical understanding of ovarian cancer’ refers to ovarian cancer as well as the serous carcinomas of the fallopian tube that were previously thought to be ovarian cancers.
The term ‘current understanding of ovarian cancer’ is used to refer to ovarian cancer as it is now understood. It includes only cases where the ovaries are the primary site and excludes all cancers of the fallopian tube that were historically recorded as ovarian cancers.
There is no clear single break in time series
Ideally, all pathology reports involving the diagnosis of non-uterine HGSC would be based on a consistent understanding of the site where the cancer originated and these understandings would uniformly change when research dictates. If this were the case, we could clearly suggest the year when ovarian cancer rates changed from the historical understanding of ovarian cancer to the current understanding.
Unfortunately, with the complexity of determining histology, the evolving research and the diverse number of people making diagnoses, it can take some time before research findings are broadly accepted and changes are consistently implemented. Given this, it is not possible to identify a single point in time when ovarian cancer incidence rates changed from measuring the historical understanding of ovarian cancer to measuring the current understanding. Indeed, it is likely that for years following the research that incidence rates will be measuring a hybrid of current and historical understandings of ovarian cancer.
The above paragraphs highlight an issue impacting the data; it is not a comment on data collection practices. We would like to acknowledge the enduring efforts, the quality of work, and considerable expertise, of cancer registries and those in the medical field who provide the foundation from which the Australian Cancer Database (ACD) is produced.
Incidence rates
Measuring incidence rates based on the historical understanding of ovarian cancer
Our investigations into the quality of ovarian cancer data highlighted the need to improve the reliability of ovarian cancer rates. We have introduced the ‘ovarian cancer and serous carcinomas of the fallopian tube’ reporting group as a step towards this. This new reporting group is likely to suit the needs of people who wish to understand how ovarian cancer incidence rates, as ovarian cancer is historically understood, have changed over time.
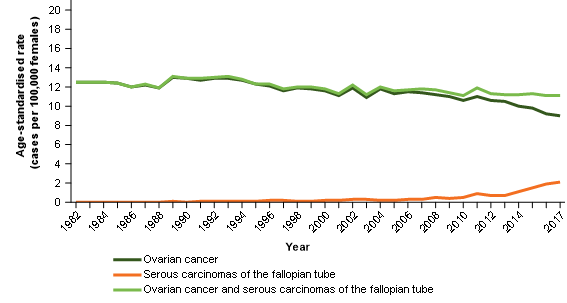
Figure 1 shows that the incidence rates for serous carcinomas of the fallopian tube have increased as ovarian cancer decreased. A proportion of these changes are likely the result of a shift in the understanding of the site rather than independent increases/decreases; larger offsetting movements are evident from 2012.
The new combined reporting group (ovarian cancer and serous carcinomas of the fallopian tube) is much more stable over time. The speculated movements from ovarian cancer to cancer of the fallopian tube are offset within the new combined reporting group (Figure 1).
Figure 1: Age-standardised incidence rates, females, 1982 to 2017
Notes:
- 2017 rates include estimates for the Northern Territory and an estimate of late registrations for all other jurisdictions.
- 2016 rates include estimates of late registrations for the Northern Territory only.
Source: AIHW Australian Cancer Database 2017
We acknowledge that the ovarian cancer and serous carcinomas of the fallopian tube cancer group may include a small number of serous carcinomas of the fallopian tube that may historically always have been diagnosed as such.
Appendix 1 outlines which histologies are included within serous carcinomas of the fallopian tube and mentions why these have been selected.
Measuring incidence rates based on the current understanding of ovarian cancer
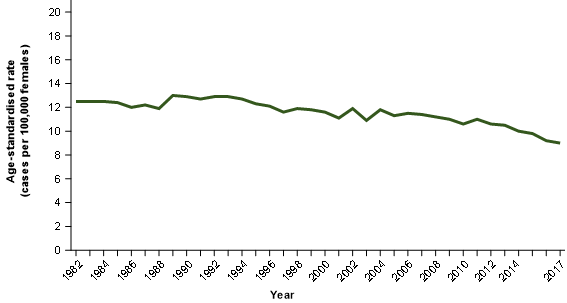
The 2017 incidence rate is likely to be the best estimate of ovarian cancer based on the current understanding but may still include some serous carcinomas of the fallopian tube (Figure 2).
Figure 2: Ovarian cancer age-standardised incidence rates, females, 1982 to 2017
Notes:
- 2017 rates include estimates for the Northern Territory and an estimate of late registrations for all other jurisdictions.
- 2016 rates include estimates of late registrations for the Northern Territory only.
Source: AIHW Australian Cancer Database 2017
We will continue to publish ovarian cancer incidence rates but will either refer data users to this commentary or provide the following caution:
Rates for more recent years are unlikely to be comparable with earlier years. Earlier years are more likely to include serous carcinomas of the fallopian tube while the most recent years are less likely to do so.
Ovarian cancer incidence time series based on the current understanding are likely to be of a poor quality. We expect that as time progresses, future years of ovarian cancer incidence rates will better measure the current understanding of ovarian cancer and time series will become more reliable.
Ovarian cancer incidence projections
For the 2021 Cancer data in Australia report (CdiA), actual cancer incidence data is available up to 2017 and projections are available for 2018 to 2021. Projections have been made for ‘ovarian cancer and serous carcinomas of the fallopian tube’ but not for ovarian cancer.
This is because projections are produced based on the premise that trends occurring over the most recent 10 years are a reasonable basis from which to project future cancer rates. Unfortunately, there is too much uncertainty within the ovarian cancer incidence rate time series to provide a reasonable basis to derive projections.
Survival rates
Both incidence and survival rates are derived from the ACD. Ovarian cancer survival rates are provided in Table 1. The recommendations outlined in the incidence section also apply to survival rates and all data derived from the ACD. More precisely:
- the ‘ovarian cancer and serous carcinomas of the fallopian tube’ survival rates better align with the historical understanding of ovarian cancer.
- The most recent ovarian cancer best aligns with the current understanding of ovarian cancer.
- Ovarian cancer survival rates from earlier years are likely to include more serous carcinomas of the fallopian tube and may not be directly comparable with later years.
| Period | Ovarian cancer 5-year relative survival rate | Ovarian cancer Confidence interval (95%) | Ovarian cancer and serous carcinomas of the fallopian tube 5-year relative survival rate | Ovarian cancer and serious carcinomas of the fallopian tube Confidence interval (95%) |
|---|---|---|---|---|
| 1988–1992 | 37.4% | 35.9% – 38.9% | 37.4% | 35.9% – 38.9% |
| 1993–1997 | 40.3% | 38.9% – 41.7% | 40.4% | 39.0% – 41.8% |
| 1998–2002 | 40.6% | 39.2% – 42.0% | 40.7% | 39.3% – 42.1% |
| 2003–2007 | 41.7% | 40.4% – 43.1% | 42.2% | 40.8% – 43.5% |
| 2008–2012 | 44.1% | 42.8% – 45.4% | 44.8% | 43.5% – 46.1% |
| 2013–2017 | 47.1% | 45.8% – 48.4% | 48.1% | 46.9% – 49.4% |
Source: AIHW Australian Cancer Database 2017
Mortality rates
Unlike incidence and survival data, mortality data are sourced from the National Mortality Database (NMD), not the ACD. NMD data are derived from information recorded on death certificates. Therefore, the NMD does not include histology information nor have access to some of the additional information used to derive the ACD data, which enables cancer type to be more accurately assigned in the ACD in some cases.
As the NMD data is based on less information than the ACD, it is likely to generally record the historical understanding of ovarian cancer. The two points discussed below support this possibility.
1. Cancers of the fallopian tube mortality rate trends remain quite constant
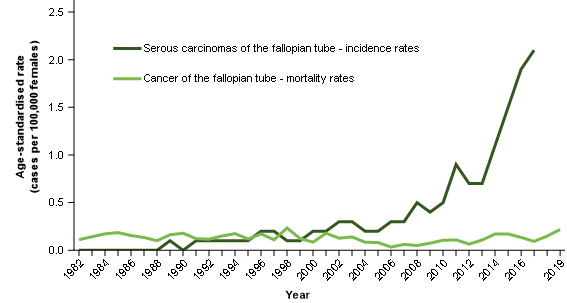
Figure 3 compares the serous cancers of the fallopian tube incidence rates with the fallopian tube cancer mortality rates. An exact comparison cannot be made because the NMD does not collect information about cancer histology. It is therefore not possible to isolate deaths from serous carcinomas of the fallopian tube, only deaths from all cancers of the fallopian tube (all histologies, not only serous carcinomas).
We would expect that the increasing incidence of cancers of the fallopian tube should lead to increasing mortality rates to some extent; this does not occur and mortality rates for cancers of the fallopian tube remain quite stable.
Figure 3: Age-standardised incidence rate for serous cancers of the fallopian tube comparison with age-standardised mortality rates for cancer of the fallopian tube
Notes:
- 2017 incidence rates include estimates for the Northern Territory and an estimate of late registrations for all other jurisdictions.
- 2016 incidence rates include estimates of late registrations for the Northern Territory only.
Source: AIHW Australian Cancer Database 2017 and AIHW National Mortality Database
2. Ovarian cancer mortality rates appear to align better with ‘ovarian cancer and serous carcinomas of the fallopian tube’ incidence rates
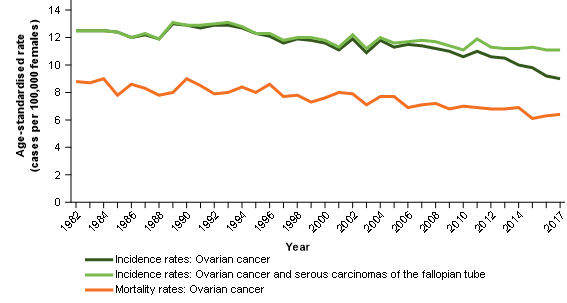
Ovarian cancer mortality rates have been decreasing over time (Figure 4). Reducing rates may be explained by improvements in survival (Table 1). Unlike ovarian cancer incidence rates, ovarian cancer mortality rates have not been decreasing sharply. This suggests that mortality data are not being impacted by ovarian cancer deaths (as historically understood) being recorded as cancer of the fallopian tube deaths (Figure 3).
Incidence, survival and mortality rates have the general relationship that, where data is coherent, improvements in survival should generally correspond with increases in the difference between incidence and mortality rates. For ovarian cancer incidence and ovarian cancer mortality comparisons – this is not the case (Figure 4)
Figure 4: Age-standardised incidence and mortality rates, selected cancers, females, 1982 to 2017
Notes:
- 2017 incidence rates include estimates for the Northern Territory and an estimate of late registrations for all other jurisdictions.
- 2016 incidence rates include estimates of late registrations for the Northern Territory only.
Source: AIHW Australian Cancer Database 2017 and AIHW National Mortality Database
Mortality to incidence ratio tests
We use mortality to incidence ratios to further explore the relationship between mortality and incidence data. Age-standardised mortality rates from the NMD are compared with age-standardised incidence rates from the ACD for each year and annual ratios are formed.
Survival rates have improved for ovarian cancer over time. Given this, the mortality to incidence ratio should be decreasing over time.
Figure 5 contrasts the mortality to incidence ratio for:
Series 1: Ovarian cancer age-standardised mortality rates / ovarian cancer and serous carcinomas of the fallopian tube age standardised incidence rates
Over time, the mortality to incidence ratio improves for series 1. This is to be expected where survival increases. The ovarian cancer mortality data appears to be measuring the historical understanding of ovarian cancer and these two data sources appear to provide complementary information about ovarian cancer as it is historically understood.
Series 2: Ovarian cancer age-standardised mortality rates / ovarian cancer age-standardised incidence rates
Over time, the incidence to mortality ratio for series 2 remains quite stable. This is not to be expected where survival is increasing.
The stability of the ratio likely occurs because the improvements in survival are resulting in fewer deaths but for the ratio, these are offset by the reduction of cases diagnosed as ovarian cancer (and instead diagnosed as cancer of the fallopian tube).
Figure 5: Age-standardised mortality rate to age-standardised incidence rate, rate ratios, selected cancers, females, 1982 to 2017
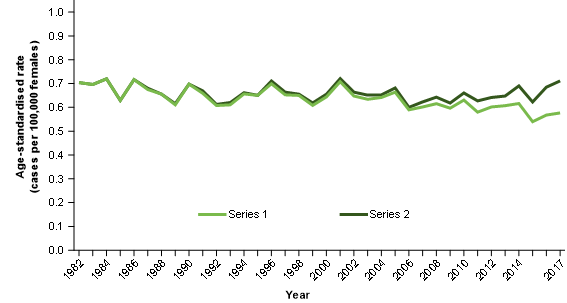
Notes:
- Series 1 = ovarian cancer age-standardised mortality rate divided by the ovarian cancer and serous carcinomas of the fallopian tube age-standardised incidence rate.
- Series 2 = ovarian cancer age-standardised mortality rate divided by the ovarian cancer age-standardised incidence rate.
- 2017 incidence rates include estimates for the Northern Territory and an estimate of late registrations for all other jurisdictions.
- 2016 incidence rates include estimates of late registrations for the Northern Territory only.
Source: AIHW Australian Cancer Database 2017 and AIHW National Mortality Database
Recommendations for how to use the data together
Ovarian cancer as it is historically understood
We believe the ovarian cancer and serous carcinomas of the fallopian tube group provides a useful representation of ovarian cancer as it is historically understood. This reporting group is available for cancer incidence, survival, prevalence and conditional survival.
Ovarian cancer mortality data is derived from the NMD and appears to provide a strong representation of ovarian cancer as it is historically understood. Within the CdiA, we will footnote data to note that ovarian cancer mortality rates likely include some cancers originating in the fallopian tube.
Ovarian cancer as it is currently understood
The most recent incidence and survival rates represent the closest estimate of ovarian cancer as it is currently understood but data should be used with a degree of caution, particularly in earlier years.
At present, national mortality rates do not exist for ovarian cancer as it is currently understood but possible approaches to remedy this are being considered for future CdiA releases.
Future work
Our work towards better understanding ovarian cancer incidence and mortality rates will continue into the future. As new data is received, the guidance provided within this paper may need to evolve. We will continue to monitor ovarian cancer rates and update advice within the CdiA data commentary series if necessary.
Appendix 1
ICD-10 and histology codes for the ovarian cancer and serous carcinomas of the fallopian tube group (derived from the ACD)
ICD10: C56 Ovarian cancer (all histologies)
ICD10: C570 Cancer of the fallopian tube (selected histologies)
ICD10: C578 Cancer of overlapping sites of female genital organs (selected histologies)
Selected histologies
8441 – Serous carcinoma not otherwise specified
8460 – Low grade serous carcinoma
8461 – High grade serous carcinoma
About the construction of the ovarian cancer and serous carcinomas of the fallopian tube group
The selected histologies were identified as the histologies that contributed to unusual increases in incidence rates for the C570 and C578 ICD10 codes. The increase was confirmed as likely being due to the change in understanding of ovarian cancer. It is acknowledged that some increase in serous carcinomas of the fallopian tube may not be directly related to changes in ovarian cancer rates. However, given the generally low rates of serous carcinomas of the fallopian tube, it is speculated that increases in serous carcinomas of the fallopian tube are mostly related to changes in the understandings of ovarian cancer.
The group is called ‘ovarian cancer and serous carcinomas of the fallopian tube’ for simplicity and to reflect the general intent of what it aims to measure. However, the code C57.8 also includes cancer of two or more contiguous sites of the female genital organs whose point of origin cannot be determined. Therefore, this code may contain some cancers that are neither ovarian nor of the fallopian tube.
Given that serous carcinoma of the ovary remains a legitimate diagnosis, we cannot speculate on the extent to which current ovarian cancer incidence data may still contain cancers of the fallopian tube. This does not impact on the ovarian cancer and serous carcinomas of the fallopian tube group but may for those interested only in ovarian cancer as currently understood.