Prostate cancer – projection method changes, updated long-term prostate cancer incidence projections
Cancer data commentary number 9
The 2022 release of Cancer data in Australia (CdiA) included a change of methodology for calculating prostate cancer incidence projections. The impact of the change was that it greatly increased the estimated number of prostate cancers and correspondingly increased the estimated number of all cancers combined. This commentary provides more information about the method change, updates long-term prostate cancer incidence projections, and discusses the impacts of the ageing population on prostate cancer.
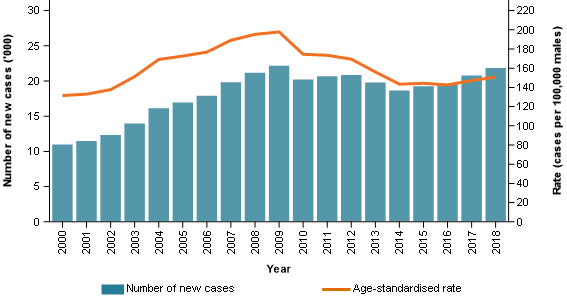
Figure 1 provides age-standardised prostate cancer incidence rates and prostate cancer cases diagnosed between 2000 and 2018. The following excerpt is taken from the Cancer in Australia 2021 report and sheds light on prostate cancer incidence trends for the majority of this century:
The prostate-specific antigen (PSA) threshold at which males were referred for a prostate biopsy was lowered in 2002 and this might have contributed to the peak incidence during the mid to late 2000s (Smith et al. 2008).
The increasing prostate cancer incidence rates observed in the early 2000s may, to some extent, be a consequence of bringing forward the diagnosis of some prostate cancer cases as well as diagnosing some prostate cancers that may not otherwise have ever been diagnosed (as symptoms may not have become apparent). The reduction in rates following the peak in 2009 may be at least partly due to rates re-adjusting after the initial spike.
In many countries, changes in prostate cancer diagnosis have been associated with changes in PSA testing (Zhou et al 2015), and in the US, decreasing prostate cancer incidence has been linked, in part, to previous early diagnosis of prostate cancer through widespread use of PSA testing (Downer et al 2017).
The prostate cancer trends may not accurately reflect whether prostate cancer is actually becoming more or less common in the population. Rather, much of the post-2000 rate trends may suggest only that prostate cancer remains very common in Australia; that many men are having PSA levels monitored; and that incidence rates are strongly influenced by the threshold at which prostate biopsies are recommended.
Figure 1: Prostate cancer, cases diagnosed and age-standardised incidence rates, males, 2000 to 2018

Note: Rates are age-standardised to the 2001 Australian Standard population.
Source: AIHW Australian Cancer Database 2018.
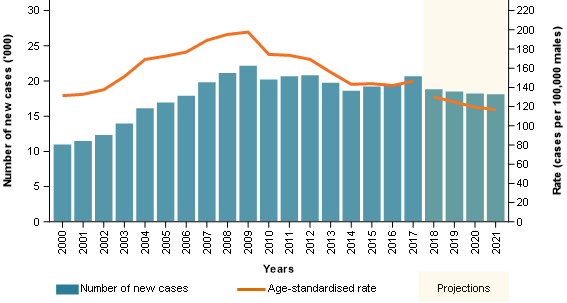
The prostate cancer incidence projection method was revised for the 2022 release of CdiA. Figure 2 provides the prostate cancer incidence data from the 2021 release of CdiA.
The 2021 release used the same projection method for prostate cancer as for all other cancers in CdiA. In general terms, the projection method uses trends from the last 10 years of actual data to generate projections. In the 2021 release, the 10-year trend is tending to decrease, and the projections also follow this general trend. The 10-year trend is strongly influenced by the large decreases that occurred from around 2009.
Figure 2: Prostate cancer, cases diagnosed and age-standardised incidence rates, males, 2000 to 2021 (from the 2021 release of Cancer data in Australia)

Note: Rates are age-standardised to the 2001 Australian Standard population.
Source: AIHW Australian Cancer Database 2018.
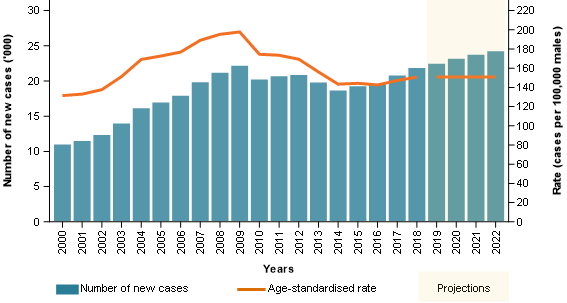
Figure 3 provides the prostate cancer incidence data from the 2022 release of the CdiA. Here, the age-standardised prostate cancer incidence rate projections remain quite constant, and the number of cases increases. In the 2022 release of CdiA, AIHW excluded prostate cancer from the usual projection method and instead held the most recent rates (by age group) steady and applied population growth estimates for those age groups to arrive at the new projected case counts. AIHW determined that the projected decreases in the 2021 release, and those that the usual method would have again forecast, were unlikely given there were now several years to suggest prostate cancer rates had stabilised and may have even started to increase slightly.
Figure 3: Prostate cancer, cases diagnosed and age-standardised incidence rates, males, 2000 to 2022 (from the 2022 release of Cancer data in Australia)

Note: Rates are age-standardised to the 2001 Australian Standard population.
Source: AIHW Australian Cancer Database 2018.
Long-term prostate cancer incidence projections to 2031 were released in the Cancer in Australia 2021 report. While the method to project long-term incidence projections is different to the short-term projection method, it also relied on the premise that historical trends may be reliably used to inform future projections. Like the short-term projection method, this method’s results were considered likely to be overly influenced by the decreasing incidence rates of prostate cancer. For similar reasons, and like the revision in short-term projections, the long-term projections of prostate cancer have also been revised.
The long-term prostate cancer incidence projections now use the same methodology as the short-term prostate cancer incidence projections. This method does not attempt to determine whether a cancer is becoming more common in various age groups, instead it simply uses the most recent actual incidence rates and applies these to the projected populations of the future. In other words, it only factors in population growth.
Table 1 provides the original and revised long-term prostate cancer incidence projections. The majority of the difference is due to method change but some of the difference is also due to the use of different population projections.
| Year | Cases (original method) | ASR (original method) | Cases (revised method) | ASR (revised method) |
|---|---|---|---|---|
| 2023 | 18,036 | 111.6 | 24,778 | 150.8 |
| 2024 | 17,955 | 109.0 | 25,321 | 150.8 |
| 2025 | 17,840 | 106.4 | 25,852 | 150.8 |
| 2026 | 18,058 | 105.7 | 26,397 | 150.8 |
| 2027 | 18,236 | 105.0 | 26,902 | 150.8 |
| 2028 | 18,399 | 104.3 | 27,404 | 150.8 |
| 2029 | 18,546 | 103.6 | 27,898 | 150.8 |
| 2030 | 18,668 | 103.0 | 28,352 | 150.8 |
| 2031 | 19,087 | 103.8 | 28,823 | 150.8 |
| 2032 | not available | not available | 29,260 | 150.8 |
Notes
- Age-standardised rates (ASR) are standardised to the 2001 Australian Standard population.
- The revised method ASRs are based on unrounded case projections.
Sources: AIHW Australian Cancer Database 2017, AIHW Australian Cancer Database 2018.
To derive short-term cancer incidence projections for cancers other than prostate cancer, the incidence trends for the most recent 10-year period for which actual data are available are used to estimate a projected incidence rate for each 5-year age group (from 0 to 4 years up to 85 to 89 and finally a group for those aged over 90). The projected rate of cancer for each age group is then applied to the estimated future population of each age group to arrive at the estimated number of cases for each age group. The aggregate of all the cases by age group is the projected total of cases for that cancer.
For prostate cancer, sharp incidence trends may occur for several years and end quite abruptly, and this is not a usual characteristic for most cancers. For context, the age-standardised incidence rate for lung cancer reduced from around 85 cases per 100,000 males in 1982 to 51 cases per 100,000 males in 2018. This reduction of 34 cases per 100,000 males has occurred over 36 years and is one of the largest and most enduring cancer incidence trends of all Australian cancers. Conversely, prostate cancer age-standardised incidence rates rose from 138 cases per 100,000 males in 2002 to 198 cases per 100,000 males in 2009 before decreasing to 143 cases per 100,000 males in 2014. The movements were sharp when compared to other cancers and greater than the total incidence of most types of cancer.
Whether prostate cancer will become more or less commonly diagnosed in some age groups and not others or be relatively stable is difficult to know. The revised prostate cancer incidence projection model acknowledges this through using stable incidence rates by age and has been adopted to remove the risk of a projection moving very sharply in a direction which may be improbable.
The revised model is a very simplistic and general projection model but still factors in the key element of population growth. The impact of the ageing population for prostate cancer is discussed in the following sections.
It is estimated that the male Australian population will increase by around 13% between 2022 and 2032. Over the same time period, prostate cancer case numbers are projected to increase by around 21%. The reason for the greater increase is because population growth is not consistent across different ages and prostate cancer is more commonly diagnosed in older populations where growth is projected to be greatest.
Table 2 provides the estimated increase in prostate cancer case numbers from 2022 to 2032 by age. The increase in case numbers for each age group is due only to population growth because the rates of cancer within each age group are held constant. The increasing crude prostate cancer incidence rate from 189 cases per 100,000 males in 2022 to 201 cases per 100,000 males in 2032 occurs because the older age groups with higher incidence rates of prostate cancer are increasing more than other age groups.
There is considerable uncertainty in the precision of long-term cancer projections, even more so for prostate cancer where the extent of PSA testing and prostate biopsy referral practices can lead to substantial changes. However, what appears much more certain is that greater numbers of men will be reaching the ages where prostate cancer incidence rates are highest.
| Age group (years) | Age-specific rate* | Cases 2022 | Cases 2032 | % change in cases |
|---|---|---|---|---|
| Under 60 | 35.3**# | 3,546 | 3,770 | 6% |
| 60 to 64 | 512.8 | 3,694 | 3,917 | 6% |
| 65 to 69 | 827.7 | 5,196 | 5,771 | 11% |
| 70 to 74 | 878.7 | 4,852 | 5,778 | 19% |
| 75 to 79 | 882.3 | 3,719 | 4,770 | 28% |
| 80 to 84 | 729.5 | 1,912 | 3,069 | 61% |
| 85 to 89 | 605.8 | 862 | 1,519 | 76% |
| 90 and over | 563.3 | 436 | 665 | 53% |
| All ages combined | 188.6 (2022) and 201.1 (2032) | 24,217 | 29,260 | 21% |
Notes
- Rates are expressed per 100,000 males.
- * The rate for ‘All ages’ is the crude rate for the population, all rates for other age-groups are age-specific rates.
- ** The age-specific rate for under 60 is the rate for 2022. The equivalent rate for 2032 is 34.0 cases. The age-specific rates for each 5-year age group remain the same.
- # The age-specific rates for the male population under 60 are heavily influenced by the rarity of cancer in the younger population. The age-specific rates for the male populations aged 50 to 54 is 117 cases per 100,000 males and for the 55 to 59 it is 295.7 cases per 100,000 males.
- The age-specific rates cited in the above table are based on 2022 published data and may not precisely equal the 2018 incidence rates (from which projections are derived) due to rounding.
Source: AIHW Australian Cancer Database 2018.
The prostate cancer mortality rate for the male population aged over 70 was 303 deaths per 100,000 males in 2010. By 2020 (the most recent year of actual mortality data), the mortality rate had decreased to 232 deaths per 100,000 males. This represents a substantial reduction in mortality rates. However, over the same time where mortality rates had been reducing, the number of deaths from prostate cancer for men aged over 70 increased from 2,771 men to 3,138 men. The increase occurred because the male population over 70 increased more than the associated reductions in mortality rates.
In 2020, around 88% of prostate cancer deaths occurred in the male population aged over 70. The number of deaths from prostate cancer (all ages) reached its highest recorded level in 2020 (3,138 deaths for males aged over 70 and 3,568 deaths overall). Note that this is the most recent year where actual data is available. While AIHW does not produce long-term cancer mortality projections, the impact of an ageing population is already evident within prostate cancer mortality statistics. Into the future, the increasing number of men reaching higher risk ages for prostate cancer is likely to lead to an increasing number of deaths from prostate cancer.


